| Param | Original file | Final file |
|---|---|---|
| Filename | modeM0/AS1A05_088T03_9000002808_18774cztM0_level2.evt | modeM0/AS1A05_088T03_9000002808_18774cztM0_level2_quad_clean.evt |
| Size (bytes) | 507,355,200 | 71,032,320 |
| Size | 483.9 MB | 67.7 MB |
| Events in quadrant A | 3,584,487 | 427,295 |
| Events in quadrant B | 3,703,607 | 432,465 |
| Events in quadrant C | 3,512,233 | 419,682 |
| Events in quadrant D | 4,121,135 | 415,252 |
| Mode M0 | |||
|---|---|---|---|
| Quadrant | BADHDUFLAG | Total packets | Discarded packets |
| A | 0 | 14544 | 2 |
| B | 0 | 14998 | 2 |
| C | 0 | 14183 | 2 |
| D | 0 | 16410 | 2 |
| Mode SS | |||
|---|---|---|---|
| Quadrant | BADHDUFLAG | Total packets | Discarded packets |
| A | 0 | 132 | 0 |
| B | 0 | 132 | 0 |
| C | 0 | 132 | 0 |
| D | 0 | 132 | 0 |
| Mode M9 | |||
|---|---|---|---|
| Quadrant | BADHDUFLAG | Total packets | Discarded packets |
| A | 0 | 20 | 0 |
| B | 0 | 21 | 0 |
| C | 0 | 21 | 0 |
| D | 0 | 21 | 0 |
| Quadrant | Total seconds | Saturated seconds | Saturation percentage |
|---|---|---|---|
| A | 6540 | 130 | 1.987768% |
| B | 6540 | 143 | 2.186544% |
| C | 6540 | 139 | 2.125382% |
| D | 6540 | 193 | 2.951070% |
Noise dominated data is calculated using 1-second bins in cleaned event files. If a bin has >2000 counts, and if more than 50% of those come from <1% of pixels, then it is considered to be noise-dominated and hence unusable.
| Quadrant | # 1 sec bins | Bins with >0 counts | Bins with >2000 counts | High rate bins dominated by noise | Noise dominated (total time) | Noise dominated (detector-on time) | Marked lightcurve |
|---|---|---|---|---|---|---|---|
| A | 7805 | 6541 | 15 | 15 | 0.19% | 0.23% | 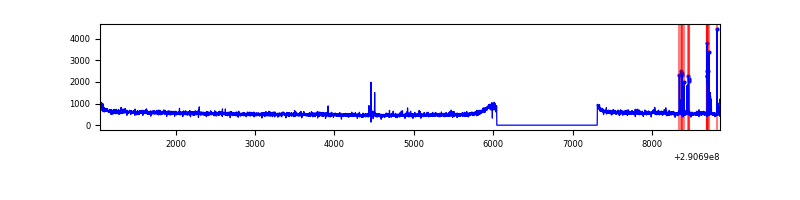 |
| B | 7805 | 6541 | 8 | 8 | 0.10% | 0.12% | 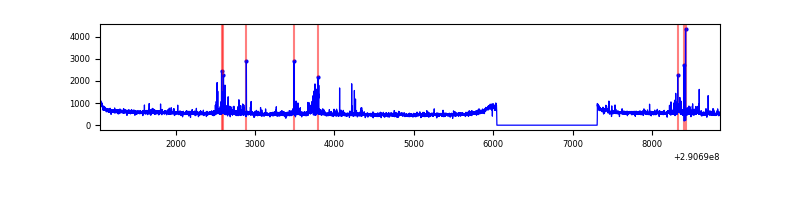 |
| C | 7805 | 6541 | 0 | 0 | 0.00% | 0.00% | 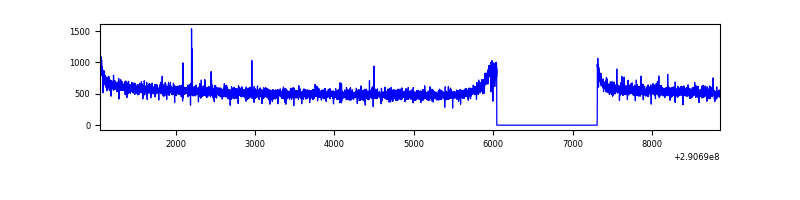 |
| D | 7805 | 6541 | 84 | 84 | 1.08% | 1.28% | 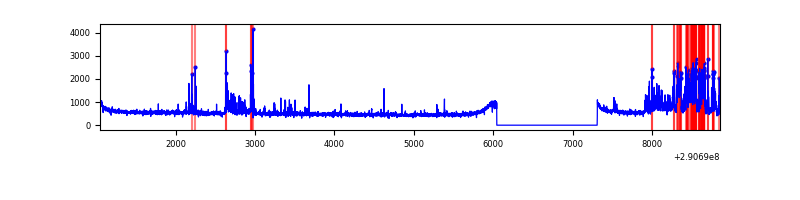 |
Top three noisy pixels from each quadrant. If the there are fewer than three noisy pixels in the level2.evt file, extra rows are filled as -1
| Pixel properties | Quadrant properties | ||||||
|---|---|---|---|---|---|---|---|
| Quadrant | DetID | PixID | Counts | Sigma | Mean | Median | Sigma |
| A | 6 | 16 | 65396 | 358.99 | 903 | 888 | 179.7 |
| A | 15 | 192 | 22610 | 120.88 | 903 | 888 | 179.7 |
| A | 11 | 29 | 11778 | 60.6 | 903 | 888 | 179.7 |
| B | 7 | 220 | 113477 | 673.2 | 889 | 870 | 167.3 |
| B | 0 | 197 | 54316 | 319.52 | 889 | 870 | 167.3 |
| B | 6 | 36 | 22302 | 128.13 | 889 | 870 | 167.3 |
| C | 14 | 238 | 137112 | 691.48 | 860 | 869 | 197.0 |
| C | 3 | 233 | 11312 | 53.0 | 860 | 869 | 197.0 |
| C | 0 | 207 | 10774 | 50.27 | 860 | 869 | 197.0 |
| D | 14 | 34 | 675182 | 3149.26 | 881 | 855 | 214.1 |
| D | 1 | 52 | 75616 | 349.15 | 881 | 855 | 214.1 |
| D | 2 | 234 | 32467 | 147.64 | 881 | 855 | 214.1 |
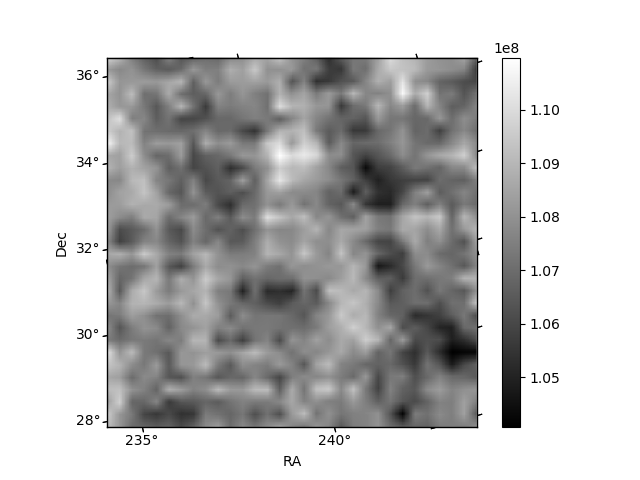
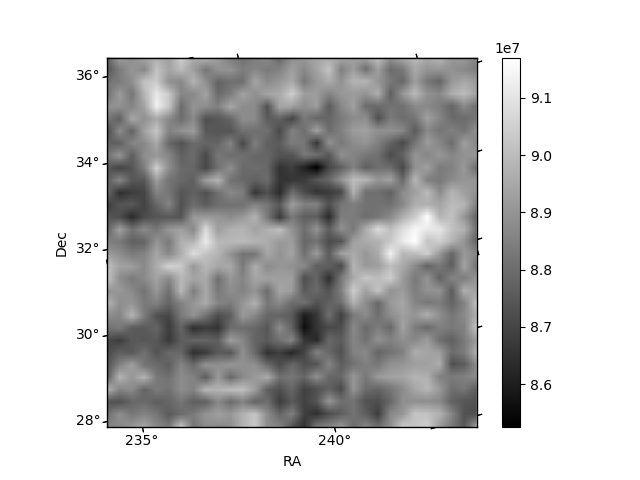
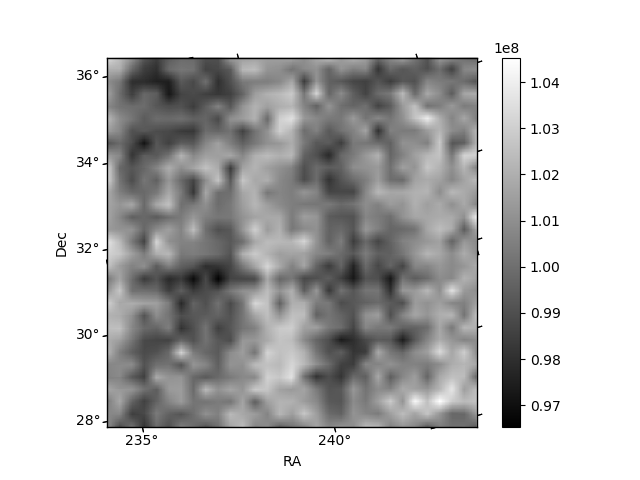
Histogram calculated using DETX and DETY for each event in the final _common_clean file
| Quadrant A | 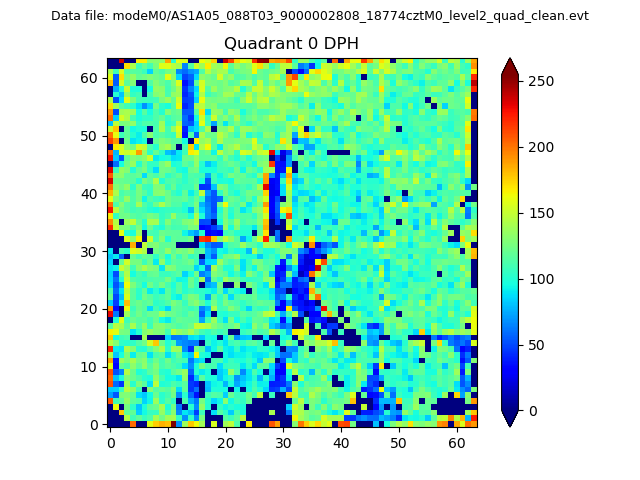 |
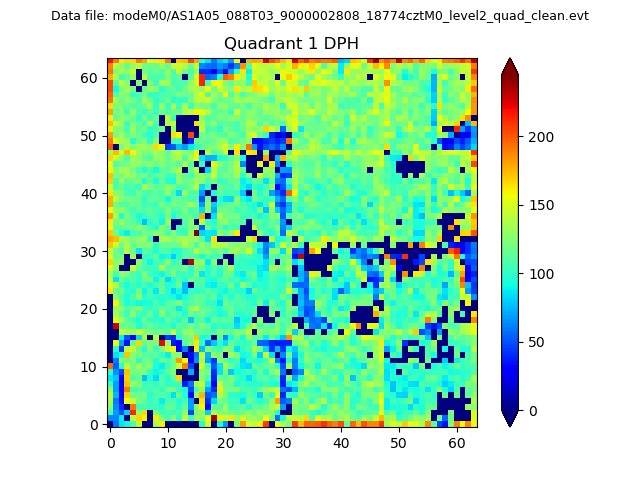 |
Quadrant B |
|---|---|---|---|
| Quadrant D |  |
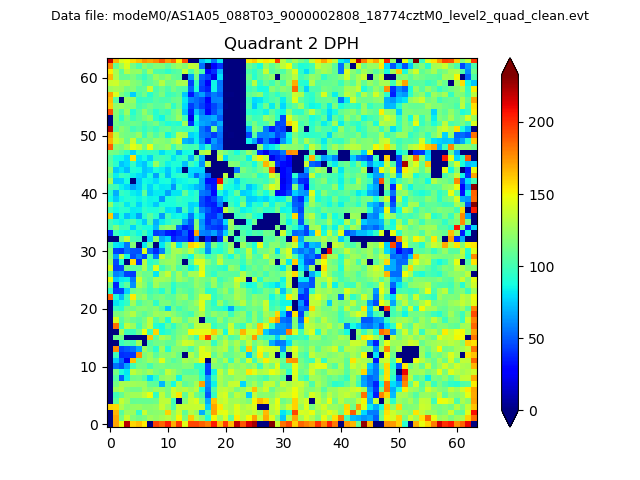 |
Quadrant C |
| Plot type | Count rate plots | Images |
|---|---|---|
| Comparison with Poisson distribution Blue bars denote a histogram of data divided into 1 sec bins. Red curve is a Poisson curve with rate = median count rate of data. |
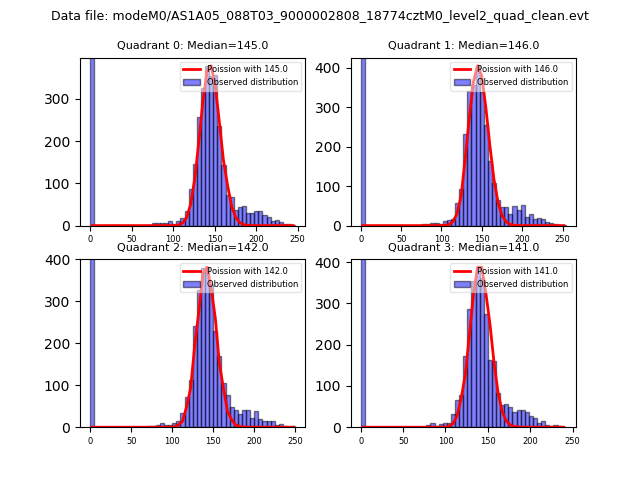 |
 |
| Quadrant-wise count rates Data is divided into 100 sec bins |
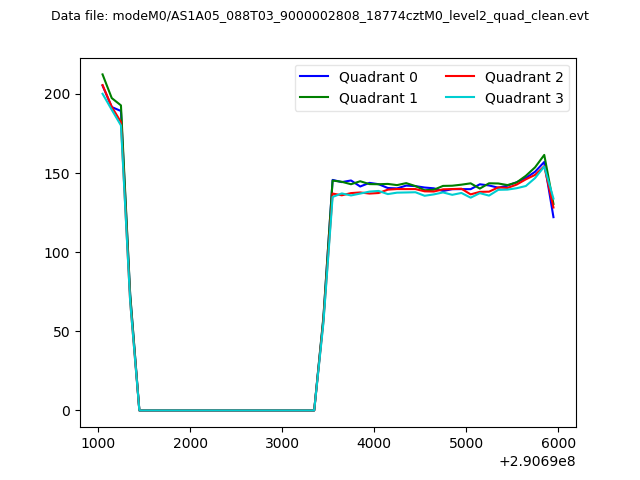 |
|
| Module-wise count rates for Quadrant A Data is divided into 100 sec bins |
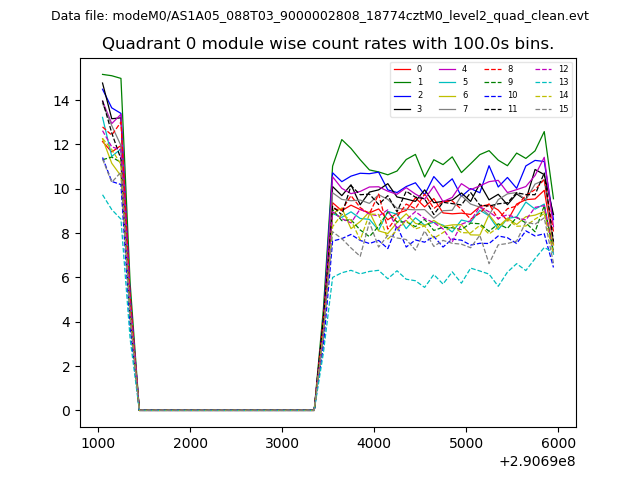 |
 |
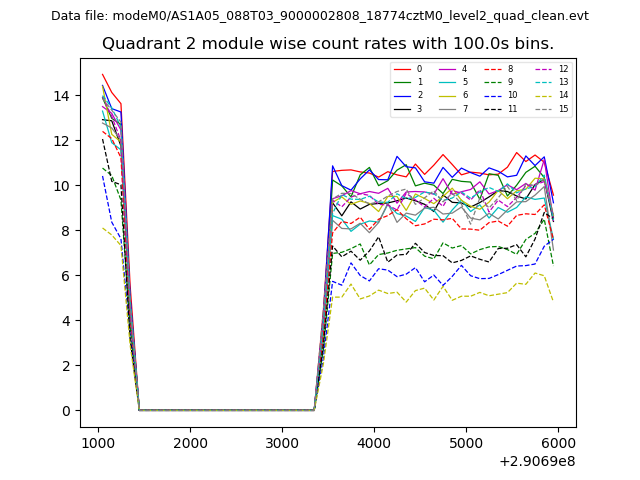
| Module-wise count rates for Quadrant B Data is divided into 100 sec bins |
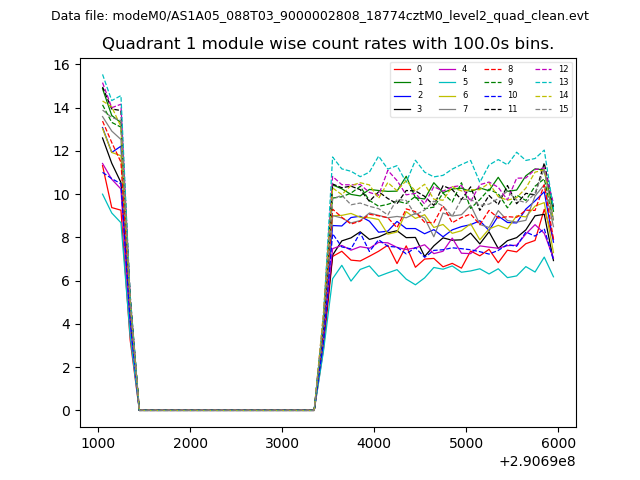 |
 |
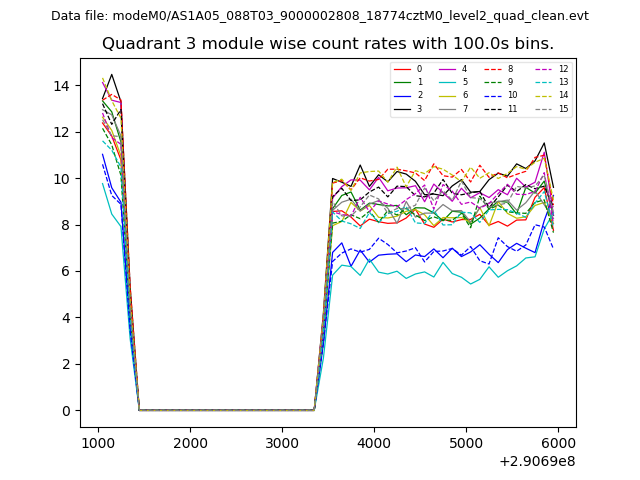
| Module-wise count rates for Quadrant C Data is divided into 100 sec bins |
 |
 |
| Module-wise count rates for Quadrant D Data is divided into 100 sec bins |
 |
 |
| Parameter | Plot |
|---|---|
| CZT HV Monitor | 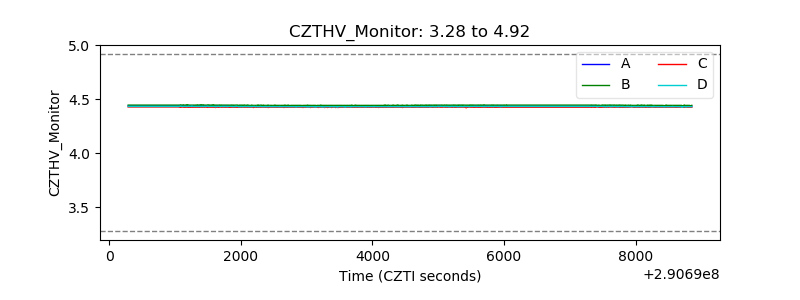 |
| D_VDD | 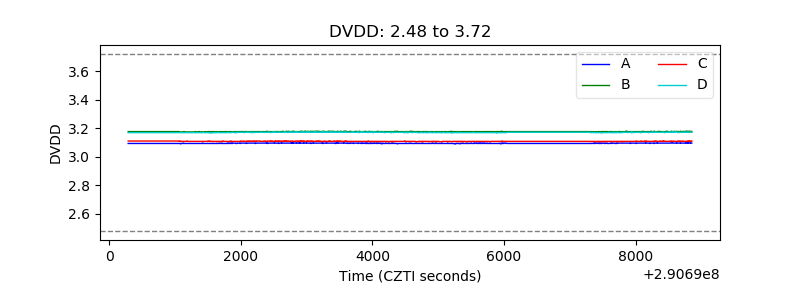 |
| Temperature 1 | 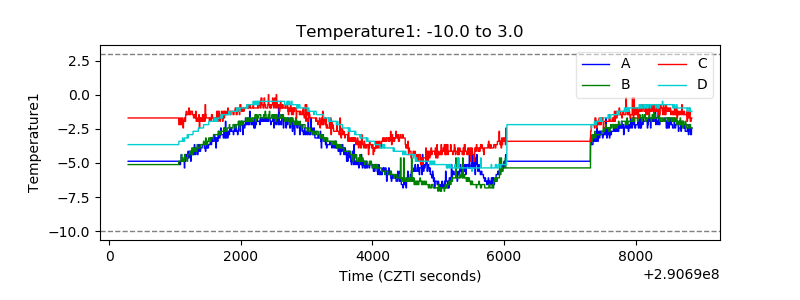 |
| Veto HV Monitor | 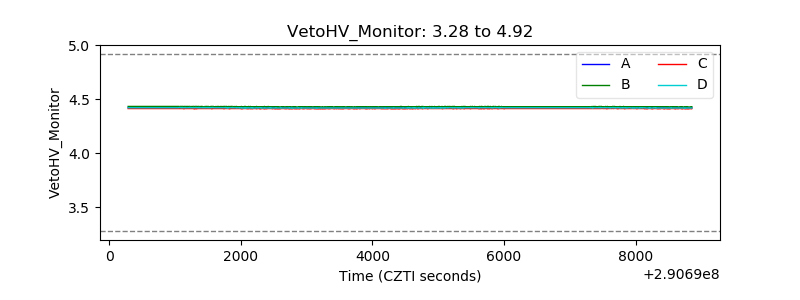 |
| Veto LLD | 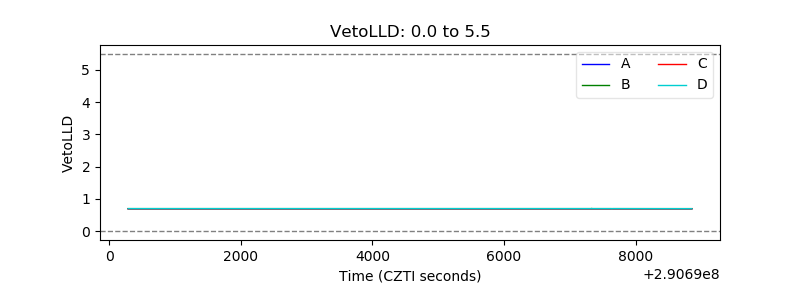 |
| Alpha Counter | 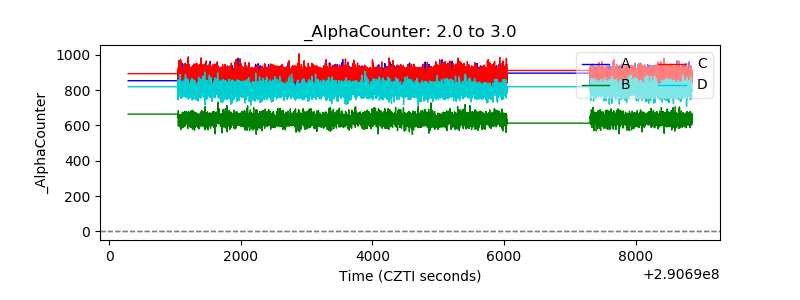 |
| _CPM_Rate | 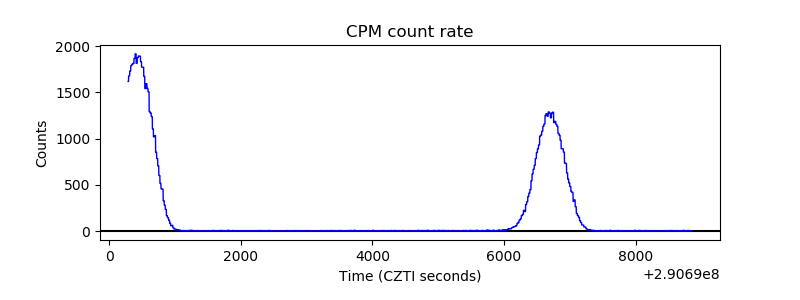 |
| CZT Counter |  |
| +2.5 Volts monitor |  |
| +5 Volts monitor |  |
| _ROLL_ROT | 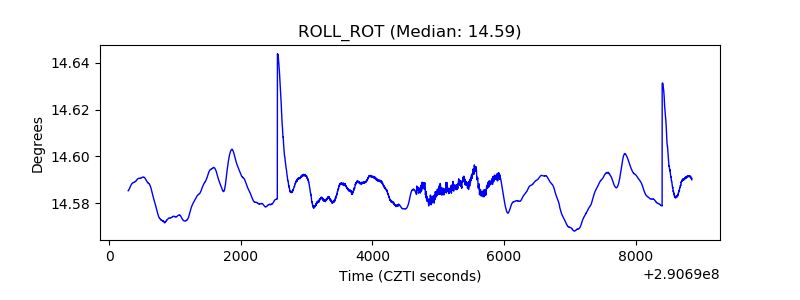 |
| _Roll_DEC | 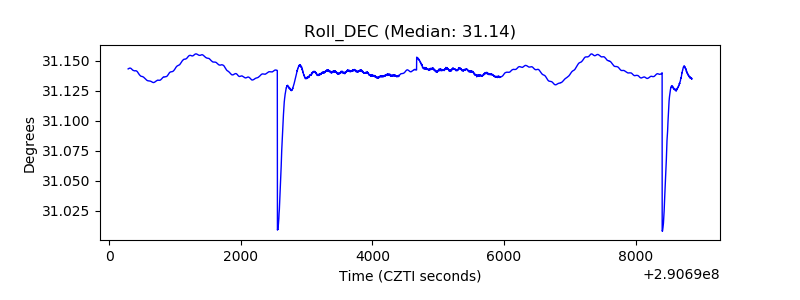 |
| _Roll_RA |  |
| Veto Counter | 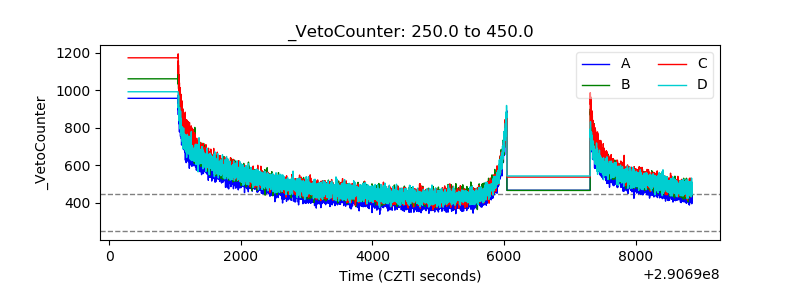 |