| Param | Original file | Final file |
|---|---|---|
| Filename | modeM0/AS1A05_088T03_9000002808_18775cztM0_level2.evt | modeM0/AS1A05_088T03_9000002808_18775cztM0_level2_quad_clean.evt |
| Size (bytes) | 524,220,480 | 70,784,640 |
| Size | 499.9 MB | 67.5 MB |
| Events in quadrant A | 4,627,938 | 417,576 |
| Events in quadrant B | 3,521,785 | 433,611 |
| Events in quadrant C | 3,313,236 | 421,886 |
| Events in quadrant D | 3,977,895 | 422,542 |
| Mode M0 | |||
|---|---|---|---|
| Quadrant | BADHDUFLAG | Total packets | Discarded packets |
| A | 0 | 17747 | 1 |
| B | 0 | 14332 | 1 |
| C | 0 | 13547 | 2 |
| D | 0 | 16101 | 1 |
| Mode SS | |||
|---|---|---|---|
| Quadrant | BADHDUFLAG | Total packets | Discarded packets |
| A | 0 | 130 | 0 |
| B | 0 | 130 | 0 |
| C | 0 | 130 | 0 |
| D | 0 | 130 | 0 |
| Mode M9 | |||
|---|---|---|---|
| Quadrant | BADHDUFLAG | Total packets | Discarded packets |
| A | 0 | 11 | 0 |
| B | 0 | 11 | 0 |
| C | 0 | 11 | 0 |
| D | 0 | 11 | 0 |
| Quadrant | Total seconds | Saturated seconds | Saturation percentage |
|---|---|---|---|
| A | 6416 | 311 | 4.847257% |
| B | 6416 | 130 | 2.026185% |
| C | 6415 | 136 | 2.120031% |
| D | 6415 | 203 | 3.164458% |
Noise dominated data is calculated using 1-second bins in cleaned event files. If a bin has >2000 counts, and if more than 50% of those come from <1% of pixels, then it is considered to be noise-dominated and hence unusable.
| Quadrant | # 1 sec bins | Bins with >0 counts | Bins with >2000 counts | High rate bins dominated by noise | Noise dominated (total time) | Noise dominated (detector-on time) | Marked lightcurve |
|---|---|---|---|---|---|---|---|
| A | 7511 | 6417 | 232 | 232 | 3.09% | 3.62% | 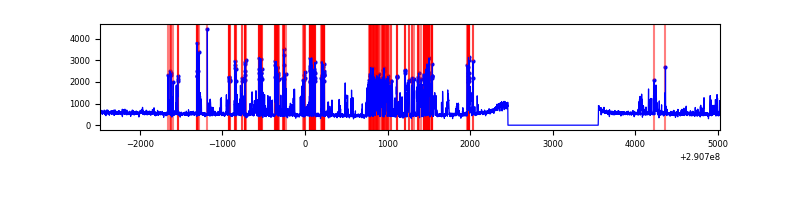 |
| B | 7511 | 6417 | 14 | 14 | 0.19% | 0.22% | 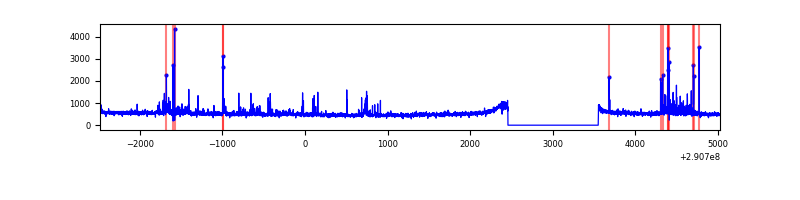 |
| C | 7510 | 6416 | 0 | 0 | 0.00% | 0.00% | 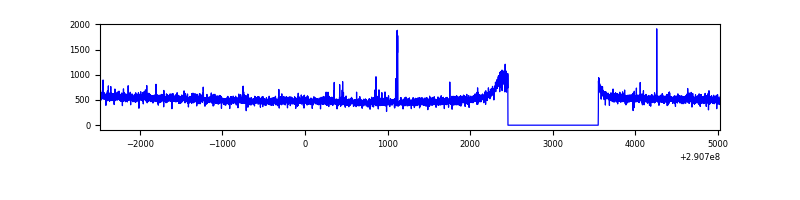 |
| D | 7510 | 6416 | 92 | 92 | 1.23% | 1.43% | 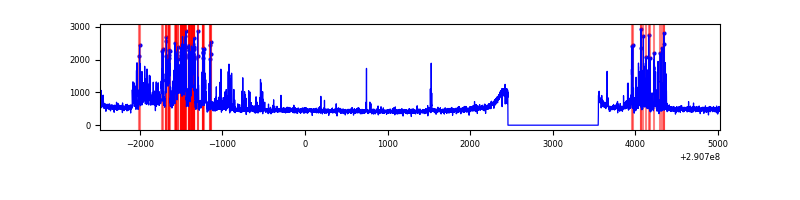 |
Top three noisy pixels from each quadrant. If the there are fewer than three noisy pixels in the level2.evt file, extra rows are filled as -1
| Pixel properties | Quadrant properties | ||||||
|---|---|---|---|---|---|---|---|
| Quadrant | DetID | PixID | Counts | Sigma | Mean | Median | Sigma |
| A | 6 | 16 | 1375725 | 8087.96 | 839 | 821 | 170.0 |
| A | 11 | 29 | 10561 | 57.3 | 839 | 821 | 170.0 |
| A | 13 | 254 | 10557 | 57.27 | 839 | 821 | 170.0 |
| B | 7 | 220 | 158779 | 997.25 | 835 | 817 | 158.4 |
| B | 0 | 230 | 28589 | 175.33 | 835 | 817 | 158.4 |
| B | 0 | 197 | 22643 | 137.79 | 835 | 817 | 158.4 |
| C | 14 | 238 | 126217 | 668.62 | 808 | 814 | 187.6 |
| C | 3 | 233 | 26262 | 135.68 | 808 | 814 | 187.6 |
| C | 0 | 207 | 7514 | 35.72 | 808 | 814 | 187.6 |
| D | 14 | 34 | 769933 | 3853.2 | 825 | 801 | 199.6 |
| D | 9 | 1 | 50010 | 246.52 | 825 | 801 | 199.6 |
| D | 2 | 234 | 36883 | 180.76 | 825 | 801 | 199.6 |
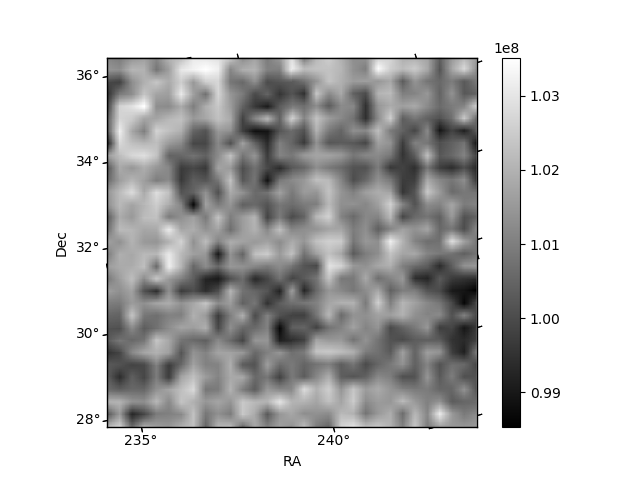
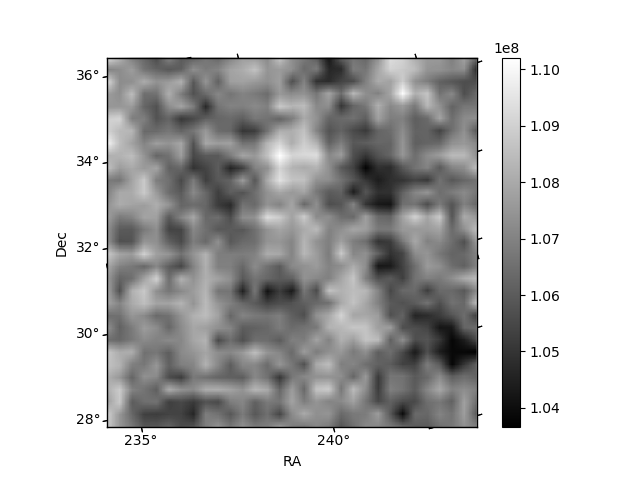
Histogram calculated using DETX and DETY for each event in the final _common_clean file
| Quadrant A |  |
 |
Quadrant B |
|---|---|---|---|
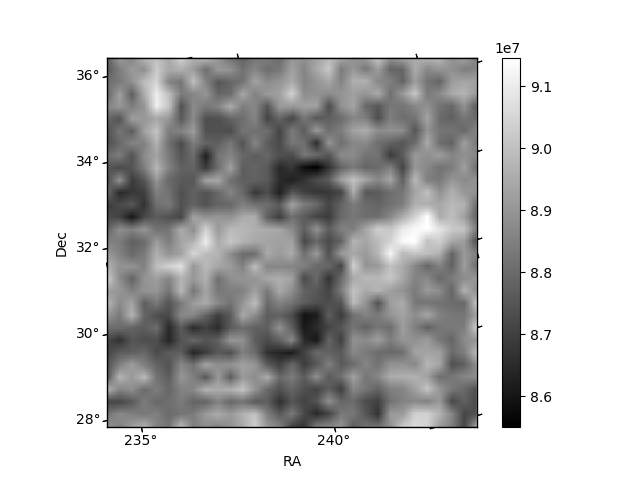
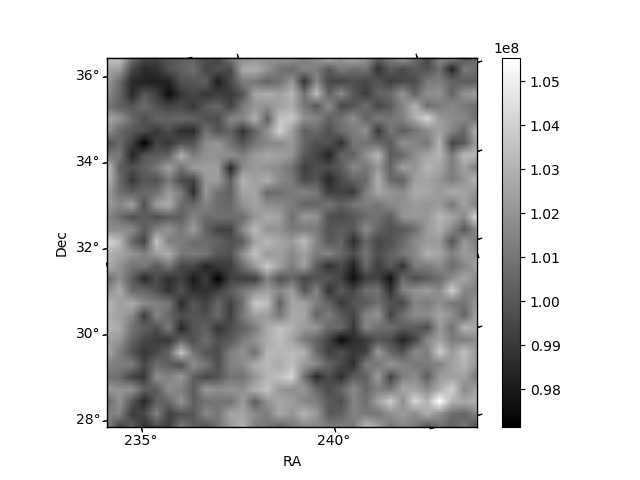
| Quadrant D |  |
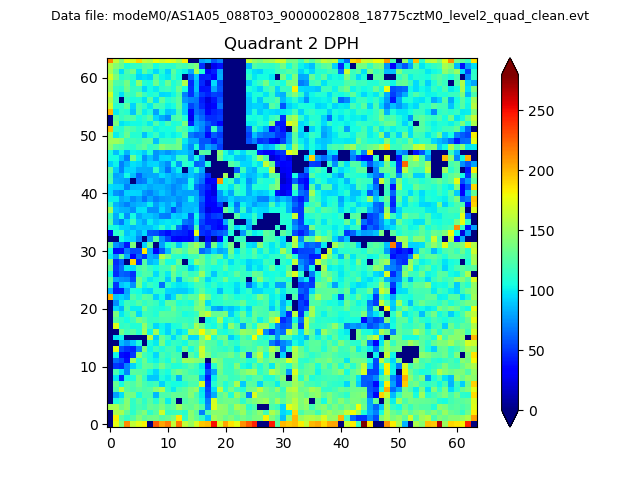 |
Quadrant C |
| Plot type | Count rate plots | Images |
|---|---|---|
| Comparison with Poisson distribution Blue bars denote a histogram of data divided into 1 sec bins. Red curve is a Poisson curve with rate = median count rate of data. |
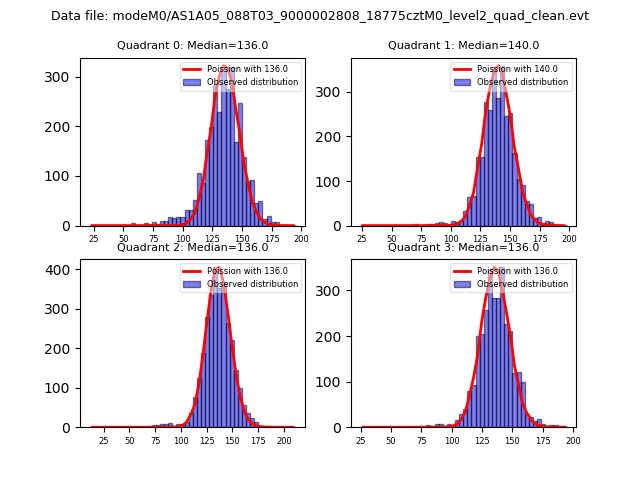 |
 |
| Quadrant-wise count rates Data is divided into 100 sec bins |
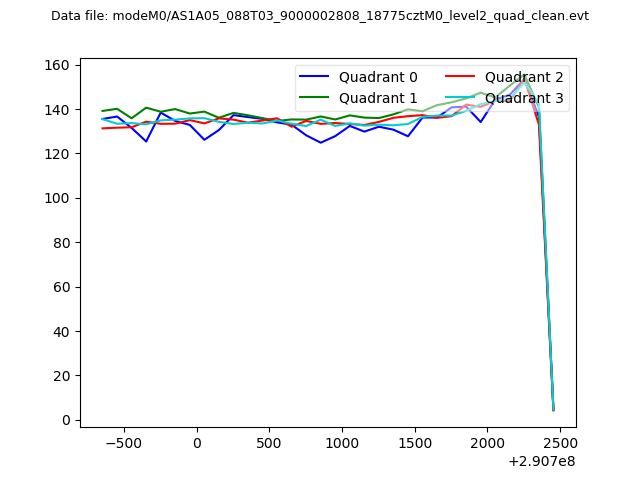 |
|
| Module-wise count rates for Quadrant A Data is divided into 100 sec bins |
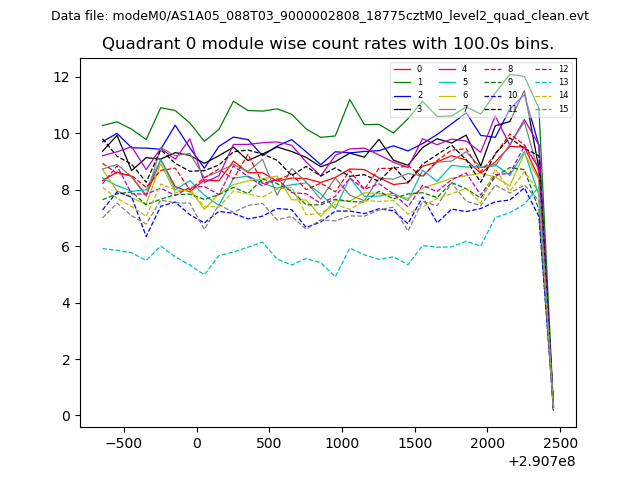 |
 |
| Module-wise count rates for Quadrant B Data is divided into 100 sec bins |
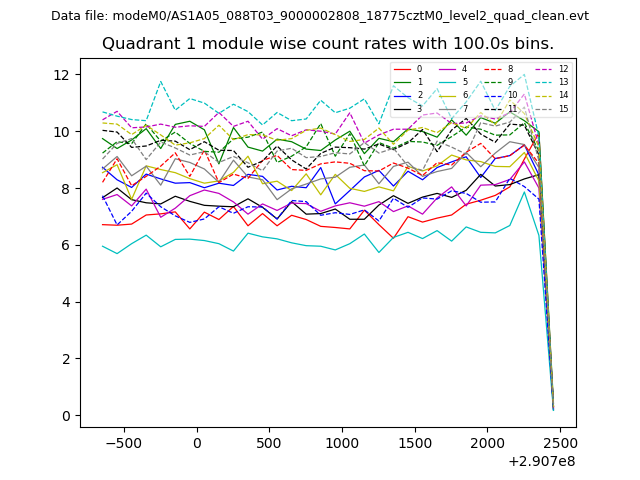 |
 |
| Module-wise count rates for Quadrant C Data is divided into 100 sec bins |
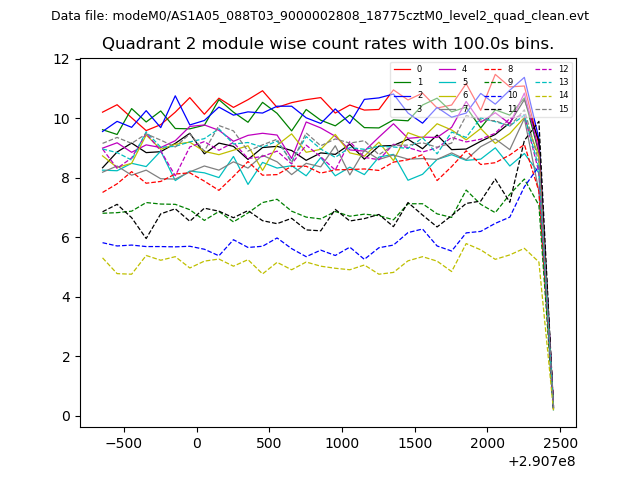 |
 |
| Module-wise count rates for Quadrant D Data is divided into 100 sec bins |
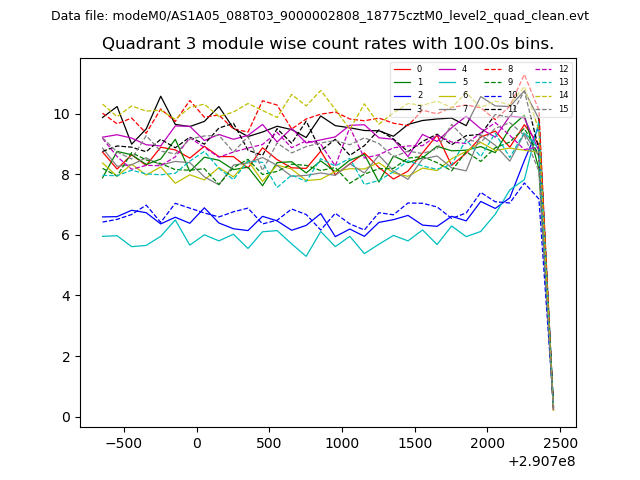 |
 |
| Parameter | Plot |
|---|---|
| CZT HV Monitor | 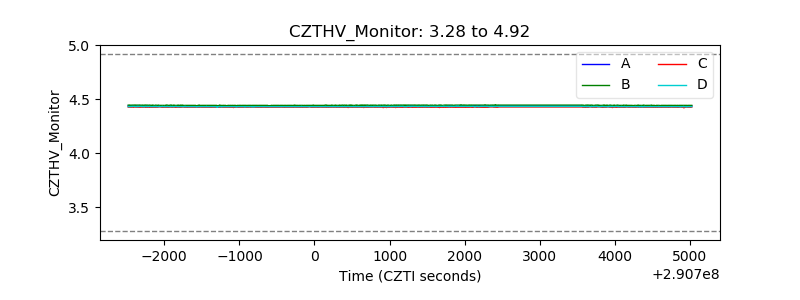 |
| D_VDD |  |
| Temperature 1 | 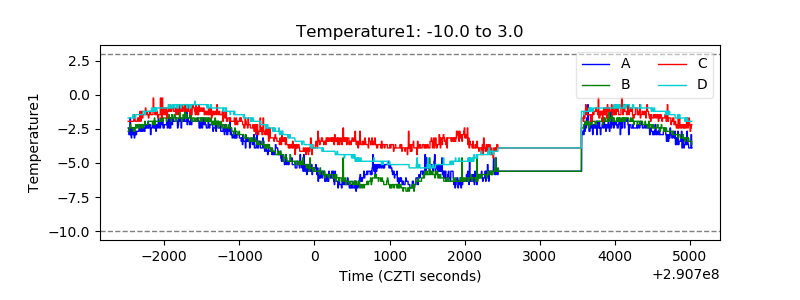 |
| Veto HV Monitor | 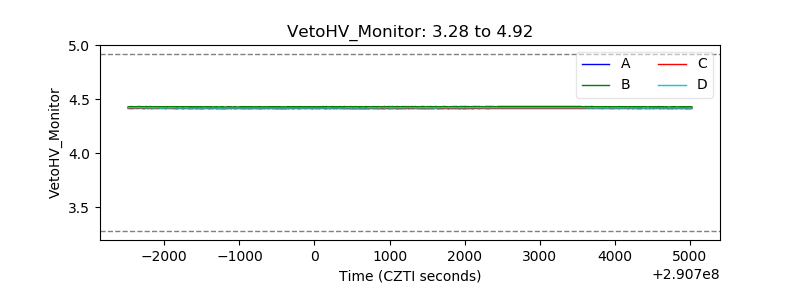 |
| Veto LLD | 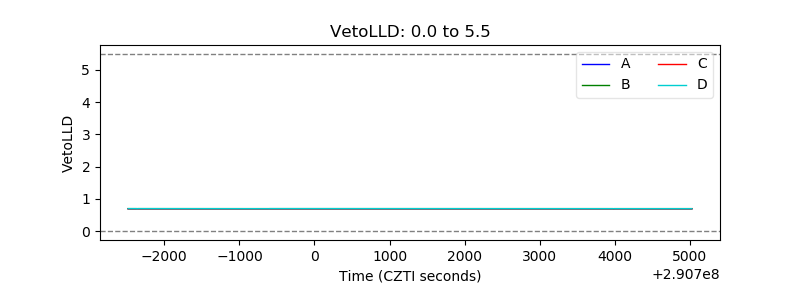 |
| Alpha Counter | 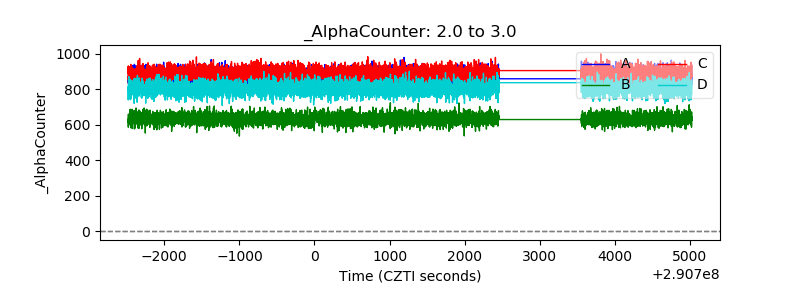 |
| _CPM_Rate | 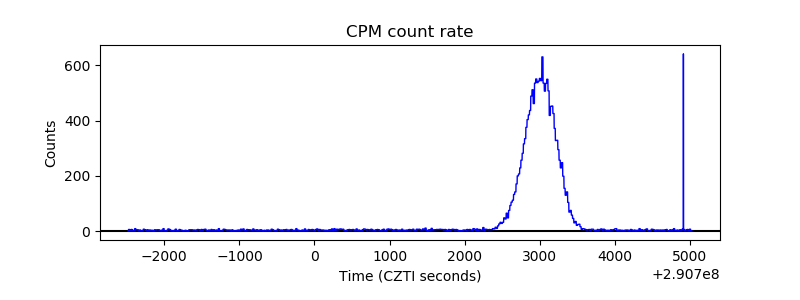 |
| CZT Counter | 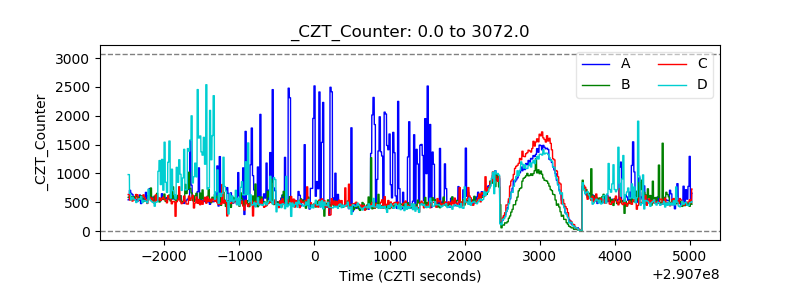 |
| +2.5 Volts monitor |  |
| +5 Volts monitor |  |
| _ROLL_ROT | 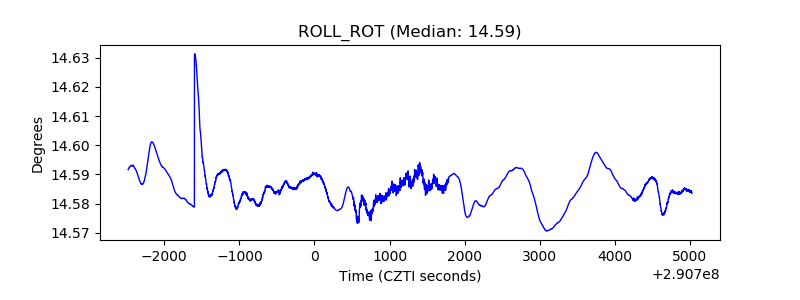 |
| _Roll_DEC | 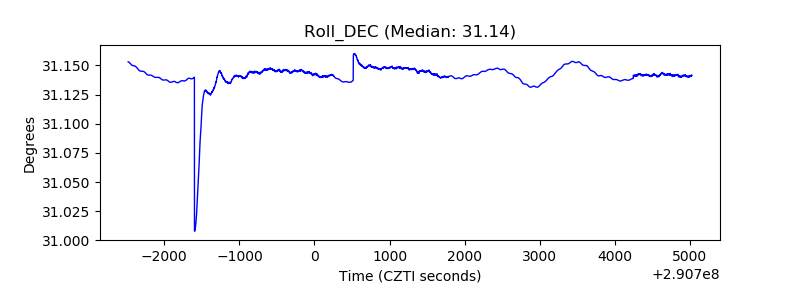 |
| _Roll_RA | 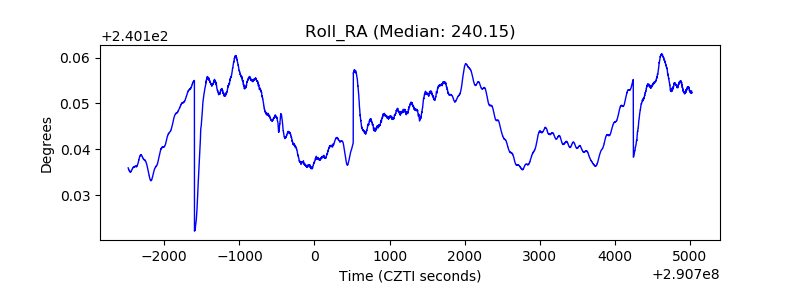 |
| Veto Counter | 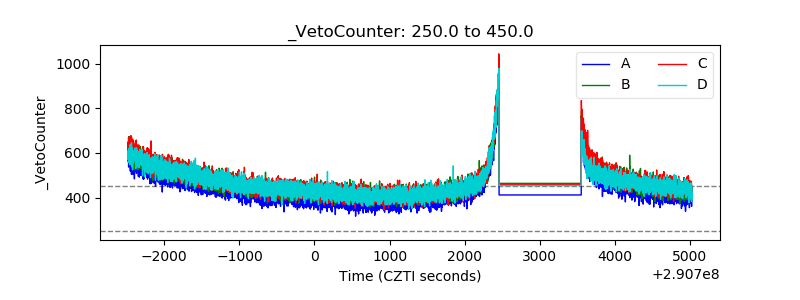 |