| Param | Original file | Final file |
|---|---|---|
| Filename | modeM0/AS1A05_088T03_9000002808_18776cztM0_level2.evt | modeM0/AS1A05_088T03_9000002808_18776cztM0_level2_quad_clean.evt |
| Size (bytes) | 507,631,680 | 81,322,560 |
| Size | 484.1 MB | 77.6 MB |
| Events in quadrant A | 4,457,307 | 490,571 |
| Events in quadrant B | 3,481,623 | 513,976 |
| Events in quadrant C | 3,236,002 | 500,835 |
| Events in quadrant D | 3,749,528 | 495,839 |
| Mode M0 | |||
|---|---|---|---|
| Quadrant | BADHDUFLAG | Total packets | Discarded packets |
| A | 0 | 17443 | 1 |
| B | 0 | 14513 | 1 |
| C | 0 | 13614 | 1 |
| D | 0 | 15555 | 1 |
| Mode SS | |||
|---|---|---|---|
| Quadrant | BADHDUFLAG | Total packets | Discarded packets |
| A | 0 | 132 | 0 |
| B | 0 | 132 | 0 |
| C | 0 | 132 | 0 |
| D | 0 | 132 | 0 |
| Mode M9 | |||
|---|---|---|---|
| Quadrant | BADHDUFLAG | Total packets | Discarded packets |
| A | 0 | 9 | 0 |
| B | 0 | 9 | 0 |
| C | 0 | 9 | 0 |
| D | 0 | 9 | 0 |
| Quadrant | Total seconds | Saturated seconds | Saturation percentage |
|---|---|---|---|
| A | 6622 | 390 | 5.889459% |
| B | 6623 | 126 | 1.902461% |
| C | 6623 | 117 | 1.766571% |
| D | 6623 | 193 | 2.914087% |
Noise dominated data is calculated using 1-second bins in cleaned event files. If a bin has >2000 counts, and if more than 50% of those come from <1% of pixels, then it is considered to be noise-dominated and hence unusable.
| Quadrant | # 1 sec bins | Bins with >0 counts | Bins with >2000 counts | High rate bins dominated by noise | Noise dominated (total time) | Noise dominated (detector-on time) | Marked lightcurve |
|---|---|---|---|---|---|---|---|
| A | 7437 | 6623 | 236 | 236 | 3.17% | 3.56% | 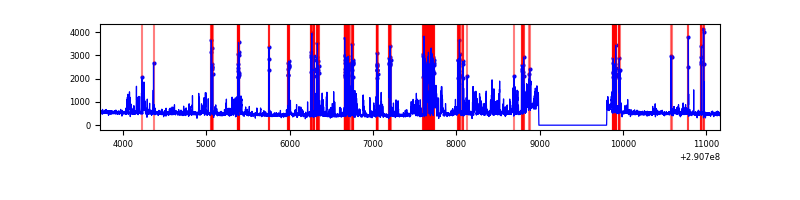 |
| B | 7438 | 6624 | 15 | 15 | 0.20% | 0.23% | 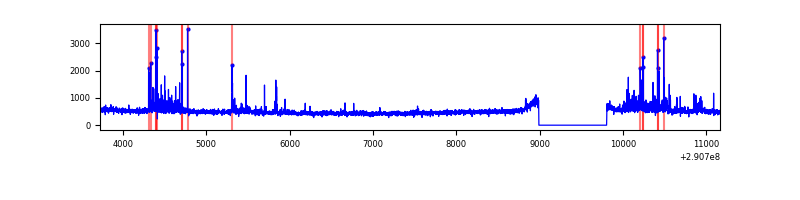 |
| C | 7438 | 6624 | 0 | 0 | 0.00% | 0.00% | 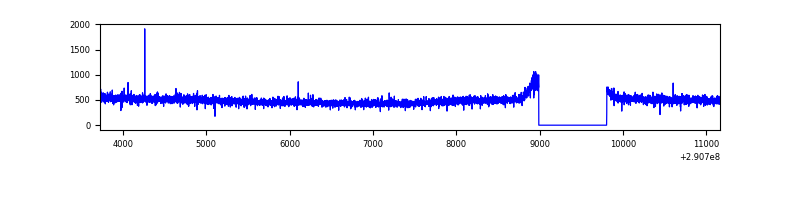 |
| D | 7438 | 6624 | 73 | 73 | 0.98% | 1.10% | 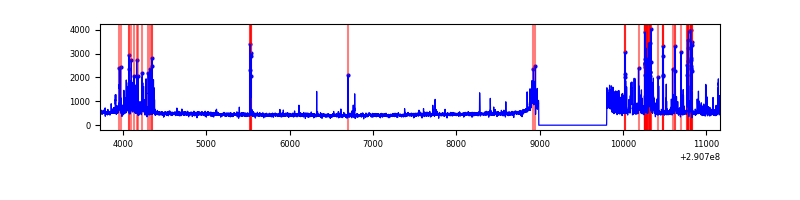 |
Top three noisy pixels from each quadrant. If the there are fewer than three noisy pixels in the level2.evt file, extra rows are filled as -1
| Pixel properties | Quadrant properties | ||||||
|---|---|---|---|---|---|---|---|
| Quadrant | DetID | PixID | Counts | Sigma | Mean | Median | Sigma |
| A | 6 | 16 | 1296485 | 7821.15 | 815 | 798 | 165.7 |
| A | 11 | 29 | 11884 | 66.92 | 815 | 798 | 165.7 |
| A | 13 | 254 | 10514 | 58.65 | 815 | 798 | 165.7 |
| B | 7 | 220 | 176327 | 1119.46 | 822 | 802 | 156.8 |
| B | 0 | 197 | 32452 | 201.86 | 822 | 802 | 156.8 |
| B | 0 | 229 | 21138 | 129.7 | 822 | 802 | 156.8 |
| C | 14 | 238 | 125732 | 669.27 | 796 | 800 | 186.7 |
| C | 0 | 207 | 5888 | 27.26 | 796 | 800 | 186.7 |
| C | 13 | 61 | 5653 | 26.0 | 796 | 800 | 186.7 |
| D | 14 | 34 | 376021 | 1908.9 | 807 | 782 | 196.6 |
| D | 1 | 52 | 190389 | 964.56 | 807 | 782 | 196.6 |
| D | 2 | 234 | 39890 | 198.95 | 807 | 782 | 196.6 |
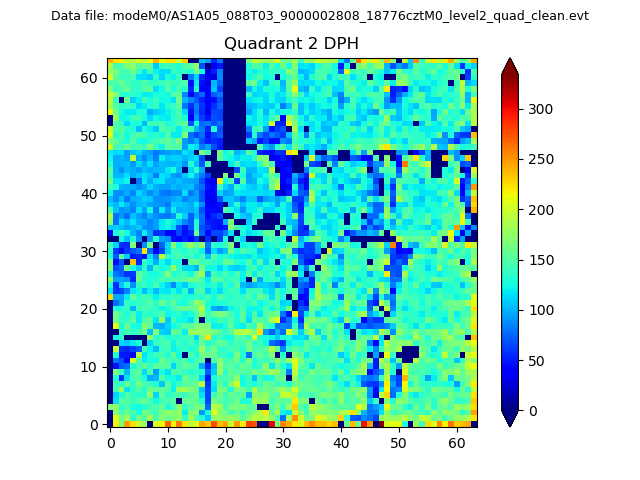
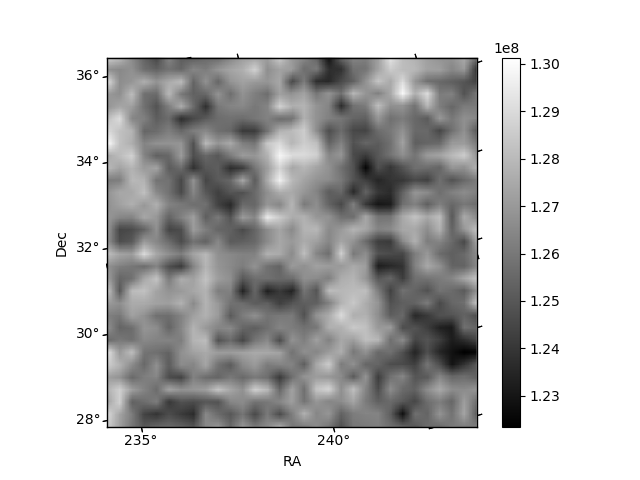
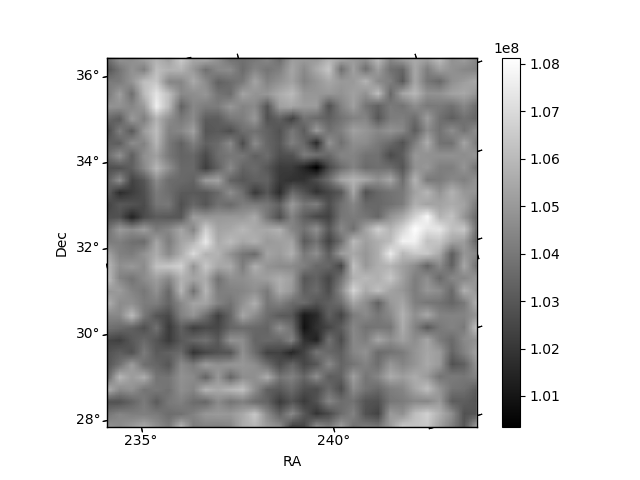
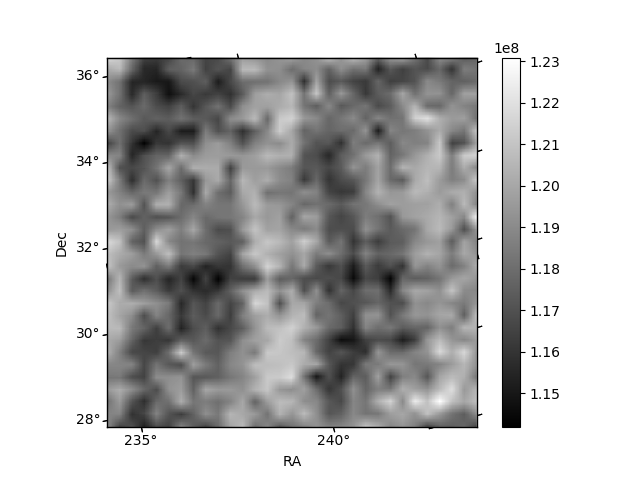
Histogram calculated using DETX and DETY for each event in the final _common_clean file
| Quadrant A | 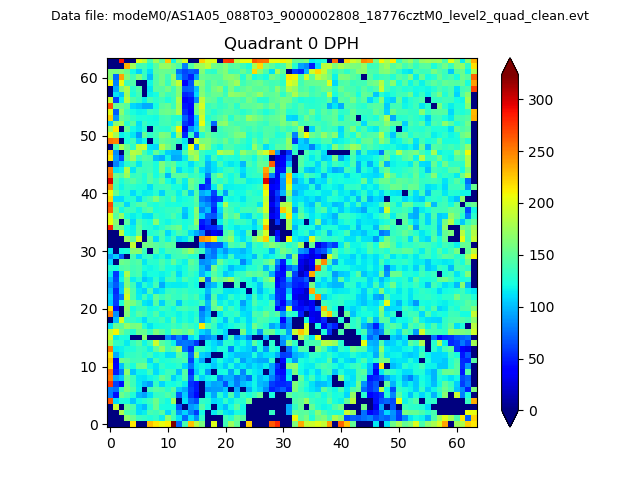 |
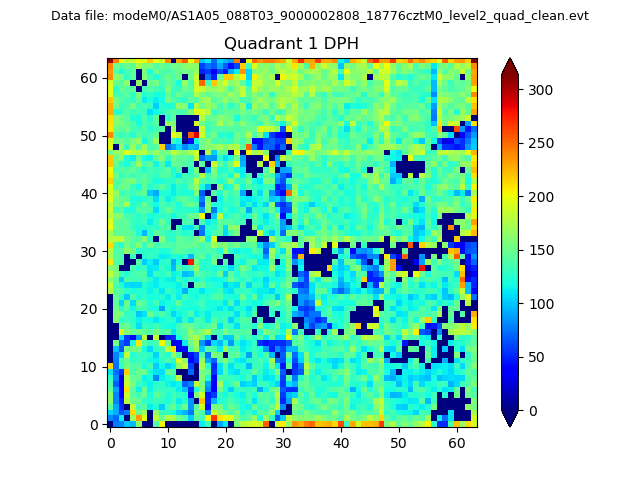 |
Quadrant B |
|---|---|---|---|
| Quadrant D | 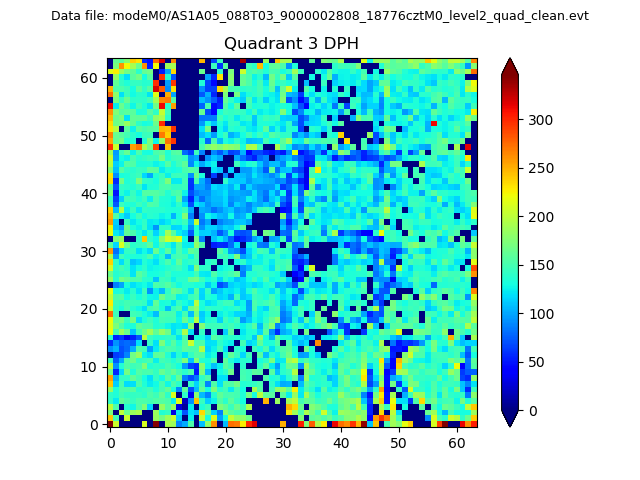 |
 |
Quadrant C |
| Plot type | Count rate plots | Images |
|---|---|---|
| Comparison with Poisson distribution Blue bars denote a histogram of data divided into 1 sec bins. Red curve is a Poisson curve with rate = median count rate of data. |
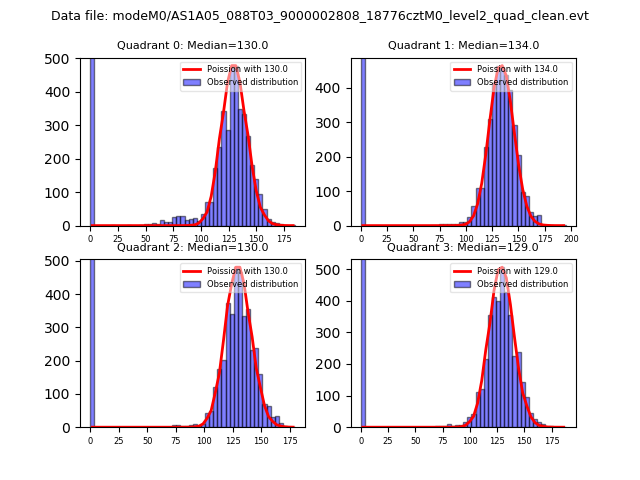 |
 |
| Quadrant-wise count rates Data is divided into 100 sec bins |
 |
|
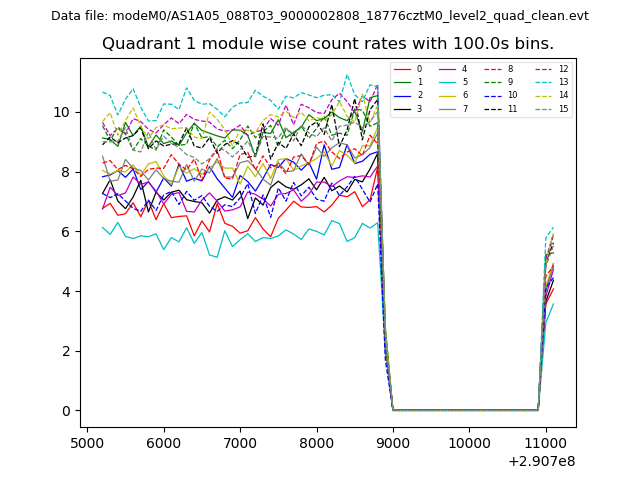
| Module-wise count rates for Quadrant A Data is divided into 100 sec bins |
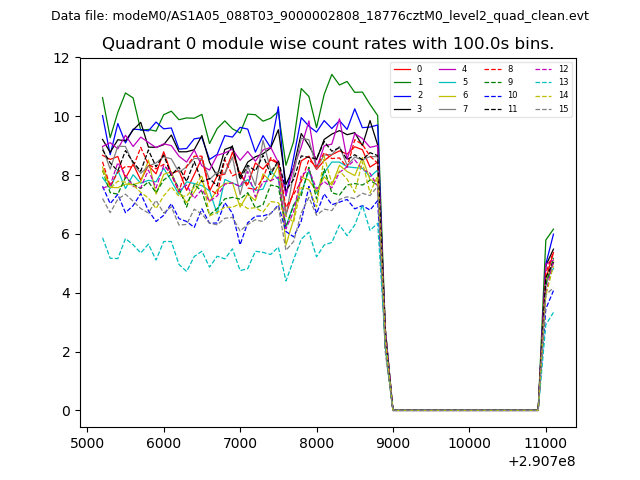 |
 |
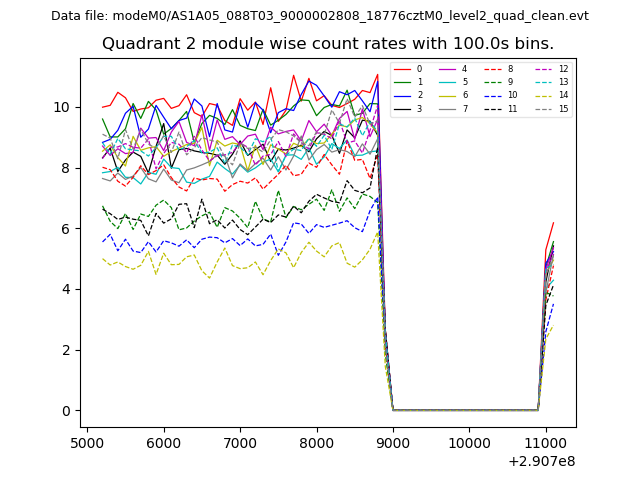
| Module-wise count rates for Quadrant B Data is divided into 100 sec bins |
 |
 |
| Module-wise count rates for Quadrant C Data is divided into 100 sec bins |
 |
 |
| Module-wise count rates for Quadrant D Data is divided into 100 sec bins |
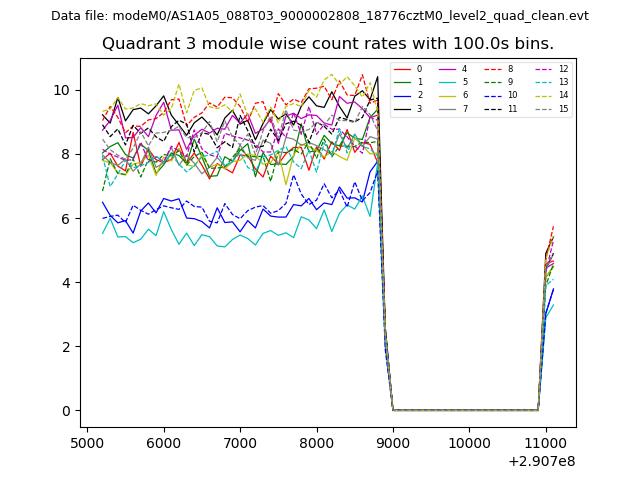 |
 |
| Parameter | Plot |
|---|---|
| CZT HV Monitor | 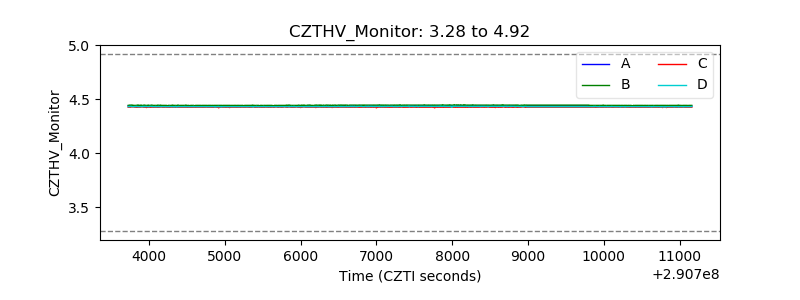 |
| D_VDD | 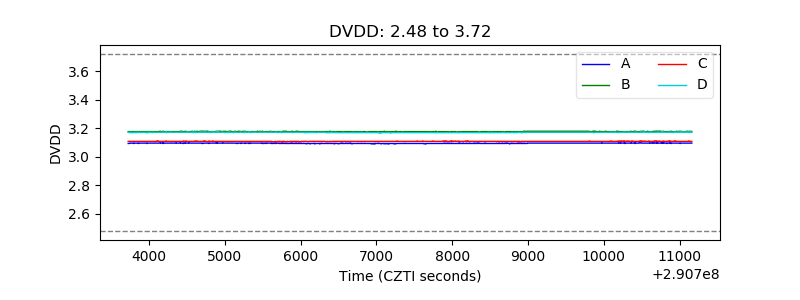 |
| Temperature 1 | 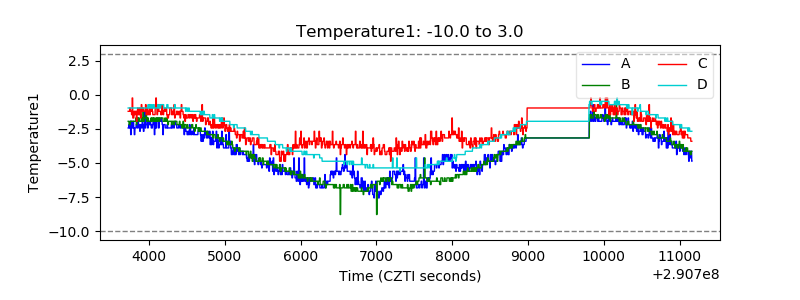 |
| Veto HV Monitor | 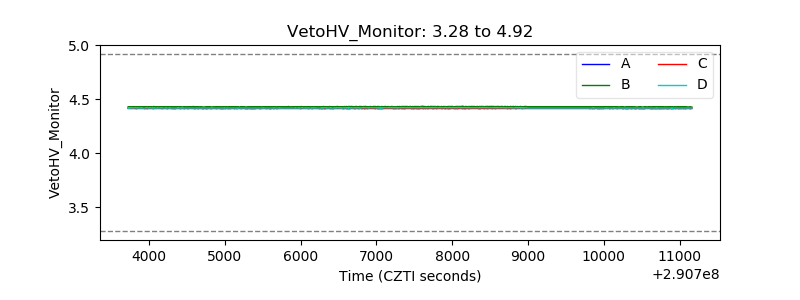 |
| Veto LLD | 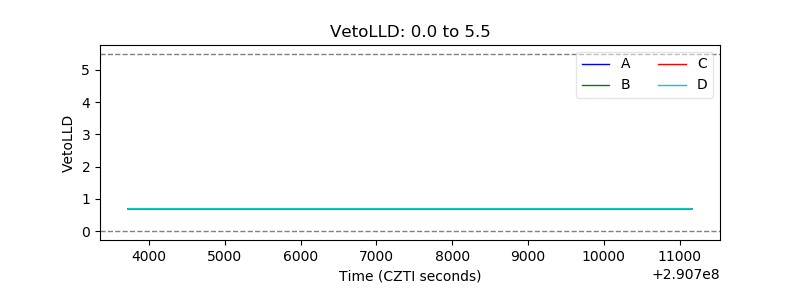 |
| Alpha Counter |  |
| _CPM_Rate | 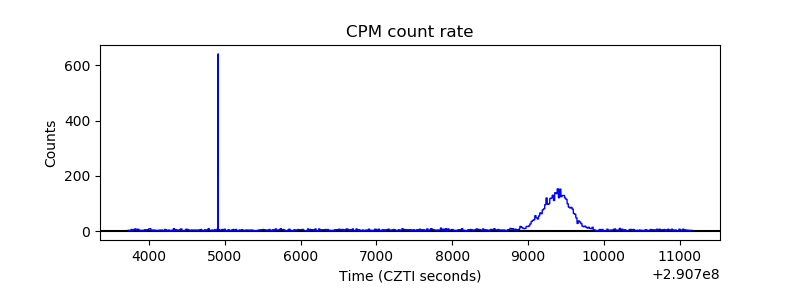 |
| CZT Counter | 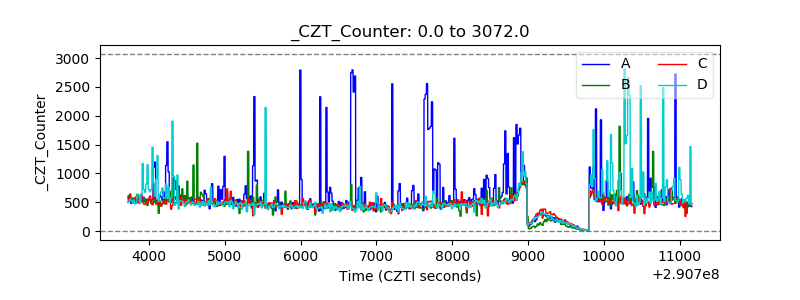 |
| +2.5 Volts monitor |  |
| +5 Volts monitor |  |
| _ROLL_ROT | 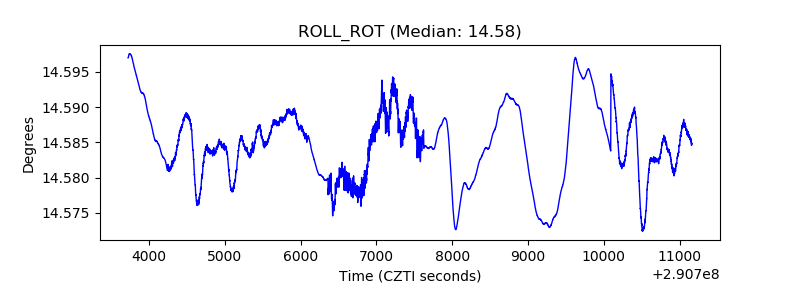 |
| _Roll_DEC | 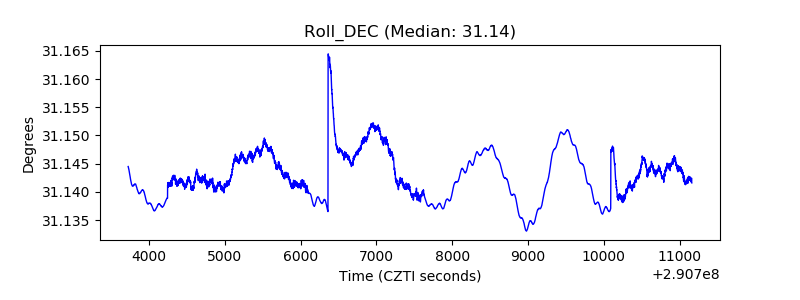 |
| _Roll_RA | 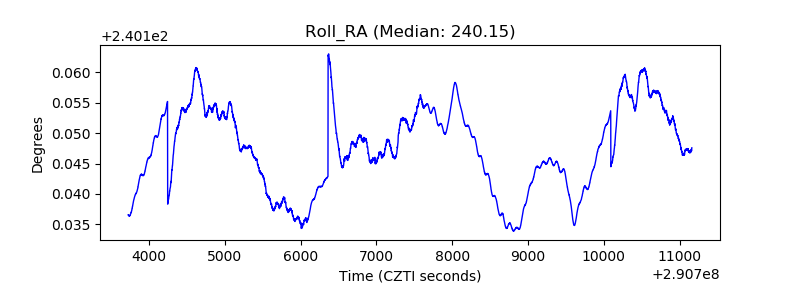 |
| Veto Counter | 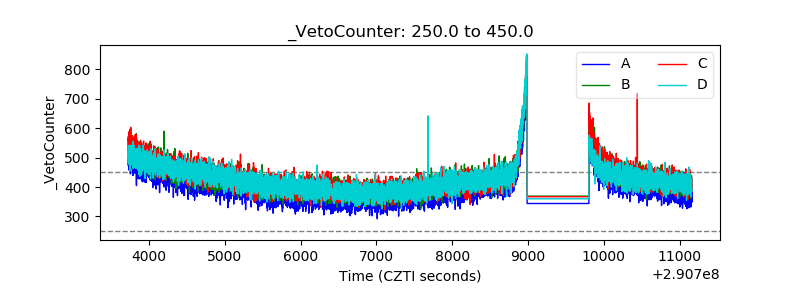 |