| Param | Original file | Final file |
|---|---|---|
| Filename | modeM0/AS1A05_088T03_9000002808_18778cztM0_level2.evt | modeM0/AS1A05_088T03_9000002808_18778cztM0_level2_quad_clean.evt |
| Size (bytes) | 419,241,600 | 74,246,400 |
| Size | 399.8 MB | 70.8 MB |
| Events in quadrant A | 3,051,646 | 457,423 |
| Events in quadrant B | 3,122,682 | 464,173 |
| Events in quadrant C | 2,913,550 | 455,503 |
| Events in quadrant D | 3,196,491 | 447,471 |
| Mode M0 | |||
|---|---|---|---|
| Quadrant | BADHDUFLAG | Total packets | Discarded packets |
| A | 0 | 13118 | 1 |
| B | 0 | 13355 | 1 |
| C | 0 | 12637 | 1 |
| D | 0 | 13558 | 1 |
| Mode SS | |||
|---|---|---|---|
| Quadrant | BADHDUFLAG | Total packets | Discarded packets |
| A | 0 | 122 | 0 |
| B | 0 | 122 | 0 |
| C | 0 | 122 | 0 |
| D | 0 | 122 | 0 |
| Mode M9 | |||
|---|---|---|---|
| Quadrant | BADHDUFLAG | Total packets | Discarded packets |
| A | 0 | 3 | 0 |
| B | 0 | 3 | 0 |
| C | 0 | 3 | 0 |
| D | 0 | 3 | 0 |
| Quadrant | Total seconds | Saturated seconds | Saturation percentage |
|---|---|---|---|
| A | 6070 | 72 | 1.186161% |
| B | 6070 | 102 | 1.680395% |
| C | 6069 | 119 | 1.960784% |
| D | 6069 | 42 | 0.692042% |
Noise dominated data is calculated using 1-second bins in cleaned event files. If a bin has >2000 counts, and if more than 50% of those come from <1% of pixels, then it is considered to be noise-dominated and hence unusable.
| Quadrant | # 1 sec bins | Bins with >0 counts | Bins with >2000 counts | High rate bins dominated by noise | Noise dominated (total time) | Noise dominated (detector-on time) | Marked lightcurve |
|---|---|---|---|---|---|---|---|
| A | 6365 | 6071 | 21 | 21 | 0.33% | 0.35% | 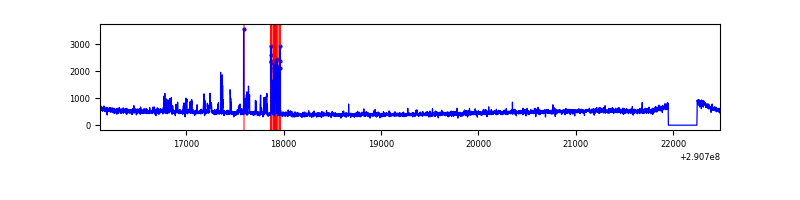 |
| B | 6365 | 6071 | 9 | 9 | 0.14% | 0.15% | 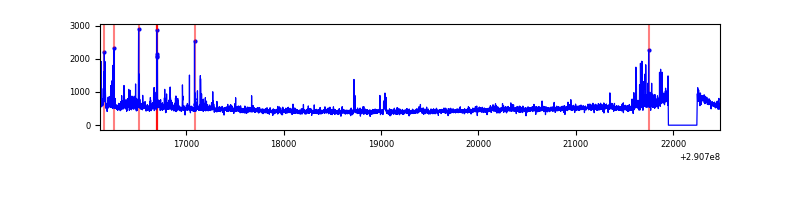 |
| C | 6364 | 6070 | 5 | 5 | 0.08% | 0.08% | 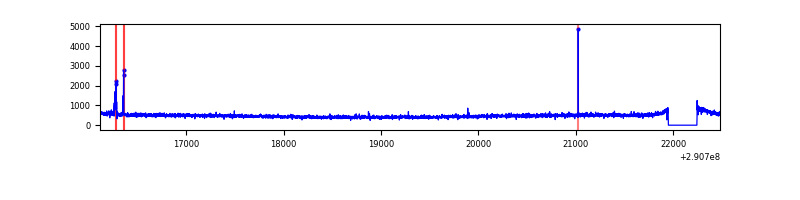 |
| D | 6364 | 6070 | 16 | 16 | 0.25% | 0.26% | 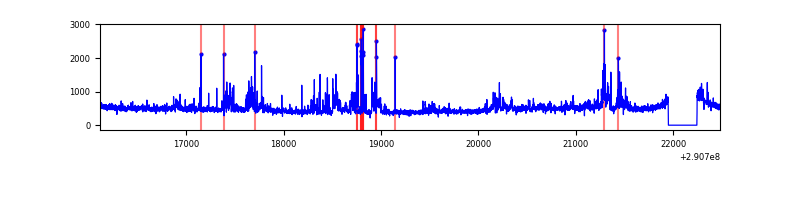 |
Top three noisy pixels from each quadrant. If the there are fewer than three noisy pixels in the level2.evt file, extra rows are filled as -1
| Pixel properties | Quadrant properties | ||||||
|---|---|---|---|---|---|---|---|
| Quadrant | DetID | PixID | Counts | Sigma | Mean | Median | Sigma |
| A | 6 | 16 | 192724 | 1270.23 | 739 | 725 | 151.2 |
| A | 13 | 254 | 10835 | 66.89 | 739 | 725 | 151.2 |
| A | 0 | 226 | 6555 | 38.57 | 739 | 725 | 151.2 |
| B | 7 | 220 | 154234 | 1081.77 | 734 | 716 | 141.9 |
| B | 0 | 229 | 58978 | 410.55 | 734 | 716 | 141.9 |
| B | 0 | 197 | 18780 | 127.29 | 734 | 716 | 141.9 |
| C | 14 | 238 | 111459 | 668.85 | 706 | 711 | 165.6 |
| C | 0 | 207 | 33298 | 196.81 | 706 | 711 | 165.6 |
| C | 5 | 112 | 10530 | 59.3 | 706 | 711 | 165.6 |
| D | 1 | 52 | 390963 | 2218.54 | 717 | 696 | 175.9 |
| D | 14 | 34 | 40773 | 227.82 | 717 | 696 | 175.9 |
| D | 2 | 234 | 31990 | 177.9 | 717 | 696 | 175.9 |
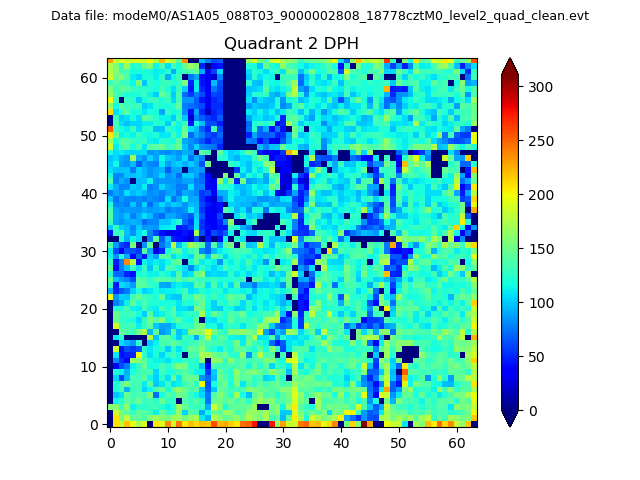
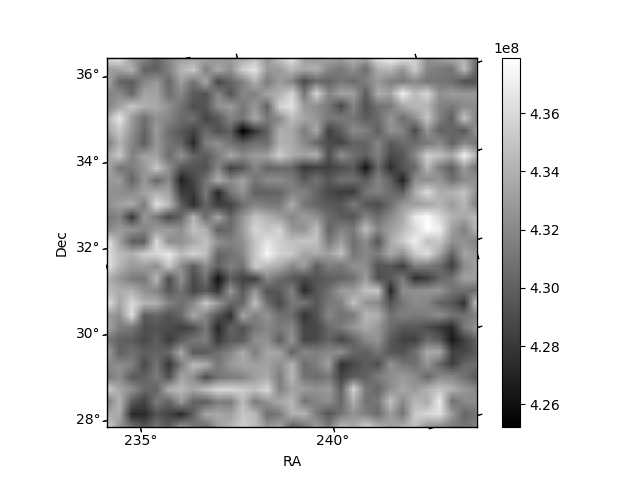
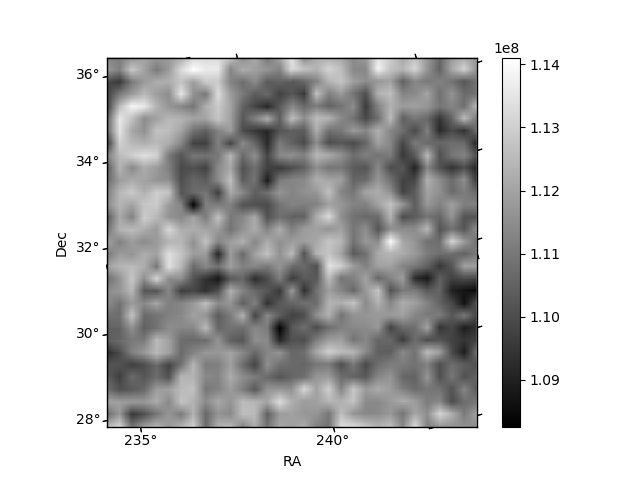
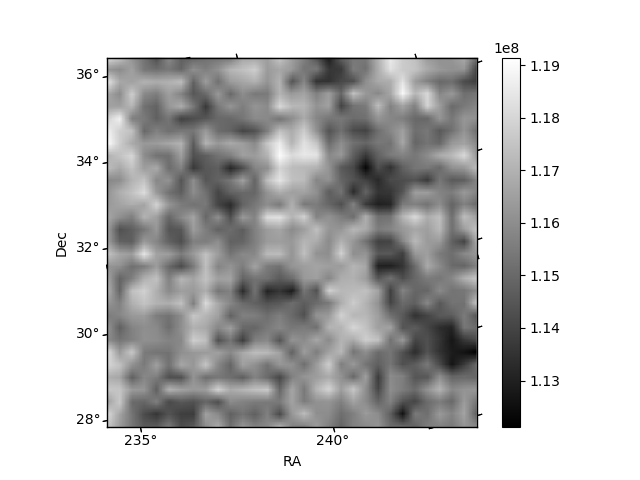
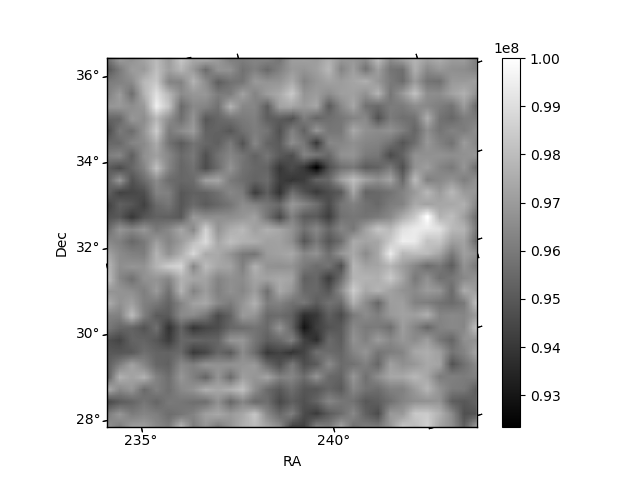
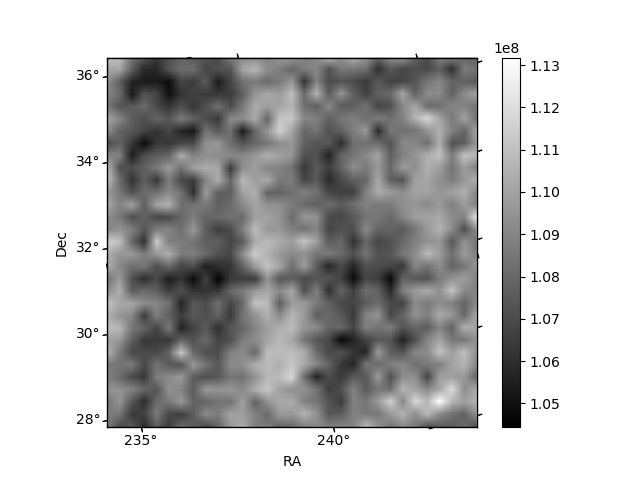
Histogram calculated using DETX and DETY for each event in the final _common_clean file
| Quadrant A | 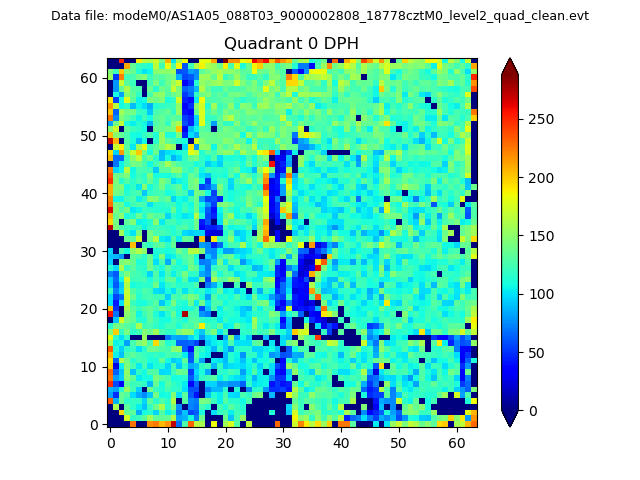 |
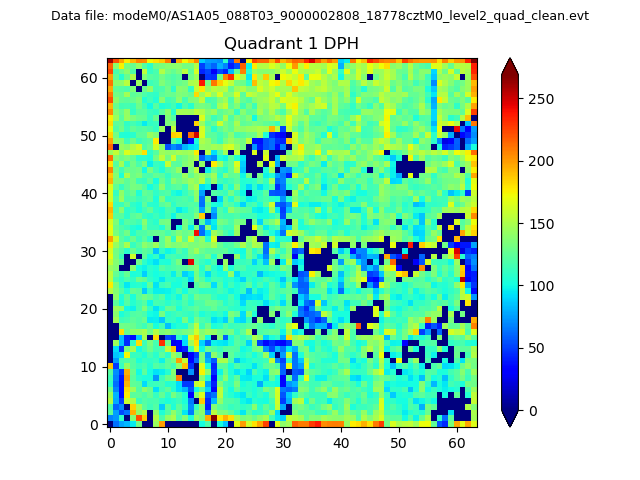 |
Quadrant B |
|---|---|---|---|
| Quadrant D | 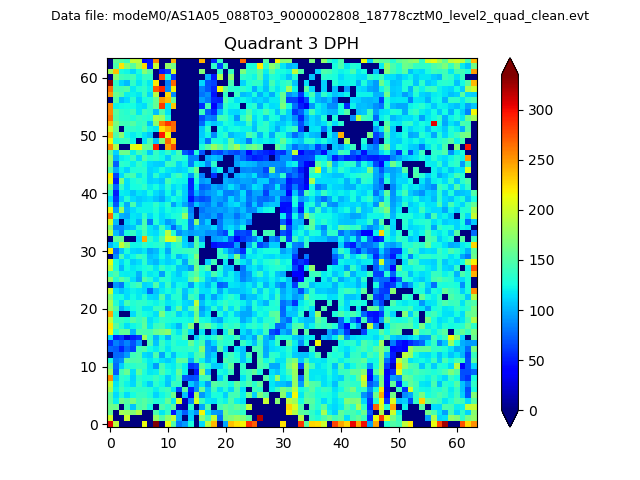 |
 |
Quadrant C |
| Plot type | Count rate plots | Images |
|---|---|---|
| Comparison with Poisson distribution Blue bars denote a histogram of data divided into 1 sec bins. Red curve is a Poisson curve with rate = median count rate of data. |
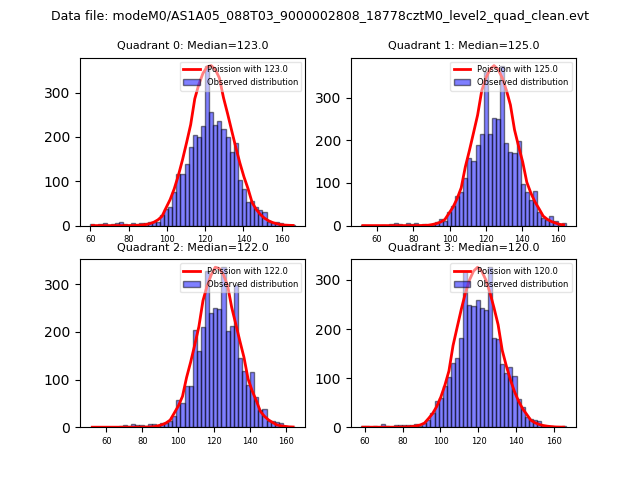 |
 |
| Quadrant-wise count rates Data is divided into 100 sec bins |
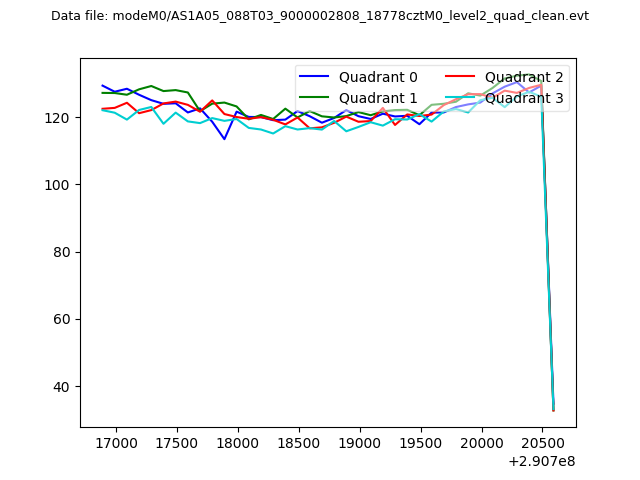 |
|
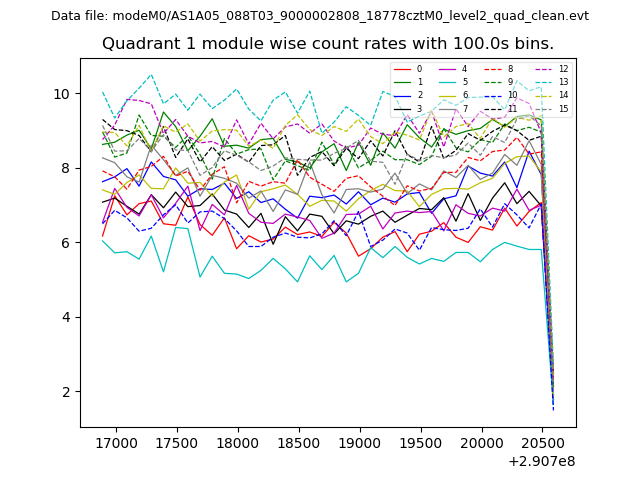
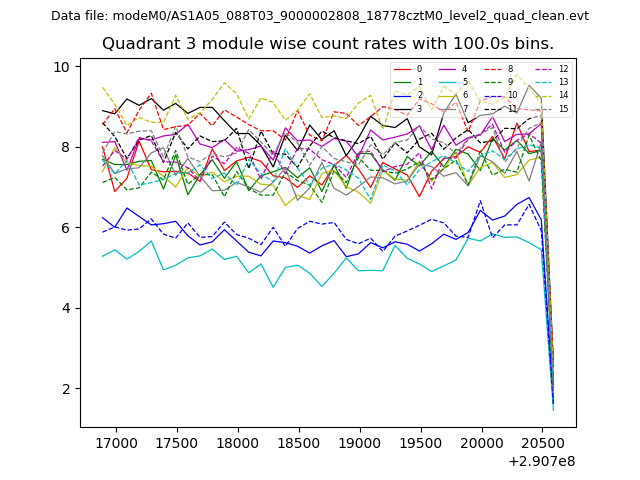
| Module-wise count rates for Quadrant A Data is divided into 100 sec bins |
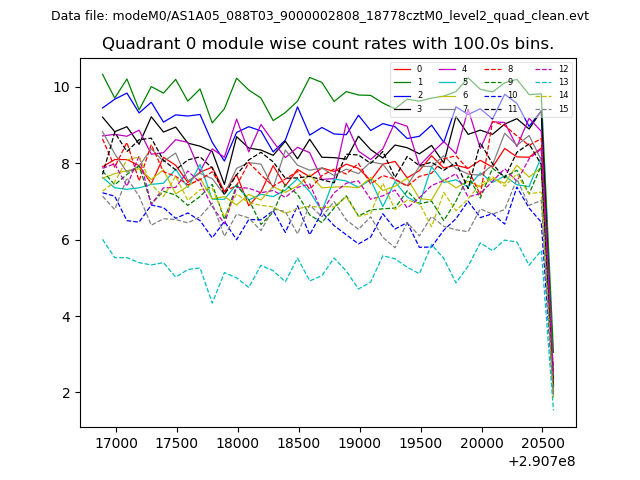 |
 |
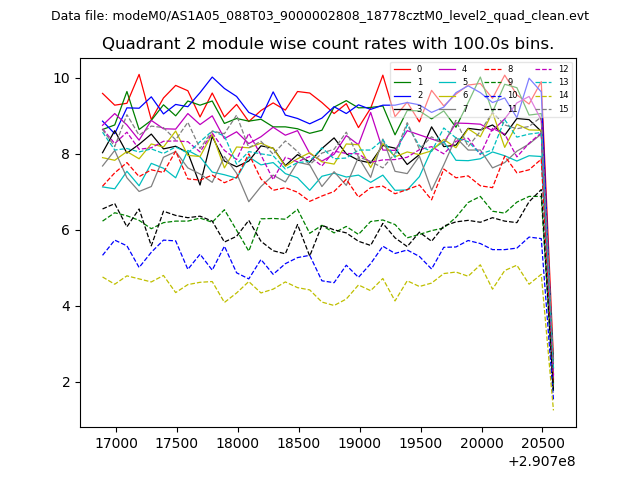
| Module-wise count rates for Quadrant B Data is divided into 100 sec bins |
 |
 |
| Module-wise count rates for Quadrant C Data is divided into 100 sec bins |
 |
 |
| Module-wise count rates for Quadrant D Data is divided into 100 sec bins |
 |
 |
| Parameter | Plot |
|---|---|
| CZT HV Monitor | 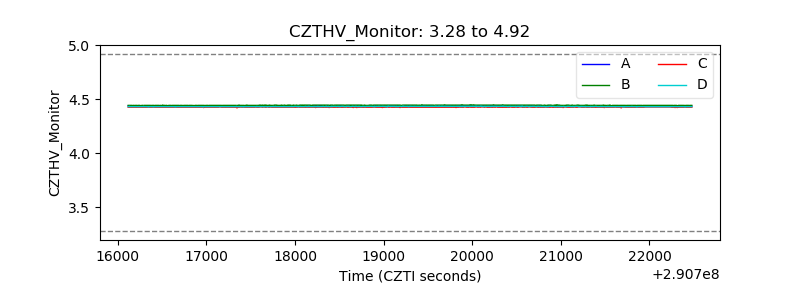 |
| D_VDD | 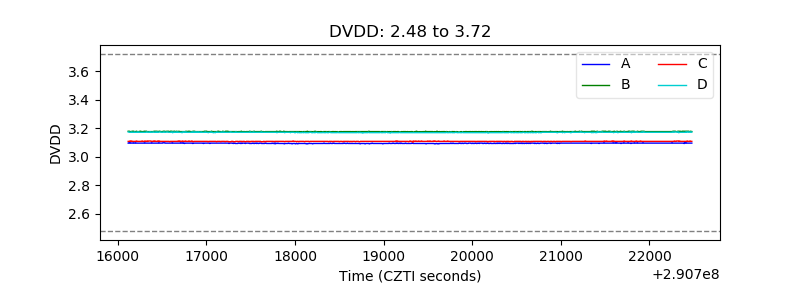 |
| Temperature 1 | 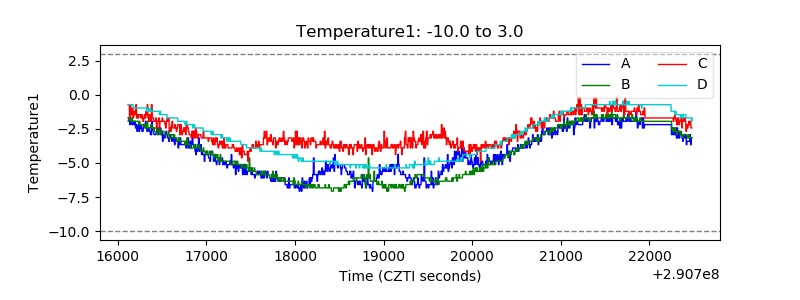 |
| Veto HV Monitor | 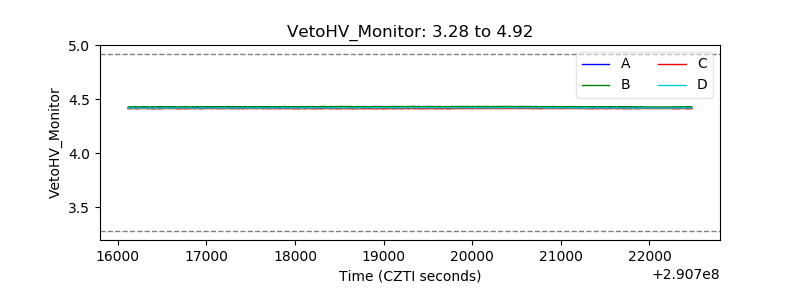 |
| Veto LLD | 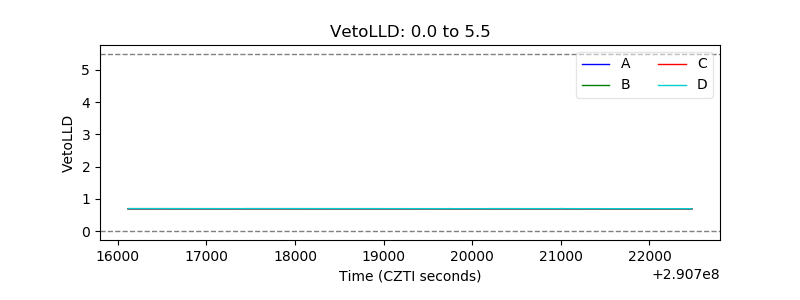 |
| Alpha Counter | 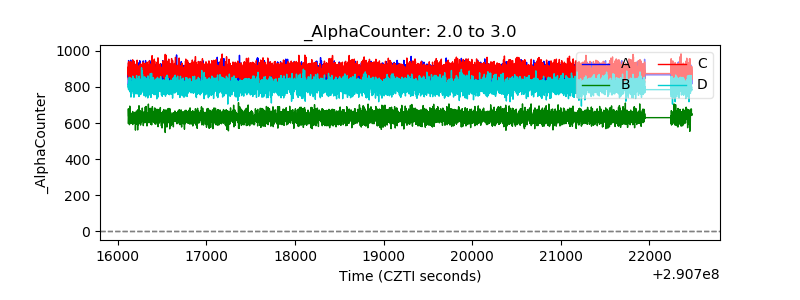 |
| _CPM_Rate | 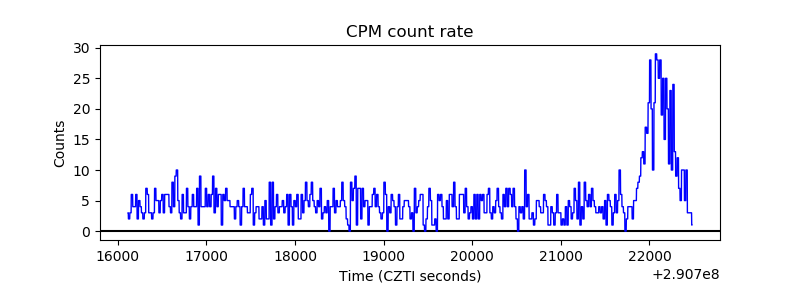 |
| CZT Counter | 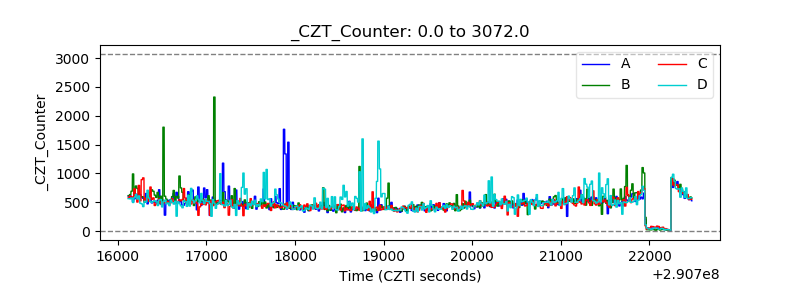 |
| +2.5 Volts monitor | 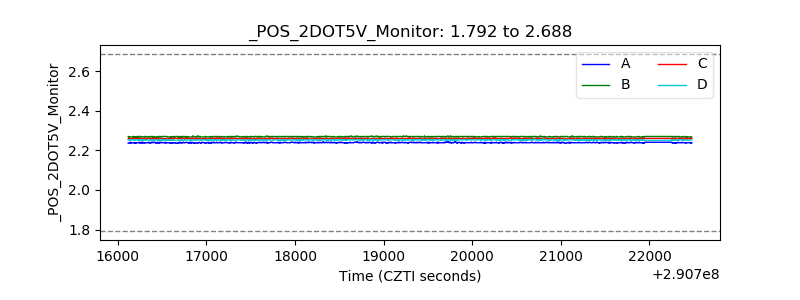 |
| +5 Volts monitor | 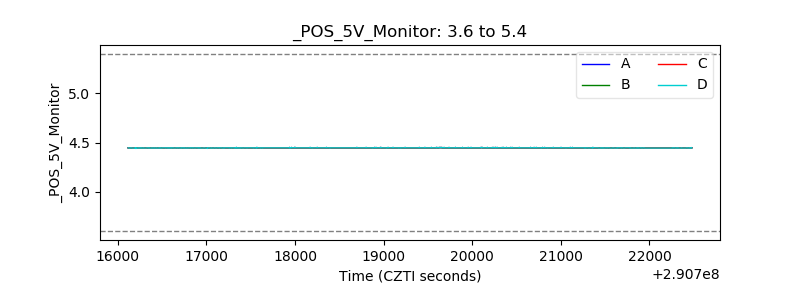 |
| _ROLL_ROT | 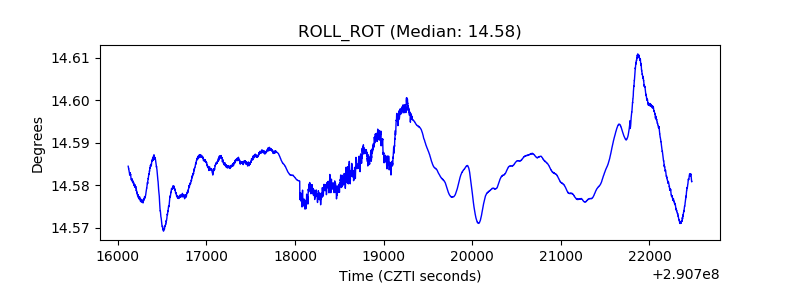 |
| _Roll_DEC | 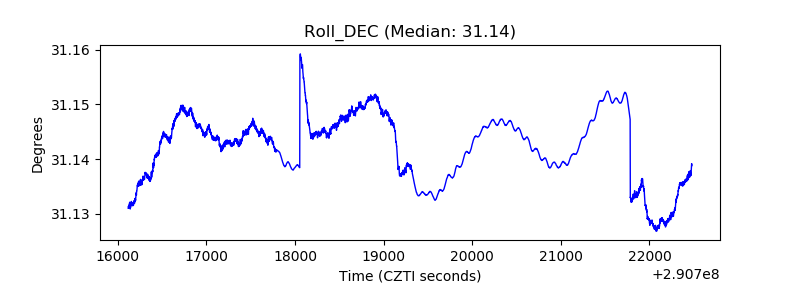 |
| _Roll_RA | 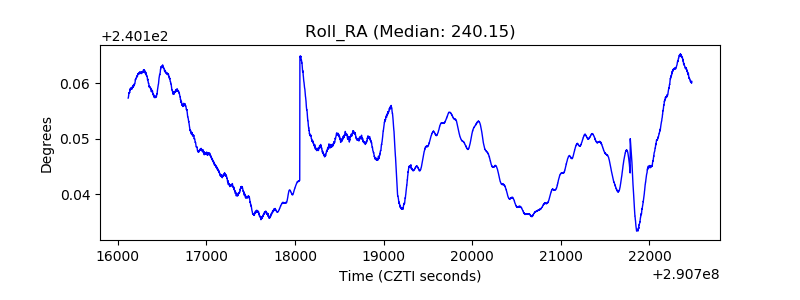 |
| Veto Counter | 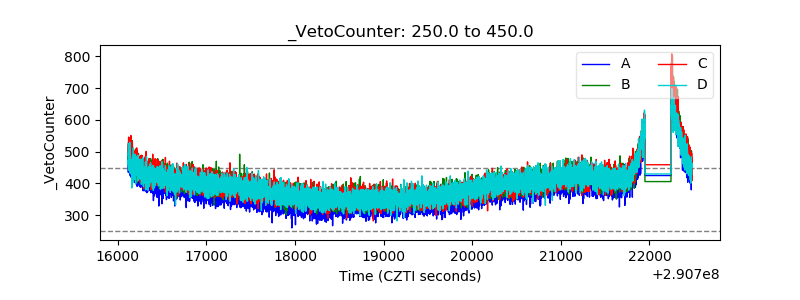 |