| Param | Original file | Final file |
|---|---|---|
| Filename | modeM0/AS1A05_088T03_9000002808_18782cztM0_level2.evt | modeM0/AS1A05_088T03_9000002808_18782cztM0_level2_quad_clean.evt |
| Size (bytes) | 126,567,360 | 23,486,400 |
| Size | 120.7 MB | 22.4 MB |
| Events in quadrant A | 885,358 | 148,612 |
| Events in quadrant B | 914,243 | 150,557 |
| Events in quadrant C | 870,666 | 145,721 |
| Events in quadrant D | 1,045,905 | 142,187 |
| Mode M0 | |||
|---|---|---|---|
| Quadrant | BADHDUFLAG | Total packets | Discarded packets |
| A | 0 | 3689 | 1 |
| B | 0 | 3774 | 1 |
| C | 0 | 3610 | 1 |
| D | 0 | 4189 | 1 |
| Mode SS | |||
|---|---|---|---|
| Quadrant | BADHDUFLAG | Total packets | Discarded packets |
| A | 0 | 34 | 0 |
| B | 0 | 34 | 0 |
| C | 0 | 34 | 0 |
| D | 0 | 34 | 0 |
| Mode M9 | |||
|---|---|---|---|
| Quadrant | BADHDUFLAG | Total packets | Discarded packets |
| A | 1 | 139773647649672 | 46 |
| B | 1 | -1 | -1 |
| C | 1 | -1 | -1 |
| D | 1 | -1 | -1 |
| Quadrant | Total seconds | Saturated seconds | Saturation percentage |
|---|---|---|---|
| A | 1680 | 36 | 2.142857% |
| B | 1680 | 49 | 2.916667% |
| C | 1680 | 59 | 3.511905% |
| D | 1680 | 49 | 2.916667% |
Noise dominated data is calculated using 1-second bins in cleaned event files. If a bin has >2000 counts, and if more than 50% of those come from <1% of pixels, then it is considered to be noise-dominated and hence unusable.
| Quadrant | # 1 sec bins | Bins with >0 counts | Bins with >2000 counts | High rate bins dominated by noise | Noise dominated (total time) | Noise dominated (detector-on time) | Marked lightcurve |
|---|---|---|---|---|---|---|---|
| A | 1680 | 1680 | 0 | 0 | 0.00% | 0.00% | 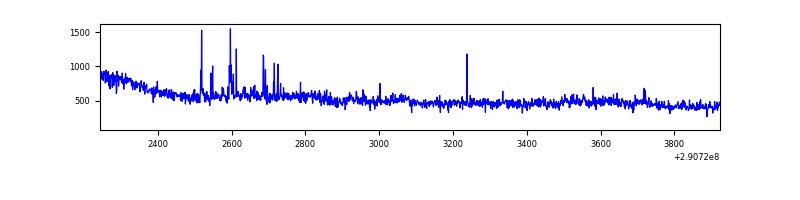 |
| B | 1680 | 1680 | 5 | 5 | 0.30% | 0.30% | 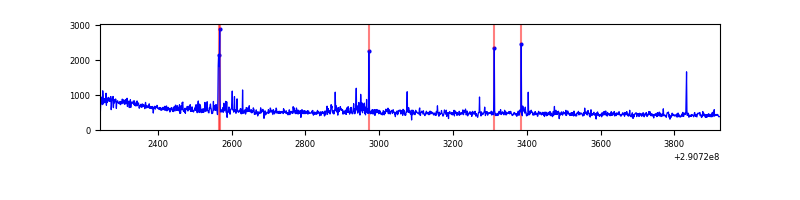 |
| C | 1680 | 1680 | 0 | 0 | 0.00% | 0.00% | 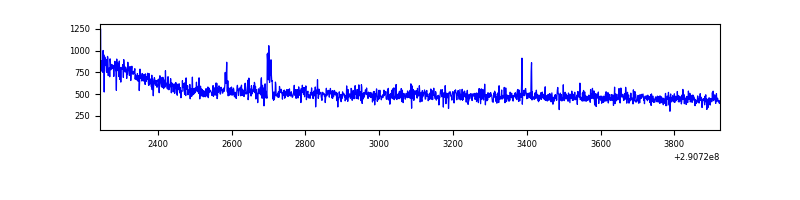 |
| D | 1680 | 1680 | 20 | 20 | 1.19% | 1.19% | 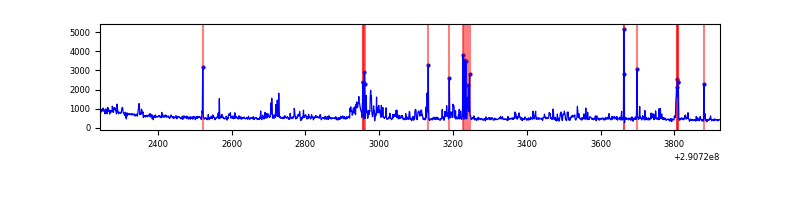 |
Top three noisy pixels from each quadrant. If the there are fewer than three noisy pixels in the level2.evt file, extra rows are filled as -1
| Pixel properties | Quadrant properties | ||||||
|---|---|---|---|---|---|---|---|
| Quadrant | DetID | PixID | Counts | Sigma | Mean | Median | Sigma |
| A | 6 | 16 | 43791 | 938.99 | 217 | 212 | 46.4 |
| A | 13 | 254 | 2828 | 56.37 | 217 | 212 | 46.4 |
| A | 0 | 226 | 1952 | 37.49 | 217 | 212 | 46.4 |
| B | 0 | 197 | 24170 | 544.01 | 218 | 213 | 44.0 |
| B | 7 | 220 | 21926 | 493.05 | 218 | 213 | 44.0 |
| B | 12 | 111 | 5100 | 110.97 | 218 | 213 | 44.0 |
| C | 14 | 238 | 32239 | 613.1 | 212 | 212 | 52.2 |
| C | 6 | 96 | 7575 | 140.95 | 212 | 212 | 52.2 |
| C | 5 | 112 | 2754 | 48.66 | 212 | 212 | 52.2 |
| D | 1 | 52 | 195106 | 3636.95 | 212 | 205 | 53.6 |
| D | 13 | 172 | 11491 | 210.6 | 212 | 205 | 53.6 |
| D | 2 | 234 | 8030 | 146.02 | 212 | 205 | 53.6 |
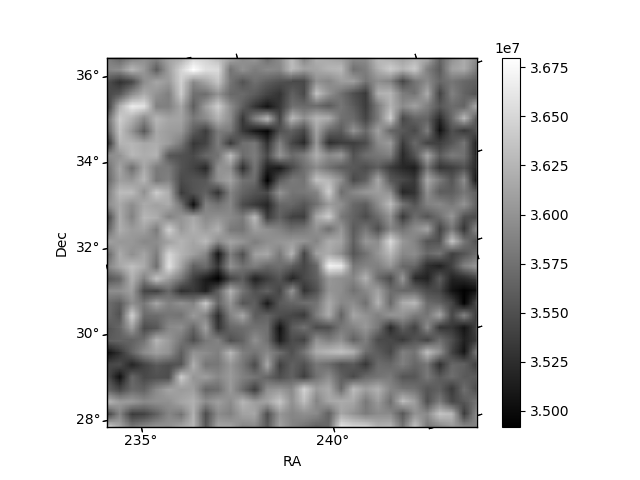
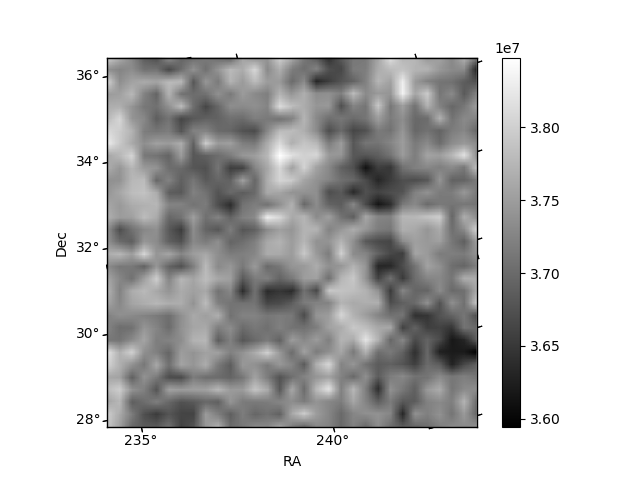
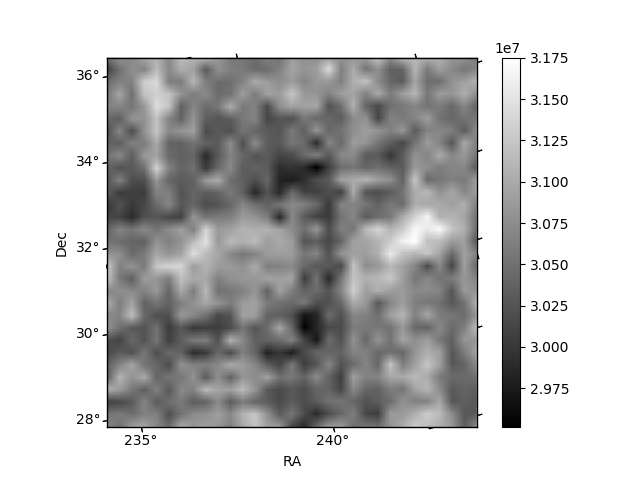
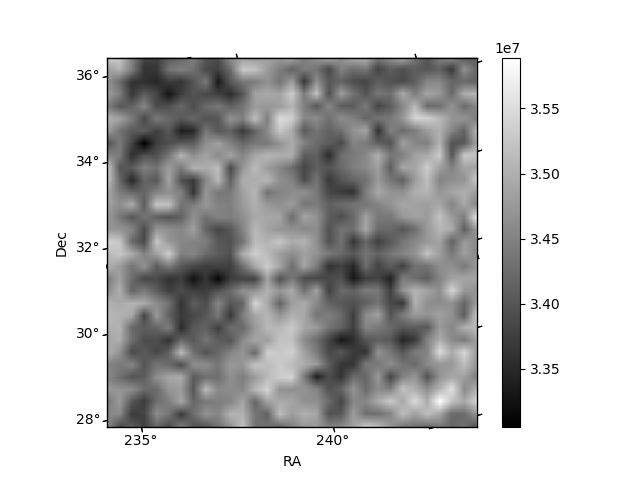
Histogram calculated using DETX and DETY for each event in the final _common_clean file
| Quadrant A | 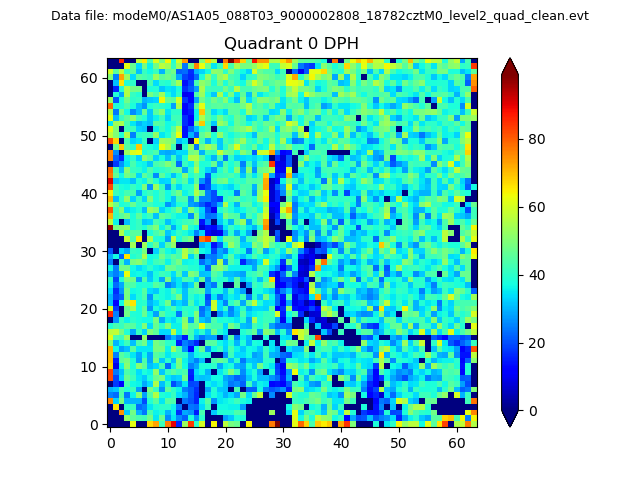 |
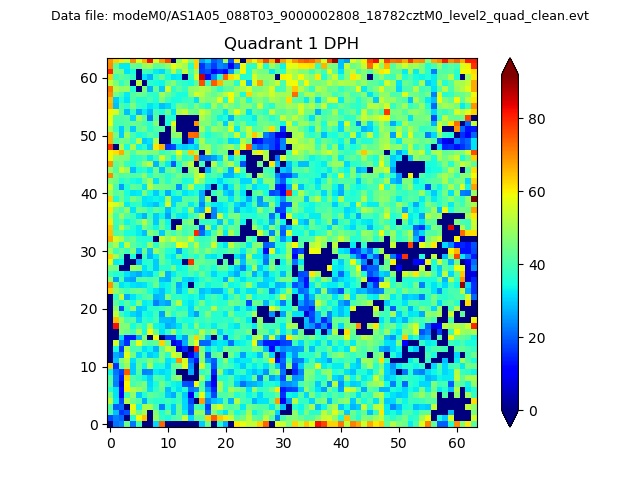 |
Quadrant B |
|---|---|---|---|
| Quadrant D |  |
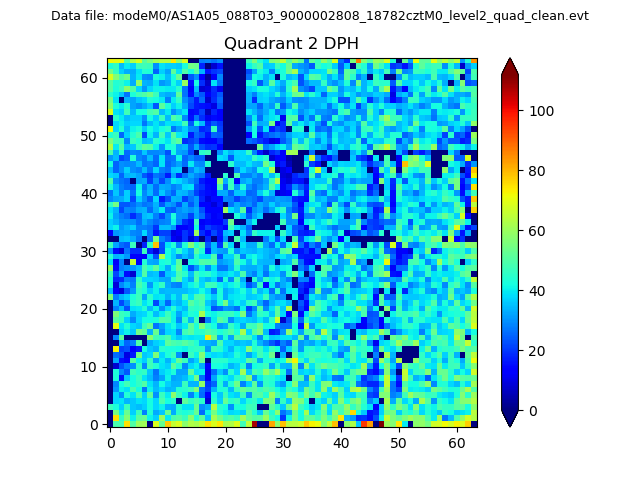 |
Quadrant C |
| Plot type | Count rate plots | Images |
|---|---|---|
| Comparison with Poisson distribution Blue bars denote a histogram of data divided into 1 sec bins. Red curve is a Poisson curve with rate = median count rate of data. |
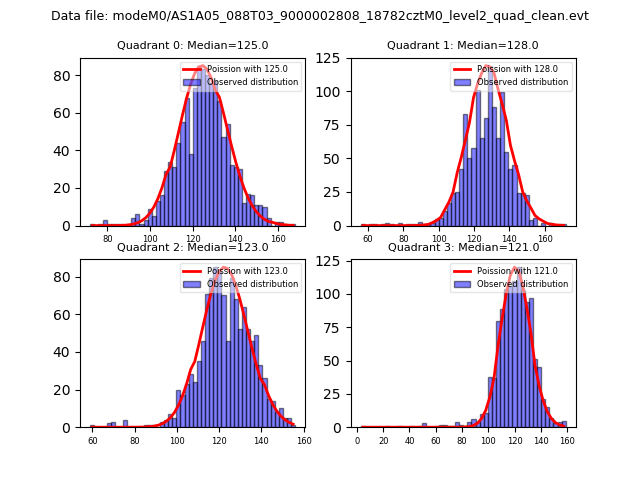 |
 |
| Quadrant-wise count rates Data is divided into 100 sec bins |
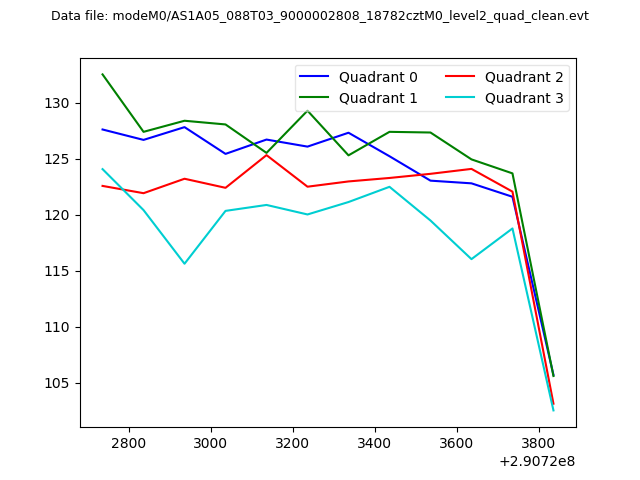 |
|
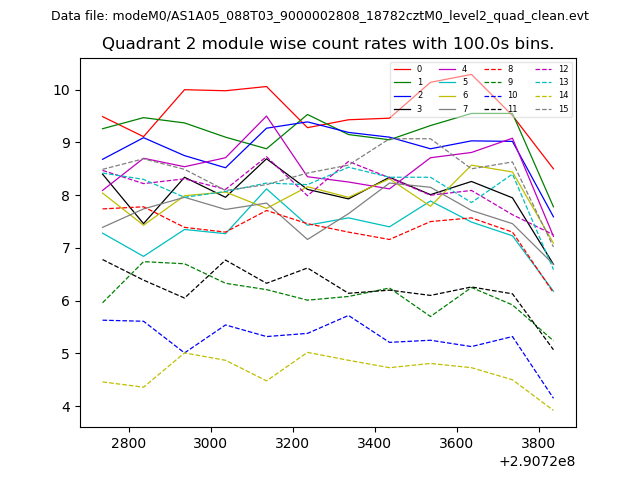
| Module-wise count rates for Quadrant A Data is divided into 100 sec bins |
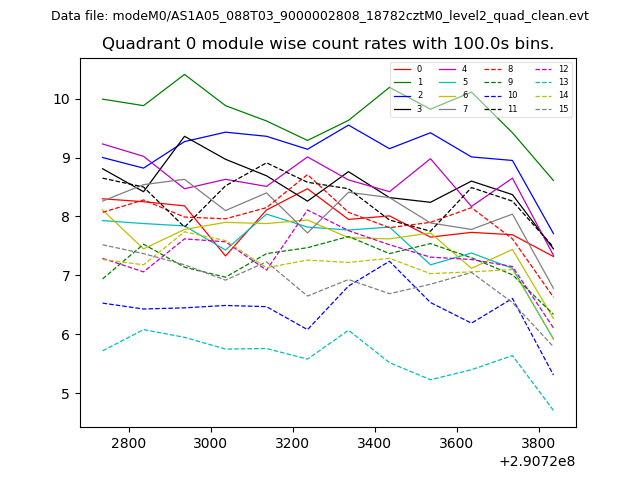 |
 |
| Module-wise count rates for Quadrant B Data is divided into 100 sec bins |
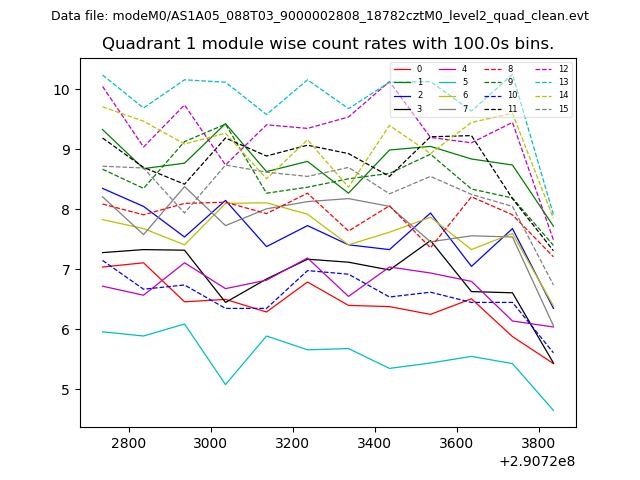 |
 |
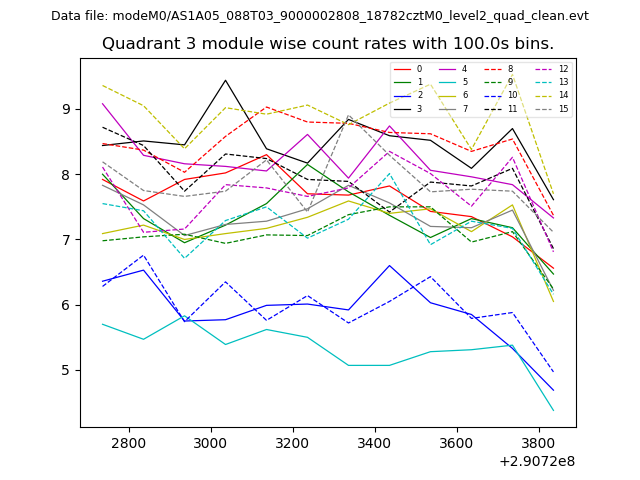
| Module-wise count rates for Quadrant C Data is divided into 100 sec bins |
 |
 |
| Module-wise count rates for Quadrant D Data is divided into 100 sec bins |
 |
 |
| Parameter | Plot |
|---|---|
| CZT HV Monitor | 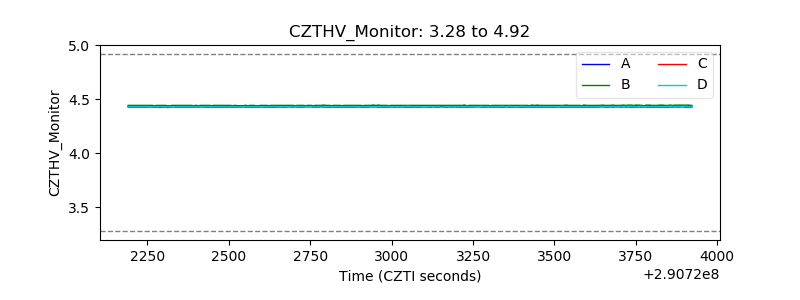 |
| D_VDD | 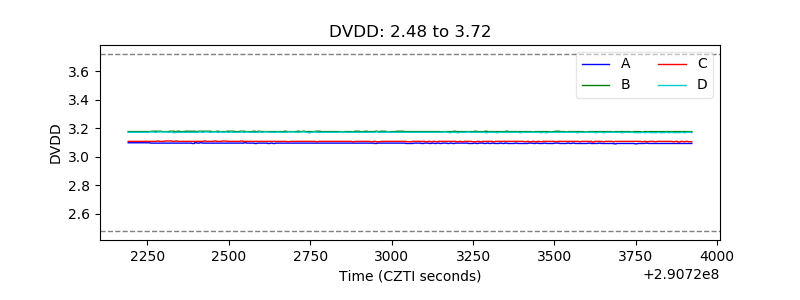 |
| Temperature 1 | 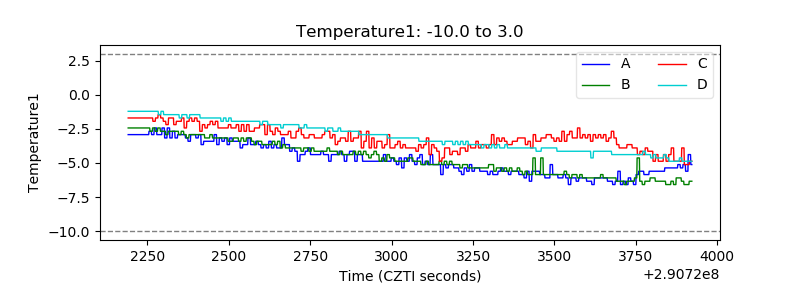 |
| Veto HV Monitor | 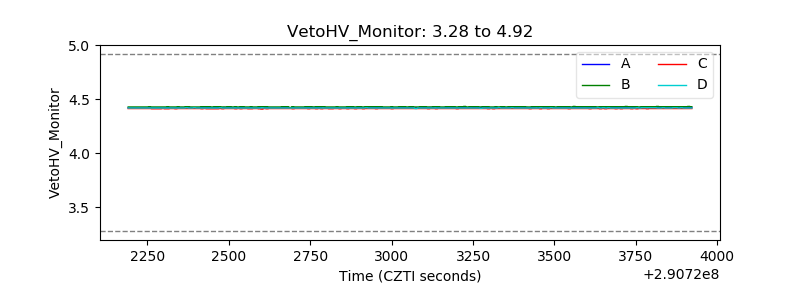 |
| Veto LLD | 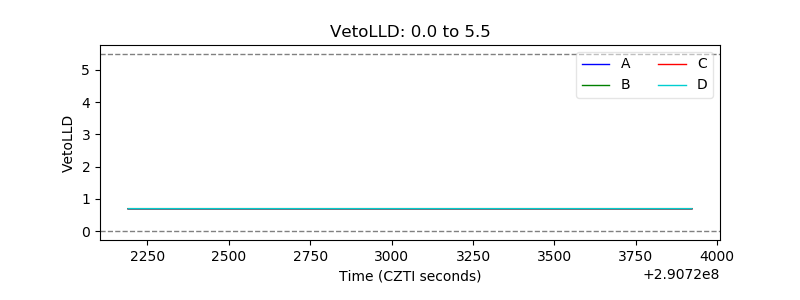 |
| Alpha Counter | 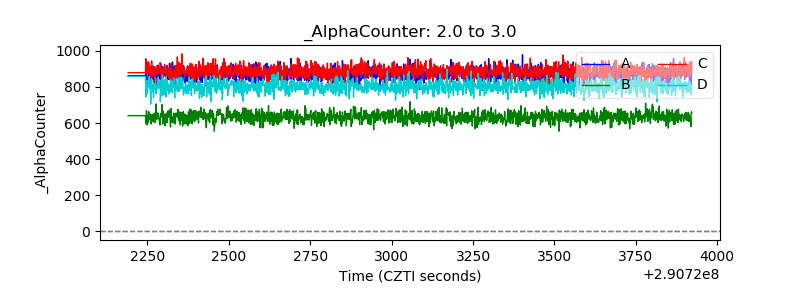 |
| _CPM_Rate | 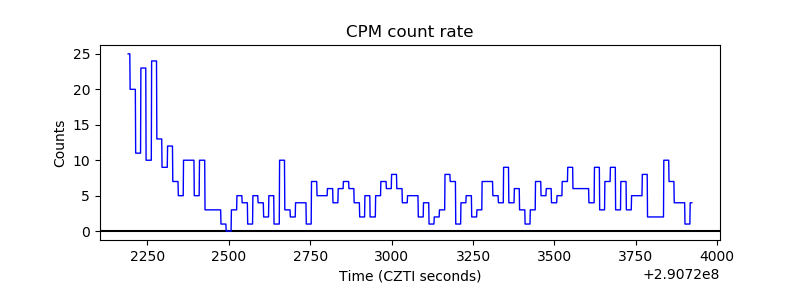 |
| CZT Counter |  |
| +2.5 Volts monitor |  |
| +5 Volts monitor | 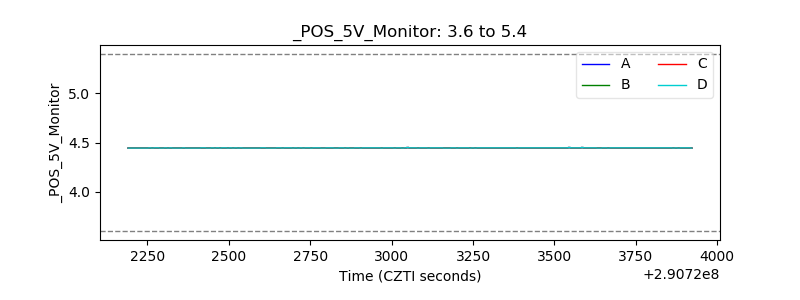 |
| _ROLL_ROT | 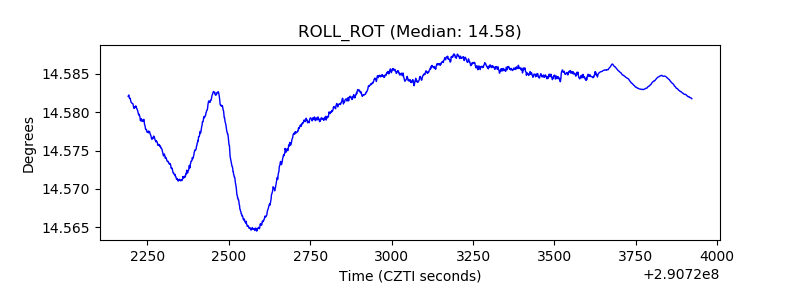 |
| _Roll_DEC | 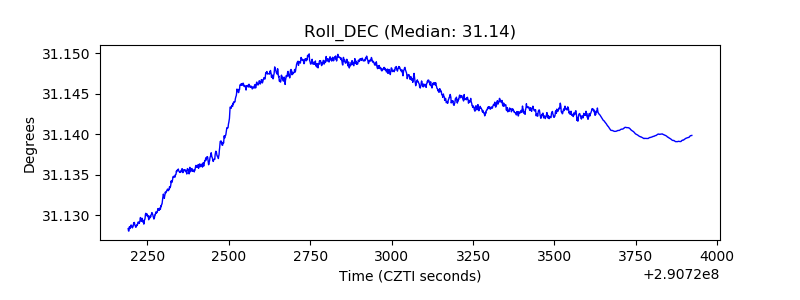 |
| _Roll_RA |  |
| Veto Counter | 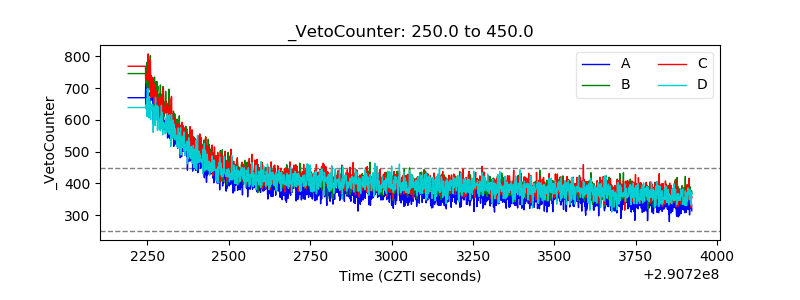 |