| Param | Original file | Final file |
|---|---|---|
| Filename | modeM0/AS1A05_173T01_9000002812_18808cztM0_level2.evt | modeM0/AS1A05_173T01_9000002812_18808cztM0_level2_quad_clean.evt |
| Size (bytes) | 504,748,800 | 83,954,880 |
| Size | 481.4 MB | 80.1 MB |
| Events in quadrant A | 3,504,049 | 518,883 |
| Events in quadrant B | 3,857,859 | 519,210 |
| Events in quadrant C | 3,842,912 | 504,163 |
| Events in quadrant D | 3,587,397 | 493,431 |
| Mode SS | |||
|---|---|---|---|
| Quadrant | BADHDUFLAG | Total packets | Discarded packets |
| A | 0 | 146 | 0 |
| B | 0 | 146 | 0 |
| C | 0 | 146 | 0 |
| D | 0 | 146 | 0 |
| Mode M9 | |||
|---|---|---|---|
| Quadrant | BADHDUFLAG | Total packets | Discarded packets |
| A | 0 | 5 | 0 |
| B | 0 | 5 | 0 |
| C | 0 | 5 | 0 |
| D | 0 | 5 | 0 |
| Mode M0 | |||
|---|---|---|---|
| Quadrant | BADHDUFLAG | Total packets | Discarded packets |
| A | 0 | 14983 | 1 |
| B | 0 | 15999 | 1 |
| C | 0 | 16030 | 1 |
| D | 0 | 15489 | 2 |
| Quadrant | Total seconds | Saturated seconds | Saturation percentage |
|---|---|---|---|
| A | 7282 | 35 | 0.480637% |
| B | 7283 | 82 | 1.125910% |
| C | 7283 | 154 | 2.114513% |
| D | 7282 | 46 | 0.631695% |
Noise dominated data is calculated using 1-second bins in cleaned event files. If a bin has >2000 counts, and if more than 50% of those come from <1% of pixels, then it is considered to be noise-dominated and hence unusable.
| Quadrant | # 1 sec bins | Bins with >0 counts | Bins with >2000 counts | High rate bins dominated by noise | Noise dominated (total time) | Noise dominated (detector-on time) | Marked lightcurve |
|---|---|---|---|---|---|---|---|
| A | 7712 | 7283 | 0 | 0 | 0.00% | 0.00% | 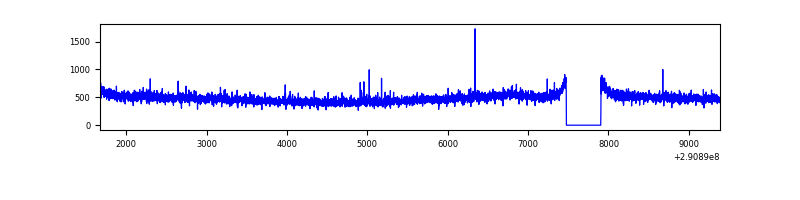 |
| B | 7713 | 7284 | 7 | 7 | 0.09% | 0.10% | 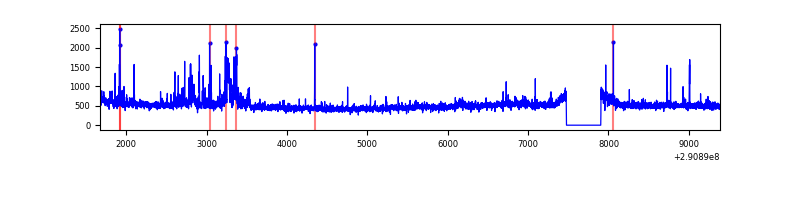 |
| C | 7713 | 7284 | 2 | 2 | 0.03% | 0.03% | 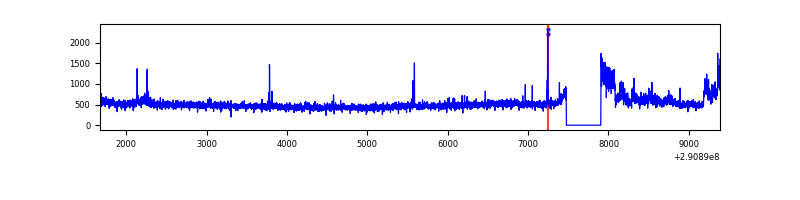 |
| D | 7712 | 7283 | 15 | 15 | 0.19% | 0.21% | 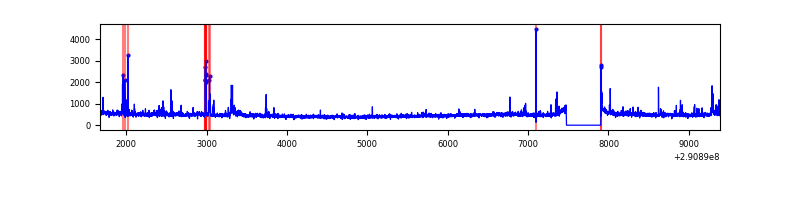 |
Top three noisy pixels from each quadrant. If the there are fewer than three noisy pixels in the level2.evt file, extra rows are filled as -1
| Pixel properties | Quadrant properties | ||||||
|---|---|---|---|---|---|---|---|
| Quadrant | DetID | PixID | Counts | Sigma | Mean | Median | Sigma |
| A | 11 | 29 | 14029 | 71.81 | 900 | 881 | 183.1 |
| A | 4 | 2 | 13147 | 66.99 | 900 | 881 | 183.1 |
| A | 13 | 254 | 12807 | 65.14 | 900 | 881 | 183.1 |
| B | 0 | 229 | 109619 | 630.39 | 896 | 874 | 172.5 |
| B | 12 | 18 | 52332 | 298.3 | 896 | 874 | 172.5 |
| B | 7 | 220 | 50270 | 286.35 | 896 | 874 | 172.5 |
| C | 3 | 233 | 320333 | 1569.75 | 860 | 865 | 203.5 |
| C | 14 | 238 | 132109 | 644.89 | 860 | 865 | 203.5 |
| C | 9 | 54 | 23918 | 113.27 | 860 | 865 | 203.5 |
| D | 7 | 38 | 103758 | 474.95 | 875 | 846 | 216.7 |
| D | 12 | 233 | 49332 | 223.77 | 875 | 846 | 216.7 |
| D | 7 | 238 | 48231 | 218.69 | 875 | 846 | 216.7 |
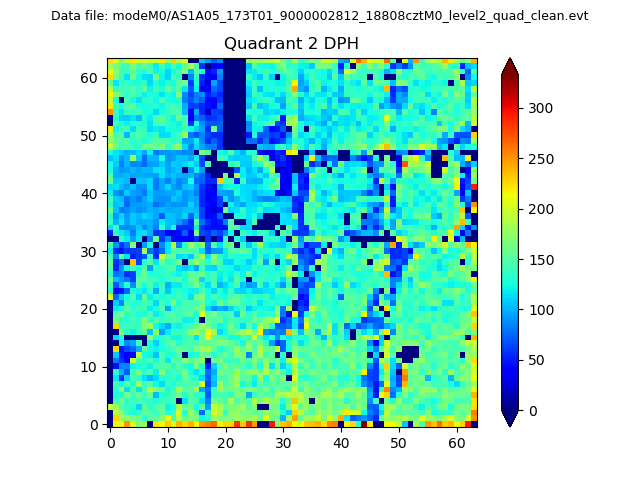
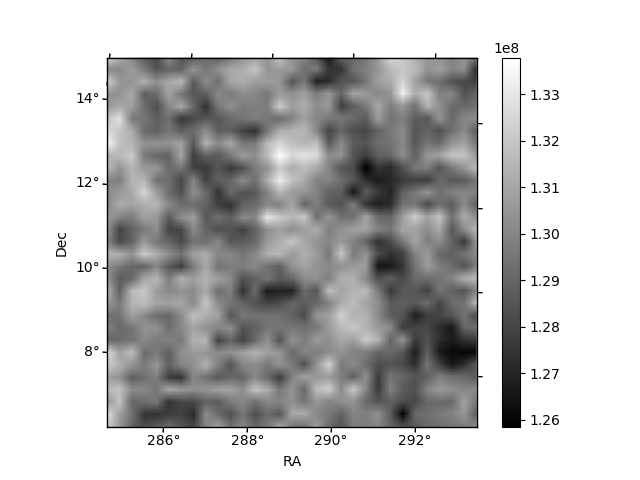
Histogram calculated using DETX and DETY for each event in the final _common_clean file
| Quadrant A | 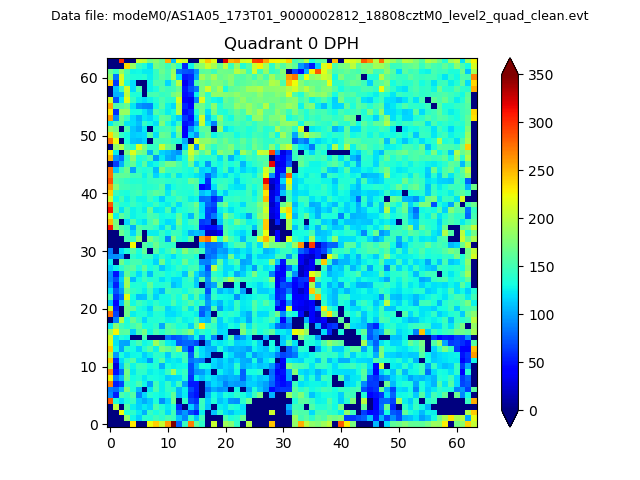 |
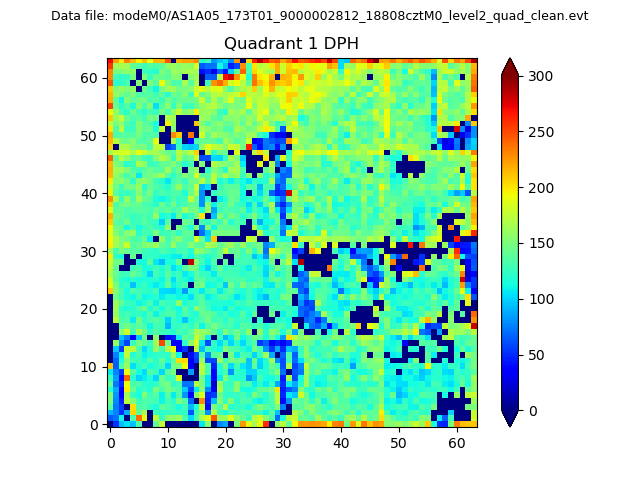 |
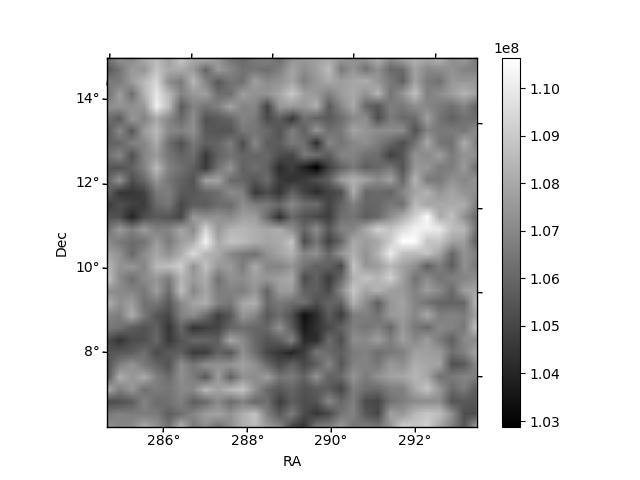
Quadrant B |
|---|---|---|---|
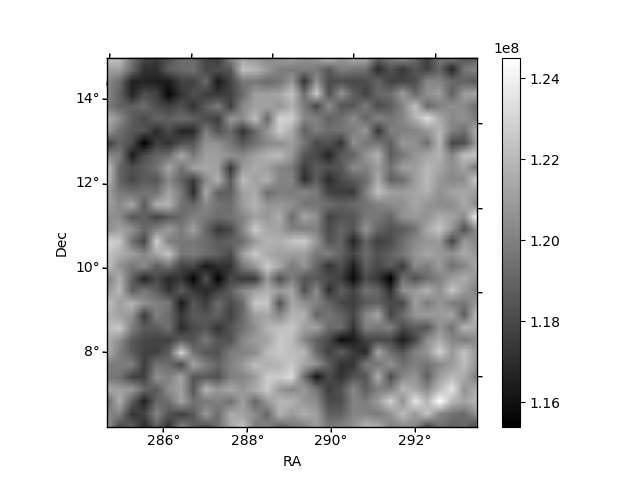
| Quadrant D | 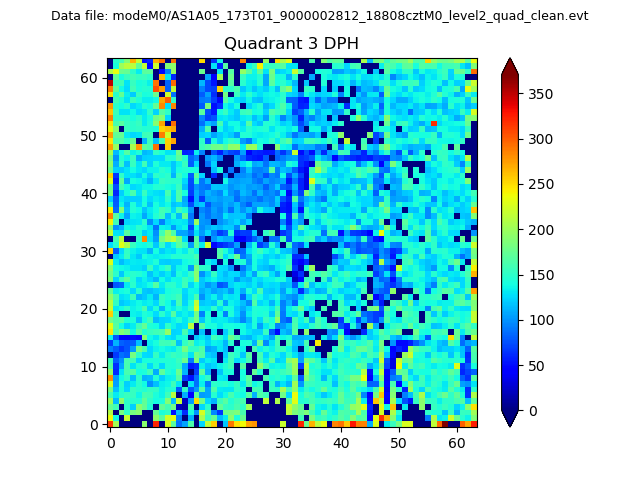 |
 |
Quadrant C |
| Plot type | Count rate plots | Images |
|---|---|---|
| Comparison with Poisson distribution Blue bars denote a histogram of data divided into 1 sec bins. Red curve is a Poisson curve with rate = median count rate of data. |
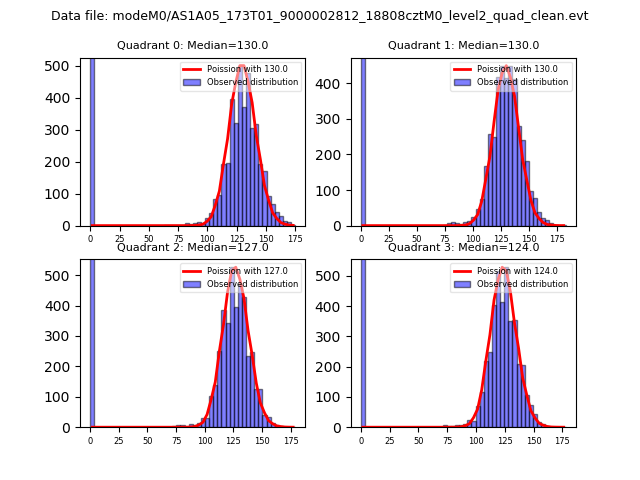 |
 |
| Quadrant-wise count rates Data is divided into 100 sec bins |
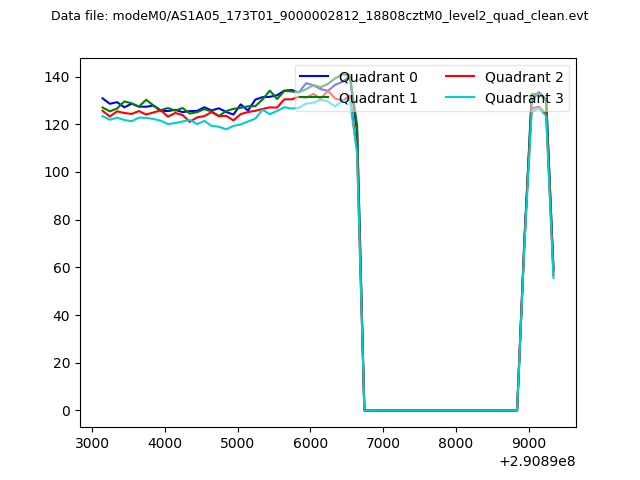 |
|
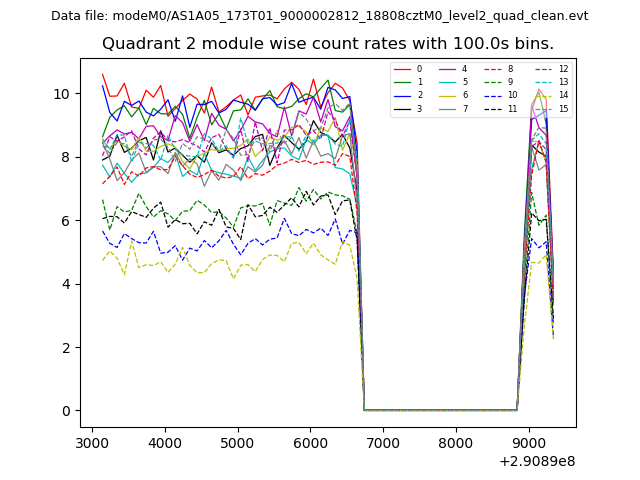
| Module-wise count rates for Quadrant A Data is divided into 100 sec bins |
 |
 |
| Module-wise count rates for Quadrant B Data is divided into 100 sec bins |
 |
 |
| Module-wise count rates for Quadrant C Data is divided into 100 sec bins |
 |
 |
| Module-wise count rates for Quadrant D Data is divided into 100 sec bins |
 |
 |
| Parameter | Plot |
|---|---|
| CZT HV Monitor | 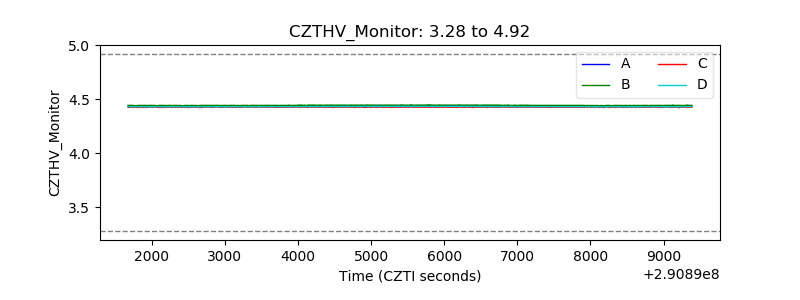 |
| D_VDD | 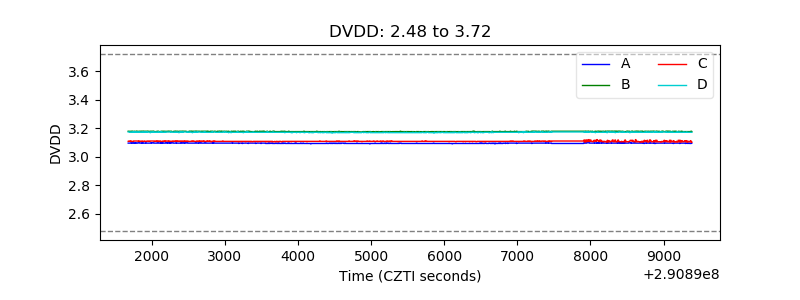 |
| Temperature 1 |  |
| Veto HV Monitor |  |
| Veto LLD | 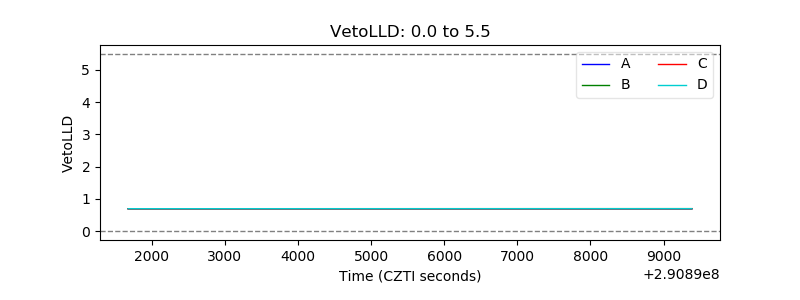 |
| Alpha Counter | 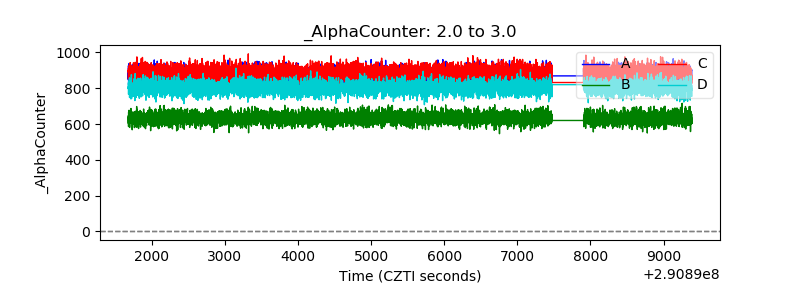 |
| _CPM_Rate | 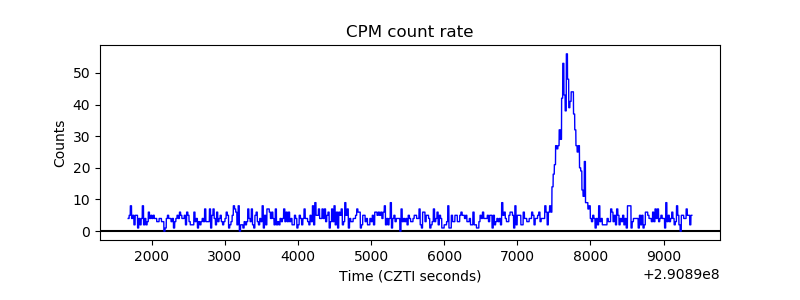 |
| CZT Counter | 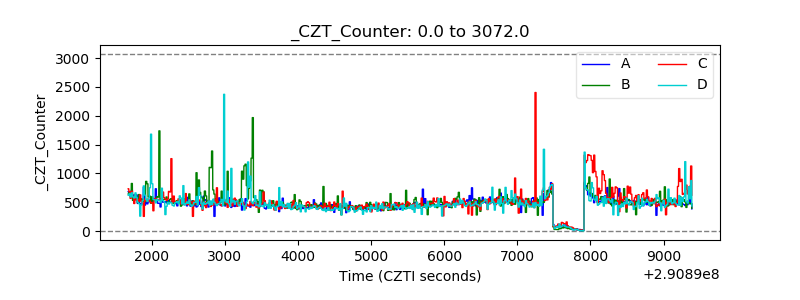 |
| +2.5 Volts monitor | 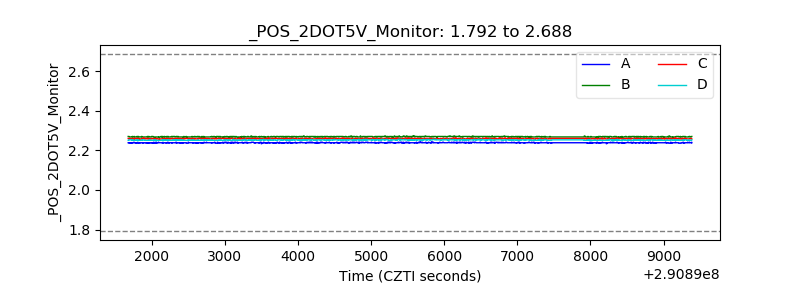 |
| +5 Volts monitor |  |
| _ROLL_ROT | 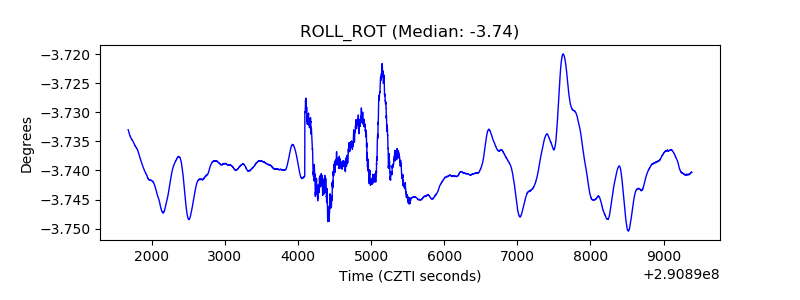 |
| _Roll_DEC | 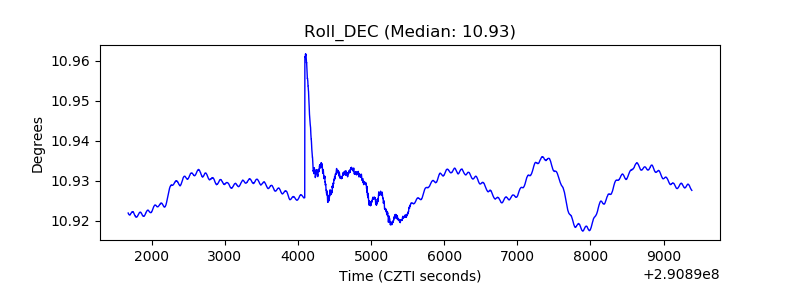 |
| _Roll_RA | 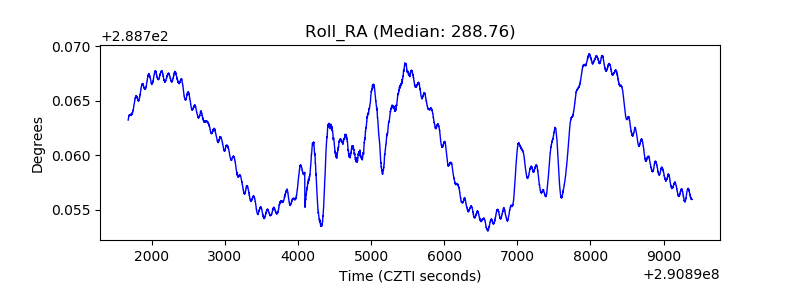 |
| Veto Counter | 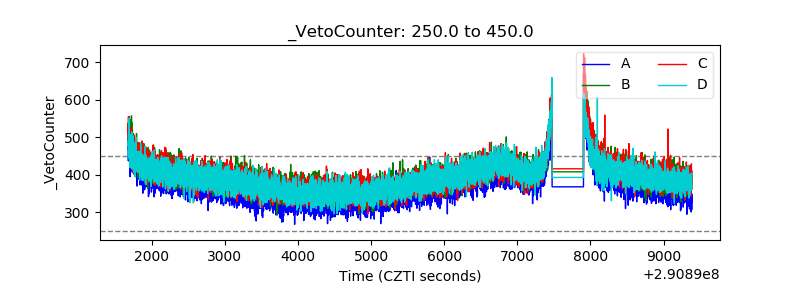 |