| Param | Original file | Final file |
|---|---|---|
| Filename | modeM0/AS1A05_173T01_9000002812_18810cztM0_level2.evt | modeM0/AS1A05_173T01_9000002812_18810cztM0_level2_quad_clean.evt |
| Size (bytes) | 668,551,680 | 123,825,600 |
| Size | 637.6 MB | 118.1 MB |
| Events in quadrant A | 4,080,197 | 800,469 |
| Events in quadrant B | 4,228,038 | 805,784 |
| Events in quadrant C | 7,341,945 | 765,024 |
| Events in quadrant D | 4,001,535 | 769,002 |
| Mode SS | |||
|---|---|---|---|
| Quadrant | BADHDUFLAG | Total packets | Discarded packets |
| A | 0 | 176 | 0 |
| B | 0 | 176 | 0 |
| C | 0 | 176 | 0 |
| D | 0 | 176 | 0 |
| Mode M9 | |||
|---|---|---|---|
| Quadrant | BADHDUFLAG | Total packets | Discarded packets |
| A | 0 | 6 | 0 |
| B | 0 | 6 | 0 |
| C | 0 | 6 | 0 |
| D | 0 | 6 | 0 |
| Mode M0 | |||
|---|---|---|---|
| Quadrant | BADHDUFLAG | Total packets | Discarded packets |
| A | 0 | 17991 | 1 |
| B | 0 | 18262 | 1 |
| C | 0 | 27736 | 1 |
| D | 0 | 18239 | 1 |
| Quadrant | Total seconds | Saturated seconds | Saturation percentage |
|---|---|---|---|
| A | 8793 | 41 | 0.466280% |
| B | 8793 | 65 | 0.739224% |
| C | 8793 | 886 | 10.076197% |
| D | 8793 | 24 | 0.272944% |
Noise dominated data is calculated using 1-second bins in cleaned event files. If a bin has >2000 counts, and if more than 50% of those come from <1% of pixels, then it is considered to be noise-dominated and hence unusable.
| Quadrant | # 1 sec bins | Bins with >0 counts | Bins with >2000 counts | High rate bins dominated by noise | Noise dominated (total time) | Noise dominated (detector-on time) | Marked lightcurve |
|---|---|---|---|---|---|---|---|
| A | 9358 | 8794 | 1 | 1 | 0.01% | 0.01% | 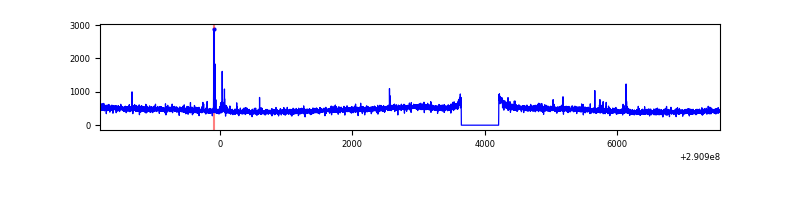 |
| B | 9358 | 8794 | 1 | 1 | 0.01% | 0.01% | 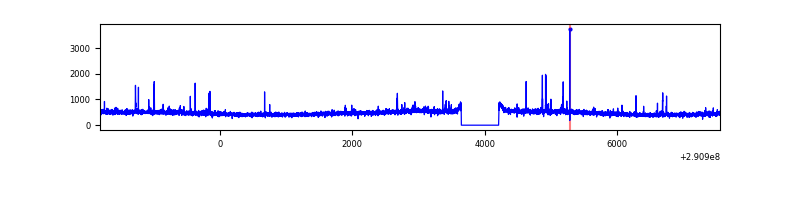 |
| C | 9358 | 8794 | 499 | 499 | 5.33% | 5.67% | 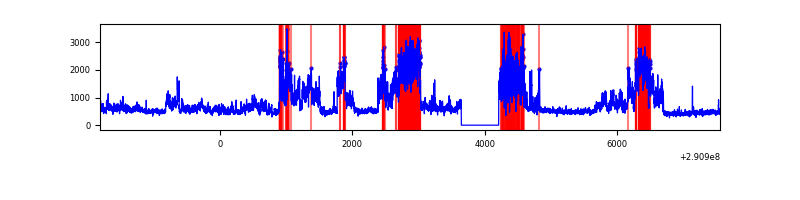 |
| D | 9358 | 8794 | 4 | 4 | 0.04% | 0.05% | 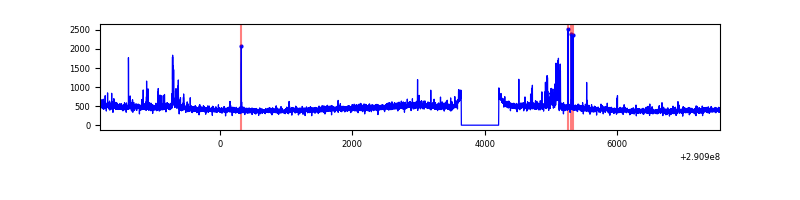 |
Top three noisy pixels from each quadrant. If the there are fewer than three noisy pixels in the level2.evt file, extra rows are filled as -1
| Pixel properties | Quadrant properties | ||||||
|---|---|---|---|---|---|---|---|
| Quadrant | DetID | PixID | Counts | Sigma | Mean | Median | Sigma |
| A | 4 | 2 | 42384 | 195.65 | 1043 | 1022 | 211.4 |
| A | 13 | 254 | 15069 | 66.44 | 1043 | 1022 | 211.4 |
| A | 0 | 226 | 9007 | 37.77 | 1043 | 1022 | 211.4 |
| B | 0 | 230 | 45529 | 221.22 | 1043 | 1017 | 201.2 |
| B | 0 | 229 | 29326 | 140.69 | 1043 | 1017 | 201.2 |
| B | 12 | 111 | 23803 | 113.24 | 1043 | 1017 | 201.2 |
| C | 3 | 233 | 3377469 | 14821.27 | 966 | 972 | 227.8 |
| C | 14 | 238 | 147858 | 644.76 | 966 | 972 | 227.8 |
| C | 9 | 54 | 32870 | 140.02 | 966 | 972 | 227.8 |
| D | 9 | 1 | 66383 | 263.59 | 1014 | 986 | 248.1 |
| D | 7 | 38 | 58507 | 231.85 | 1014 | 986 | 248.1 |
| D | 2 | 234 | 38649 | 151.81 | 1014 | 986 | 248.1 |
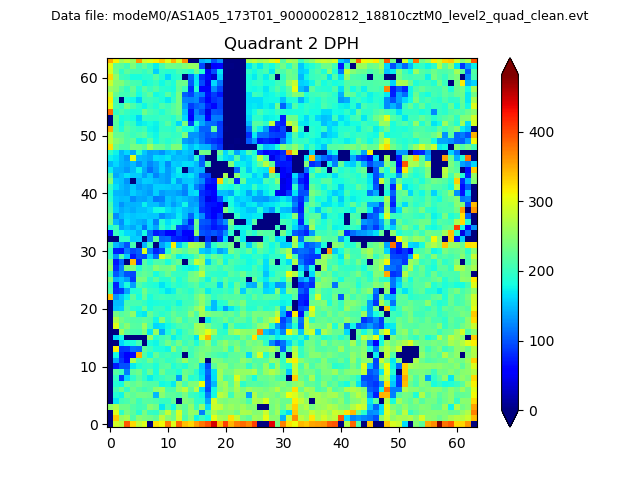
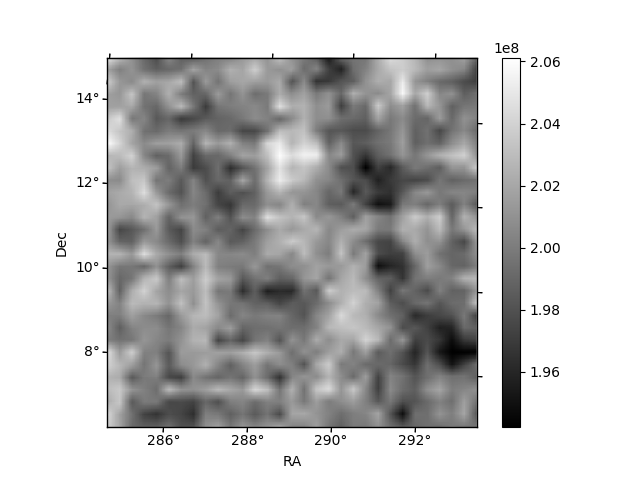
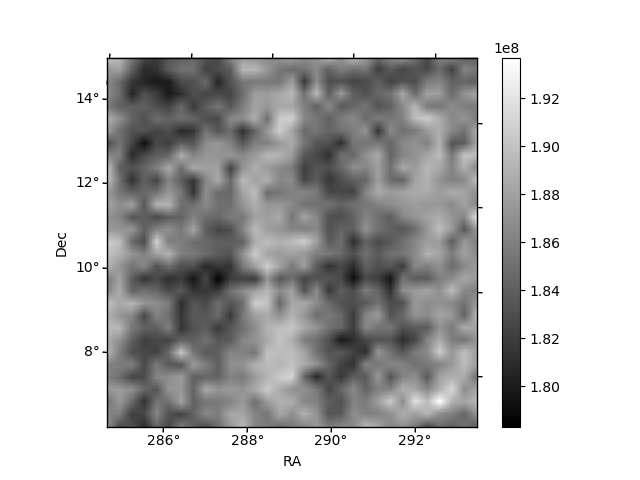
Histogram calculated using DETX and DETY for each event in the final _common_clean file
| Quadrant A | 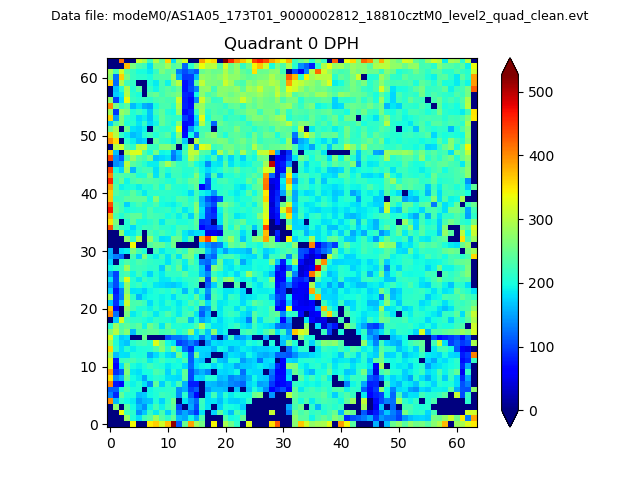 |
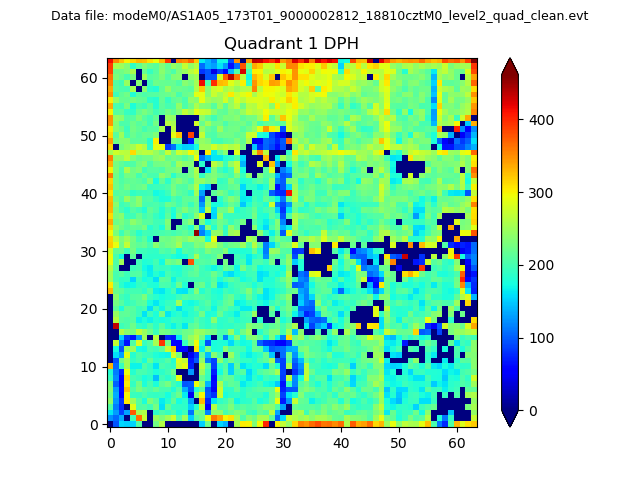 |
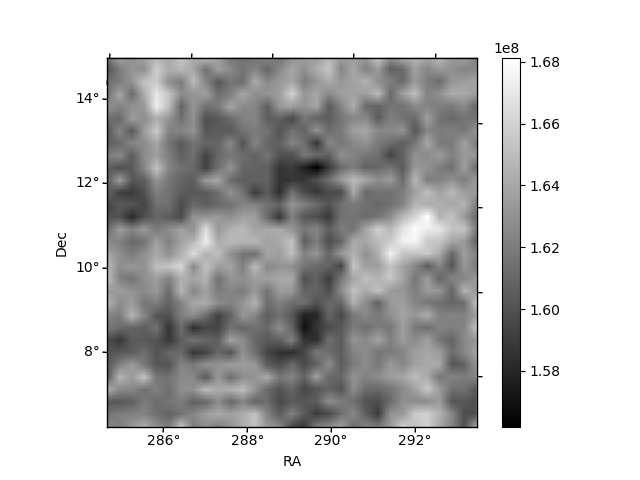
Quadrant B |
|---|---|---|---|
| Quadrant D | 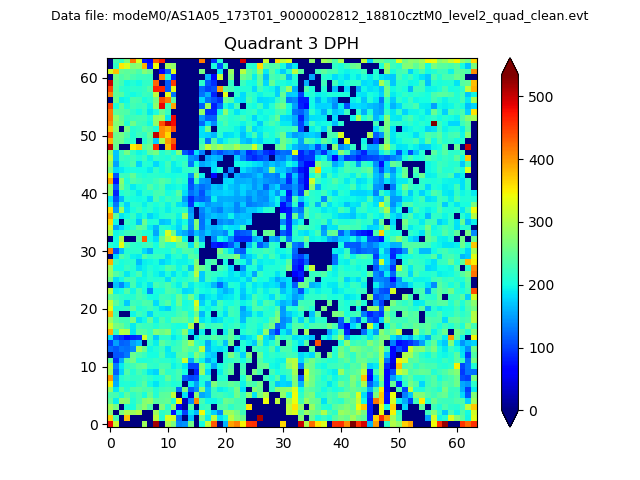 |
 |
Quadrant C |
| Plot type | Count rate plots | Images |
|---|---|---|
| Comparison with Poisson distribution Blue bars denote a histogram of data divided into 1 sec bins. Red curve is a Poisson curve with rate = median count rate of data. |
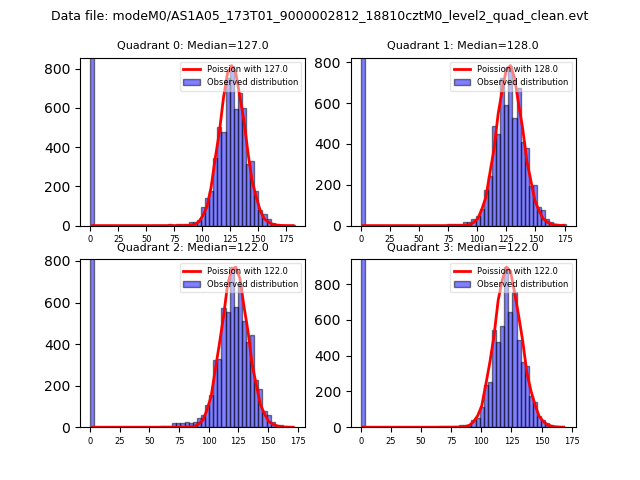 |
 |
| Quadrant-wise count rates Data is divided into 100 sec bins |
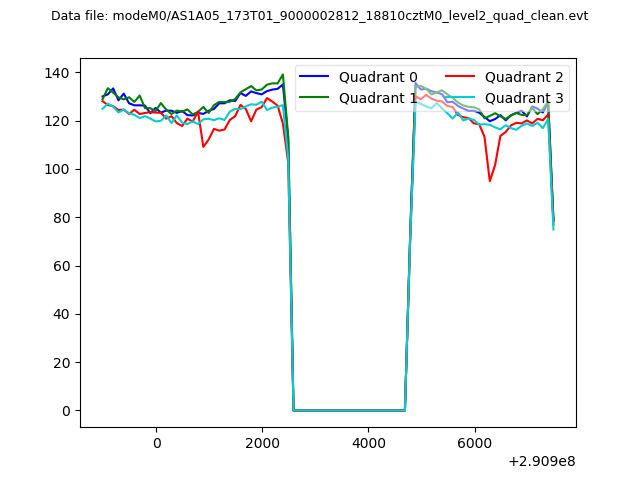 |
|
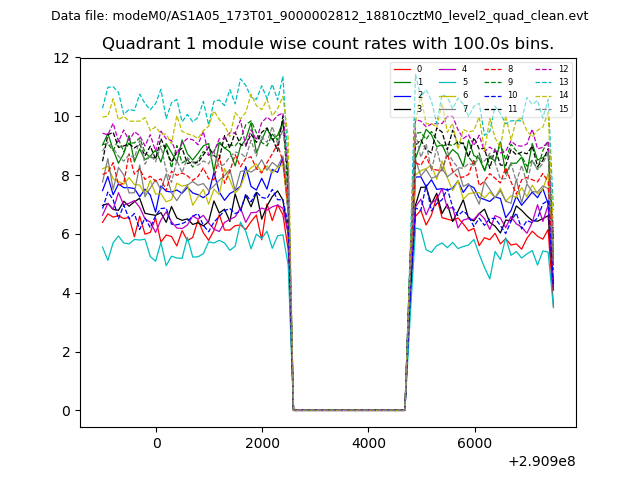
| Module-wise count rates for Quadrant A Data is divided into 100 sec bins |
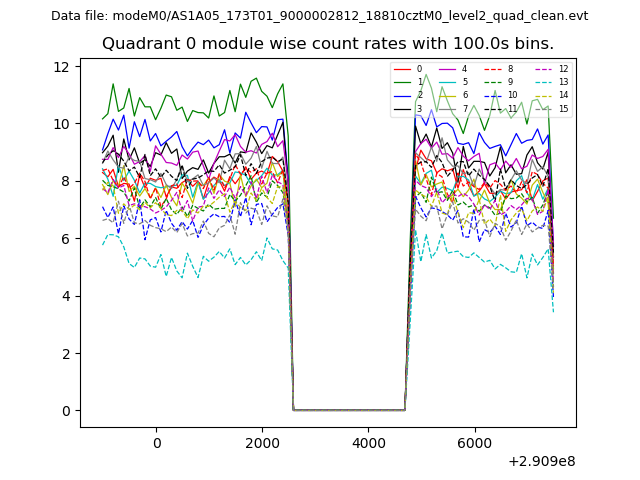 |
 |
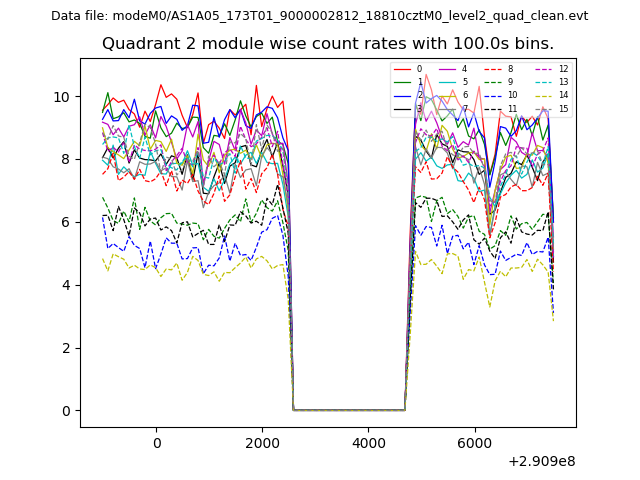
| Module-wise count rates for Quadrant B Data is divided into 100 sec bins |
 |
 |
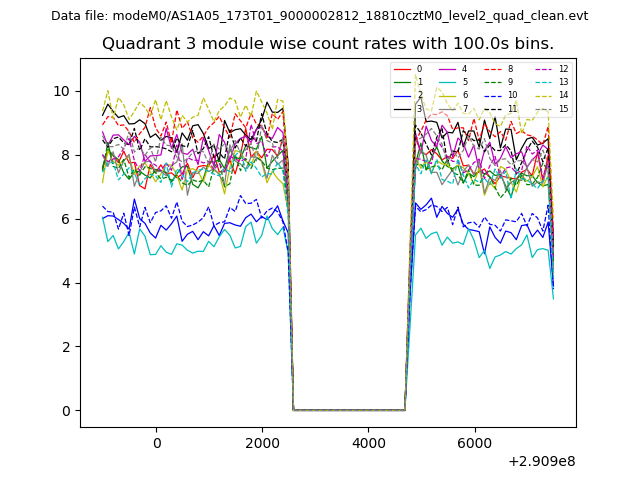
| Module-wise count rates for Quadrant C Data is divided into 100 sec bins |
 |
 |
| Module-wise count rates for Quadrant D Data is divided into 100 sec bins |
 |
 |
| Parameter | Plot |
|---|---|
| CZT HV Monitor | 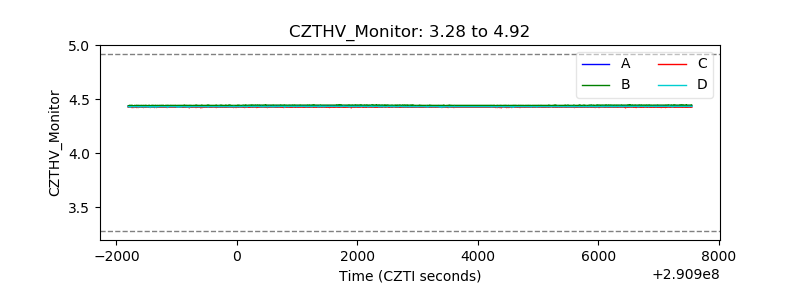 |
| D_VDD | 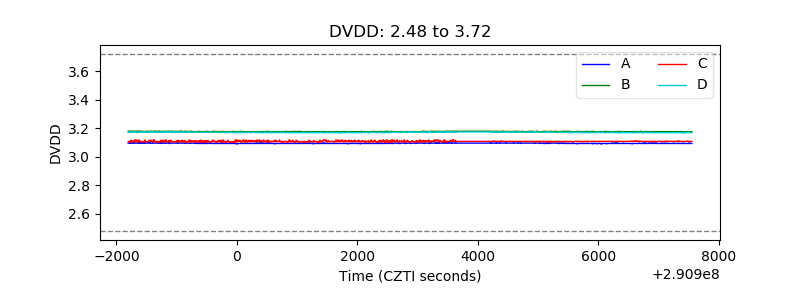 |
| Temperature 1 | 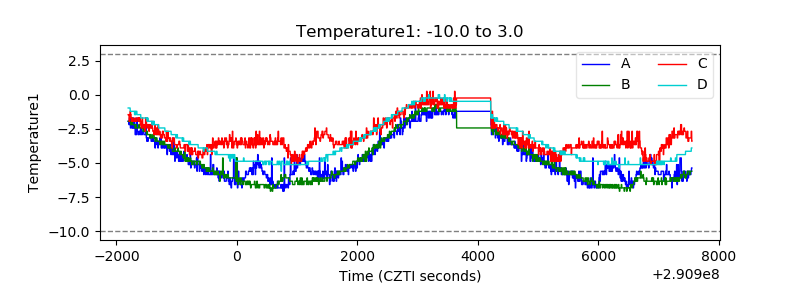 |
| Veto HV Monitor | 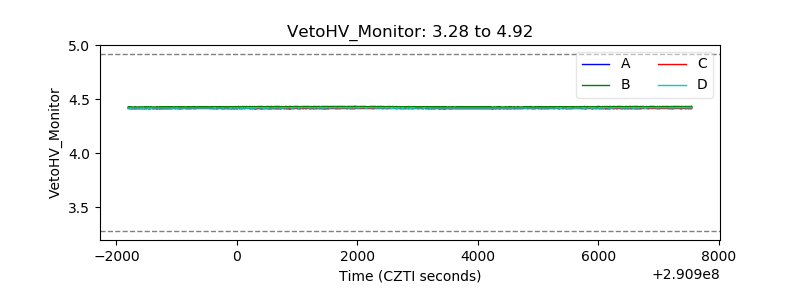 |
| Veto LLD | 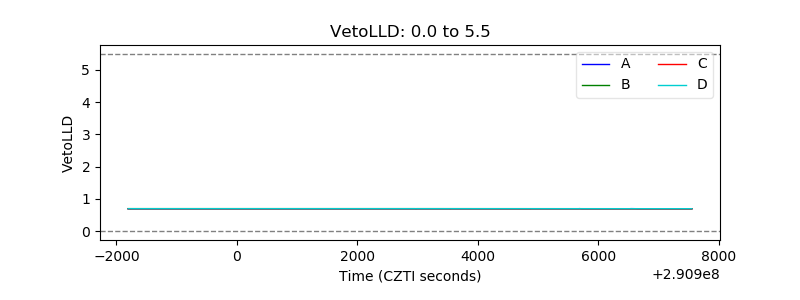 |
| Alpha Counter | 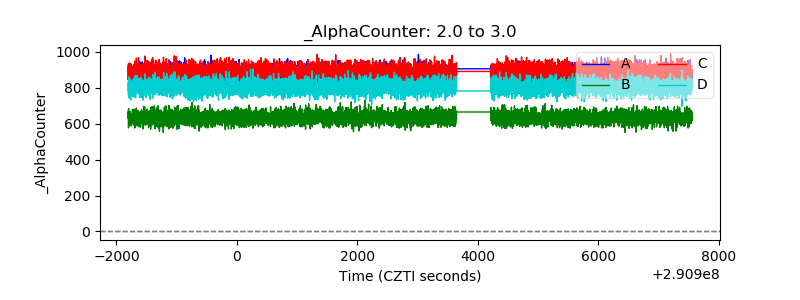 |
| _CPM_Rate |  |
| CZT Counter | 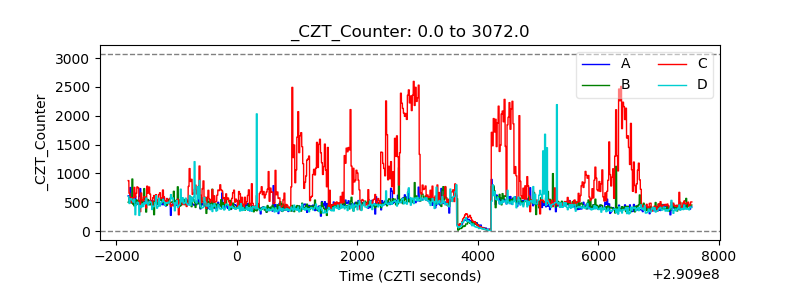 |
| +2.5 Volts monitor |  |
| +5 Volts monitor |  |
| _ROLL_ROT | 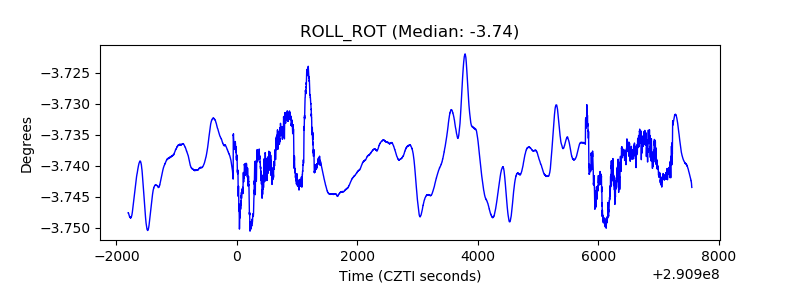 |
| _Roll_DEC | 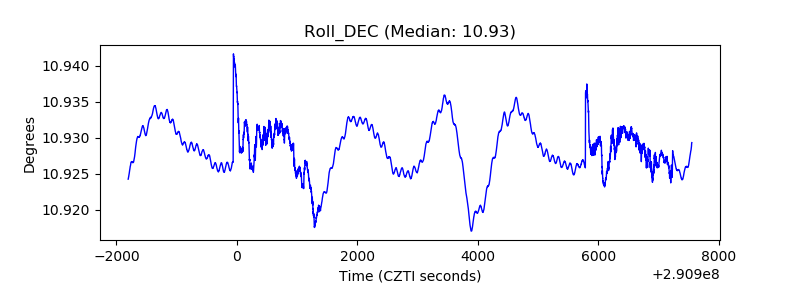 |
| _Roll_RA |  |
| Veto Counter | 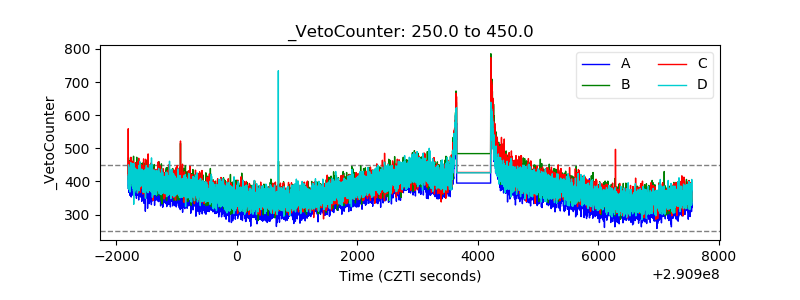 |