| Param | Original file | Final file |
|---|---|---|
| Filename | modeM0/AS1A05_173T01_9000002812_18812cztM0_level2.evt | modeM0/AS1A05_173T01_9000002812_18812cztM0_level2_quad_clean.evt |
| Size (bytes) | 492,612,480 | 102,936,960 |
| Size | 469.8 MB | 98.2 MB |
| Events in quadrant A | 3,333,372 | 671,728 |
| Events in quadrant B | 3,406,820 | 685,625 |
| Events in quadrant C | 4,499,797 | 645,847 |
| Events in quadrant D | 3,211,578 | 634,736 |
| Mode SS | |||
|---|---|---|---|
| Quadrant | BADHDUFLAG | Total packets | Discarded packets |
| A | 0 | 138 | 0 |
| B | 0 | 138 | 0 |
| C | 0 | 138 | 0 |
| D | 0 | 138 | 0 |
| Mode M9 | |||
|---|---|---|---|
| Quadrant | BADHDUFLAG | Total packets | Discarded packets |
| A | 0 | 17 | 0 |
| B | 0 | 18 | 0 |
| C | 0 | 18 | 0 |
| D | 0 | 18 | 0 |
| Mode M0 | |||
|---|---|---|---|
| Quadrant | BADHDUFLAG | Total packets | Discarded packets |
| A | 0 | 14302 | 2 |
| B | 0 | 14580 | 2 |
| C | 0 | 17981 | 2 |
| D | 0 | 14331 | 3 |
| Quadrant | Total seconds | Saturated seconds | Saturation percentage |
|---|---|---|---|
| A | 6888 | 42 | 0.609756% |
| B | 6888 | 51 | 0.740418% |
| C | 6888 | 199 | 2.889082% |
| D | 6887 | 28 | 0.406563% |
Noise dominated data is calculated using 1-second bins in cleaned event files. If a bin has >2000 counts, and if more than 50% of those come from <1% of pixels, then it is considered to be noise-dominated and hence unusable.
| Quadrant | # 1 sec bins | Bins with >0 counts | Bins with >2000 counts | High rate bins dominated by noise | Noise dominated (total time) | Noise dominated (detector-on time) | Marked lightcurve |
|---|---|---|---|---|---|---|---|
| A | 7923 | 6889 | 1 | 1 | 0.01% | 0.01% | 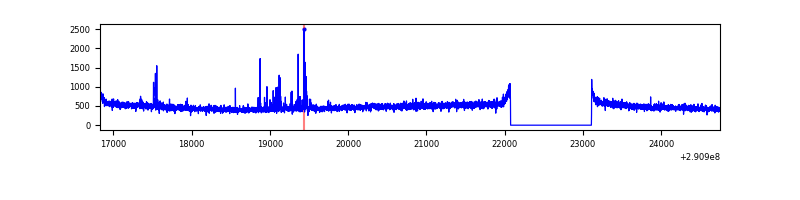 |
| B | 7923 | 6889 | 1 | 1 | 0.01% | 0.01% | 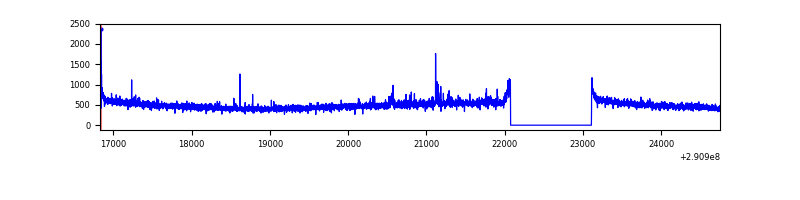 |
| C | 7923 | 6889 | 42 | 42 | 0.53% | 0.61% | 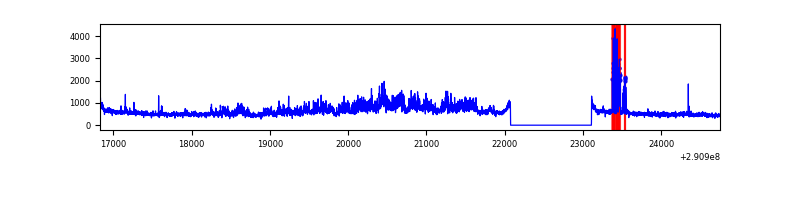 |
| D | 7922 | 6888 | 2 | 2 | 0.03% | 0.03% | 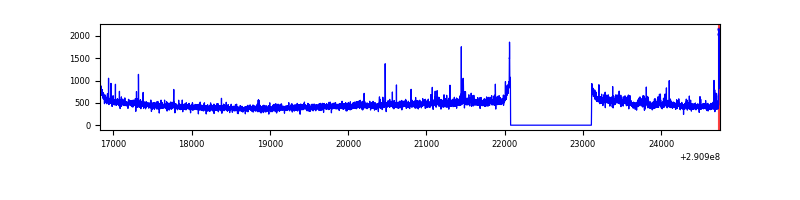 |
Top three noisy pixels from each quadrant. If the there are fewer than three noisy pixels in the level2.evt file, extra rows are filled as -1
| Pixel properties | Quadrant properties | ||||||
|---|---|---|---|---|---|---|---|
| Quadrant | DetID | PixID | Counts | Sigma | Mean | Median | Sigma |
| A | 4 | 2 | 66405 | 384.64 | 845 | 827 | 170.5 |
| A | 13 | 254 | 11705 | 63.8 | 845 | 827 | 170.5 |
| A | 0 | 226 | 7351 | 38.27 | 845 | 827 | 170.5 |
| B | 4 | 216 | 20932 | 123.5 | 851 | 831 | 162.8 |
| B | 12 | 111 | 18819 | 110.52 | 851 | 831 | 162.8 |
| B | 0 | 229 | 18004 | 105.51 | 851 | 831 | 162.8 |
| C | 3 | 233 | 1043669 | 5540.78 | 807 | 815 | 188.2 |
| C | 9 | 54 | 181800 | 961.59 | 807 | 815 | 188.2 |
| C | 14 | 238 | 126066 | 665.47 | 807 | 815 | 188.2 |
| D | 7 | 223 | 59599 | 294.61 | 815 | 791 | 199.6 |
| D | 2 | 234 | 28730 | 139.97 | 815 | 791 | 199.6 |
| D | 12 | 110 | 28407 | 138.35 | 815 | 791 | 199.6 |
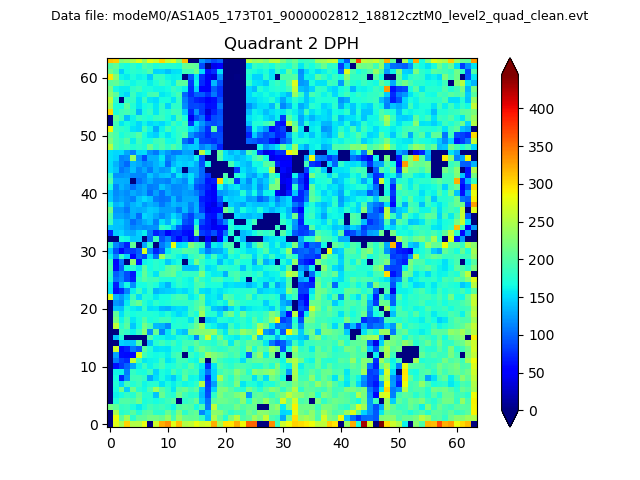
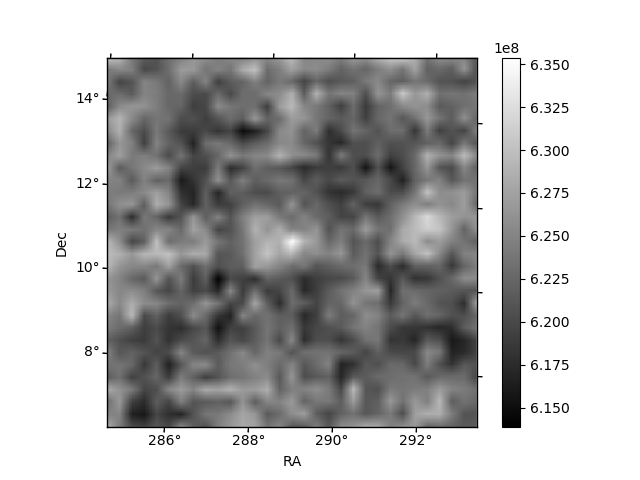
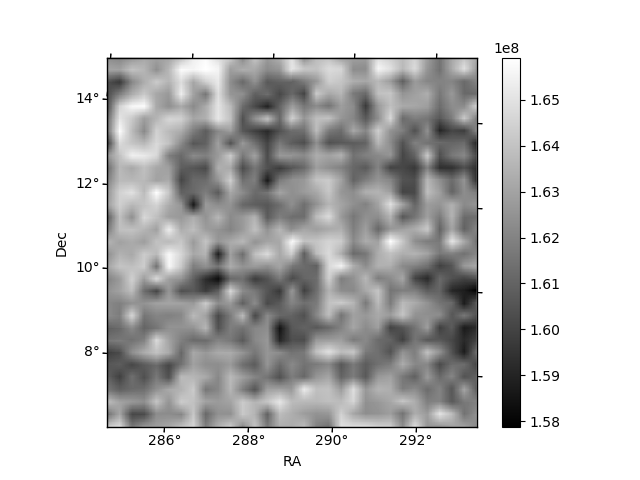
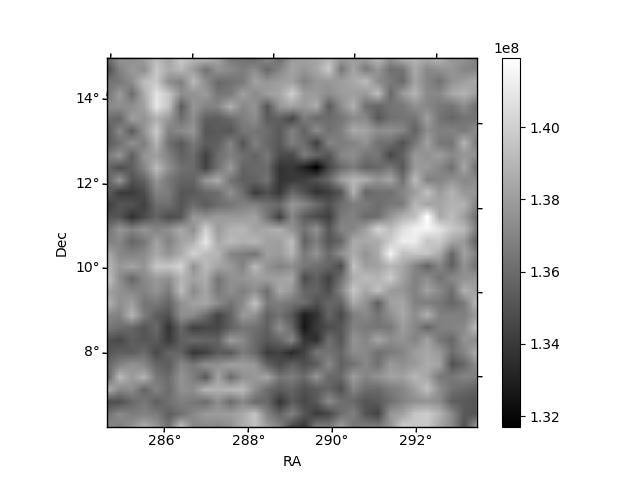
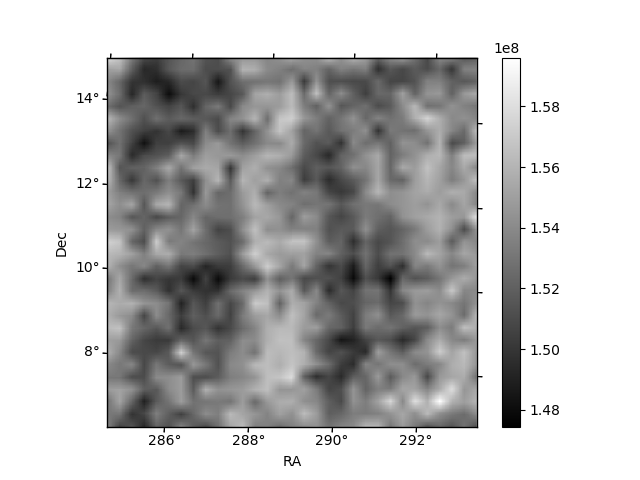
Histogram calculated using DETX and DETY for each event in the final _common_clean file
| Quadrant A | 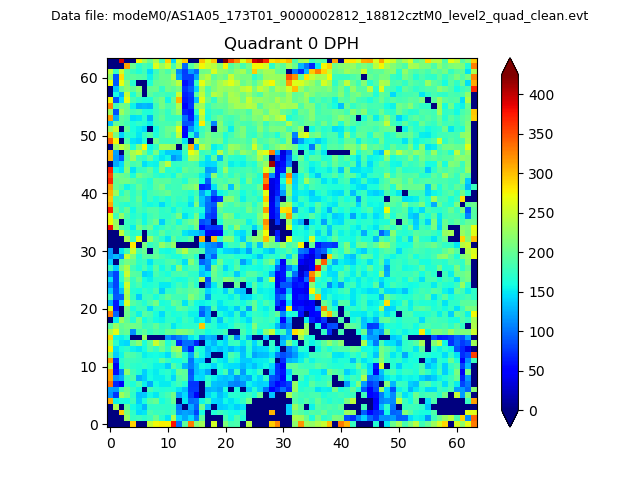 |
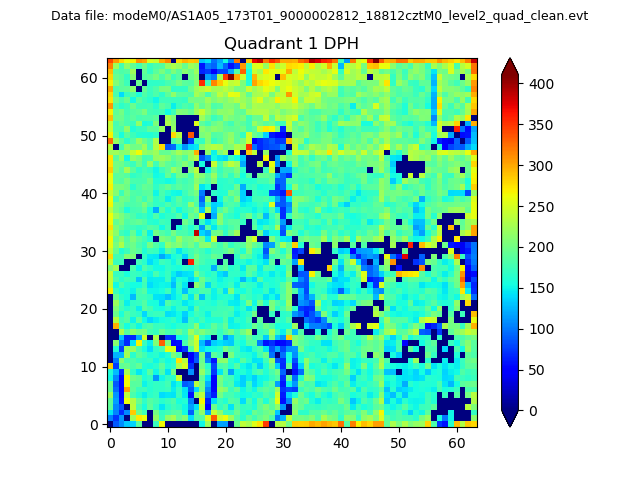 |
Quadrant B |
|---|---|---|---|
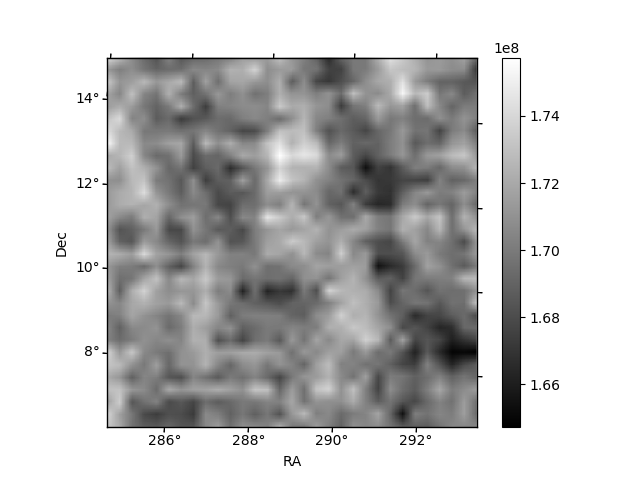
| Quadrant D | 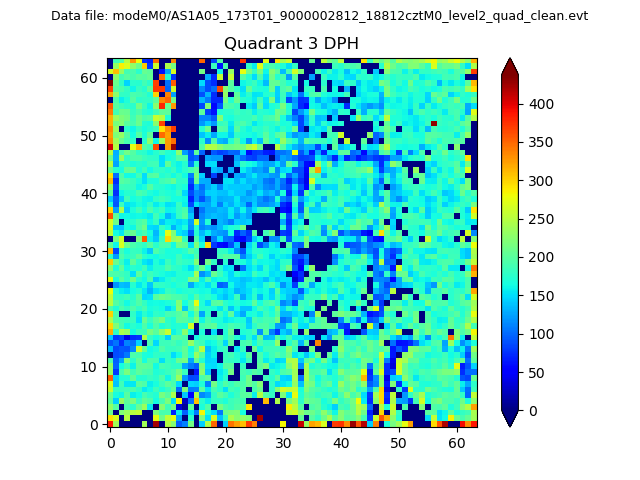 |
 |
Quadrant C |
| Plot type | Count rate plots | Images |
|---|---|---|
| Comparison with Poisson distribution Blue bars denote a histogram of data divided into 1 sec bins. Red curve is a Poisson curve with rate = median count rate of data. |
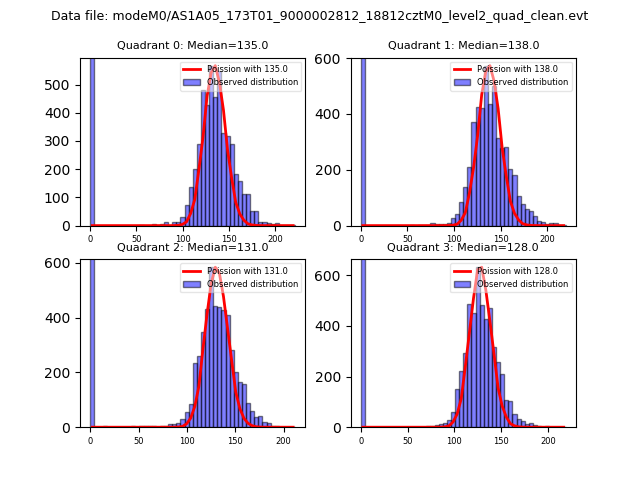 |
 |
| Quadrant-wise count rates Data is divided into 100 sec bins |
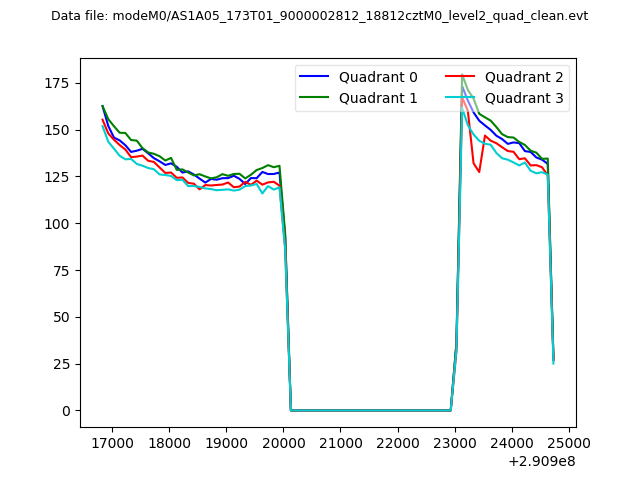 |
|
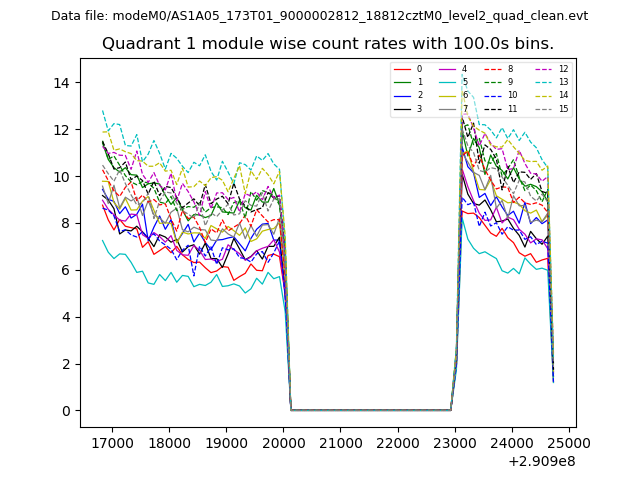
| Module-wise count rates for Quadrant A Data is divided into 100 sec bins |
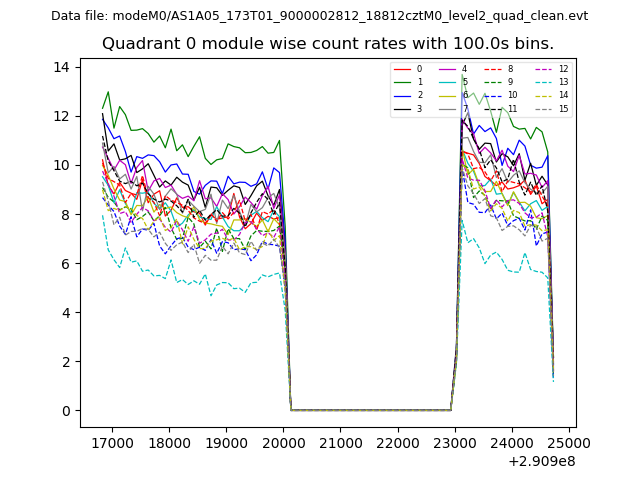 |
 |
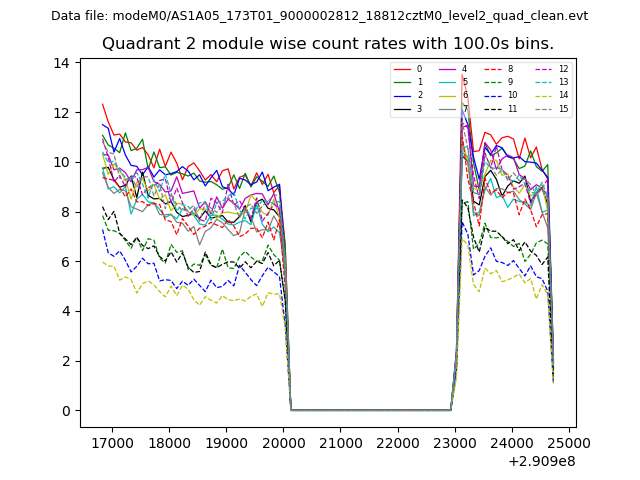
| Module-wise count rates for Quadrant B Data is divided into 100 sec bins |
 |
 |
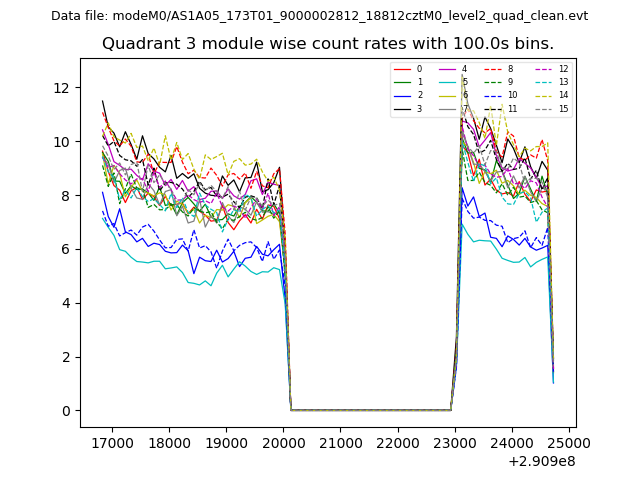
| Module-wise count rates for Quadrant C Data is divided into 100 sec bins |
 |
 |
| Module-wise count rates for Quadrant D Data is divided into 100 sec bins |
 |
 |
| Parameter | Plot |
|---|---|
| CZT HV Monitor | 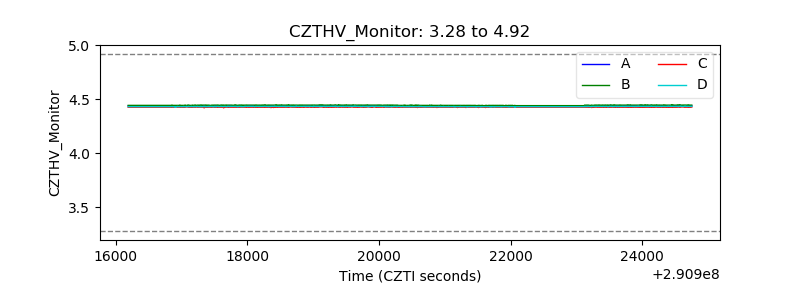 |
| D_VDD | 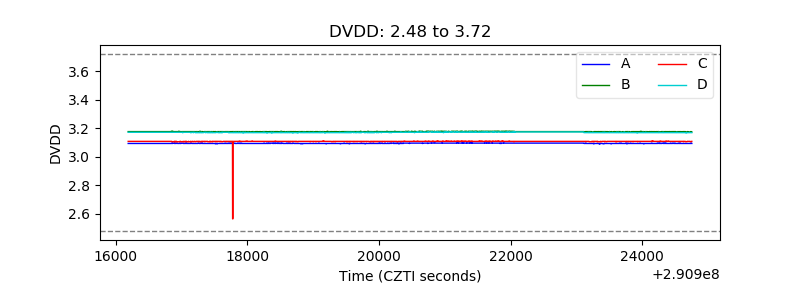 |
| Temperature 1 | 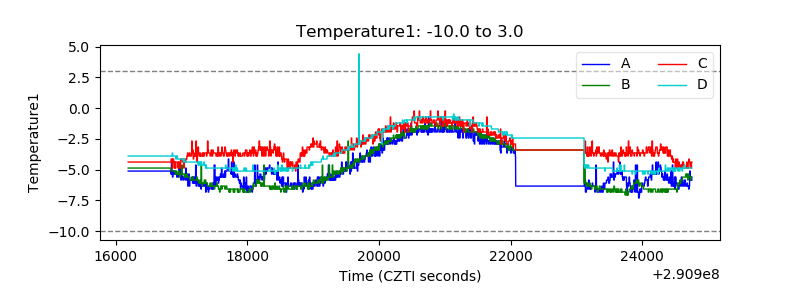 |
| Veto HV Monitor | 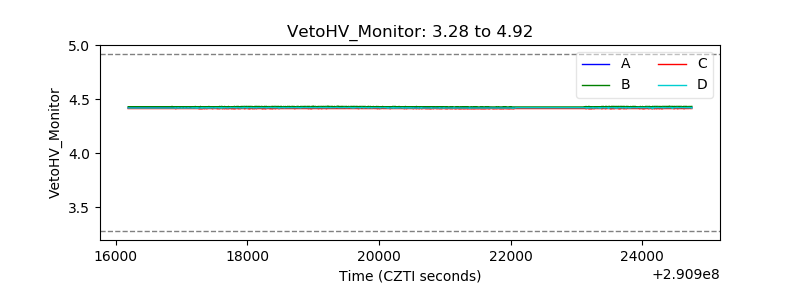 |
| Veto LLD | 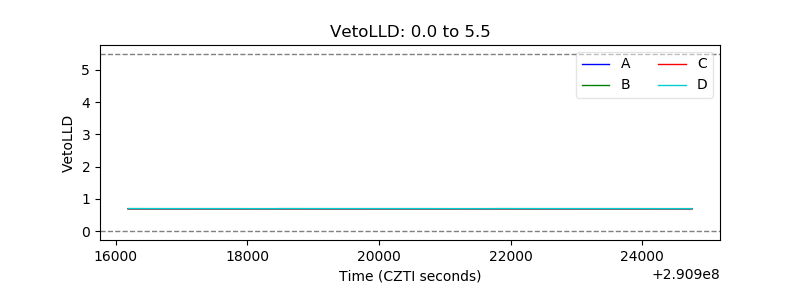 |
| Alpha Counter | 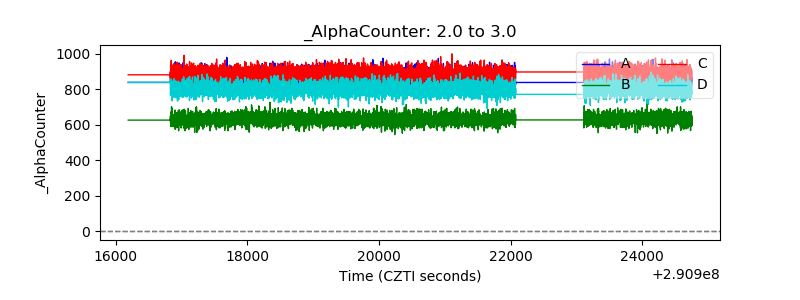 |
| _CPM_Rate | 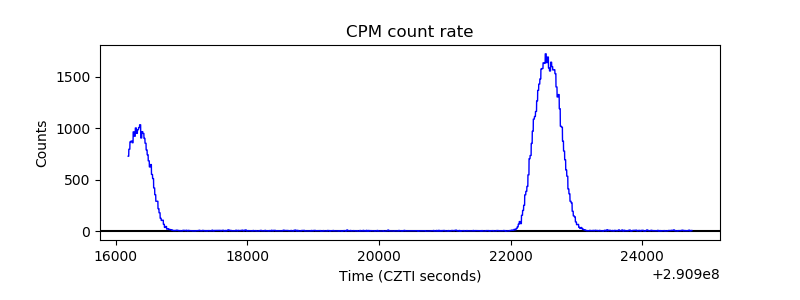 |
| CZT Counter | 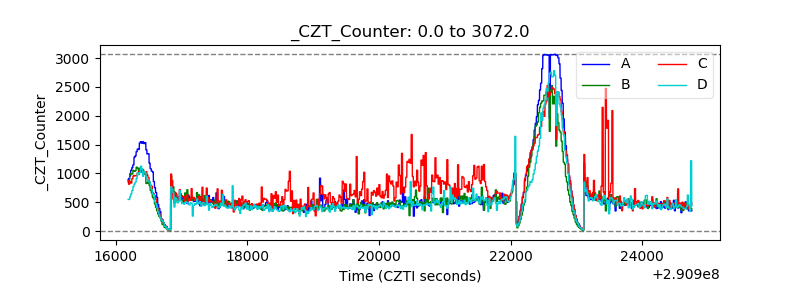 |
| +2.5 Volts monitor |  |
| +5 Volts monitor | 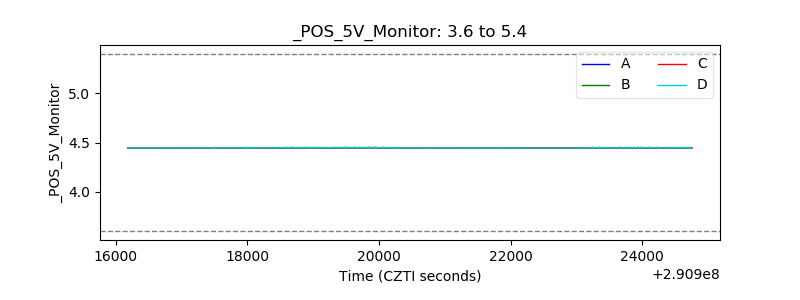 |
| _ROLL_ROT | 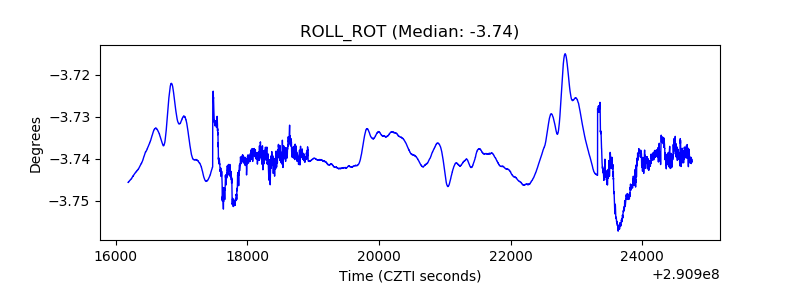 |
| _Roll_DEC | 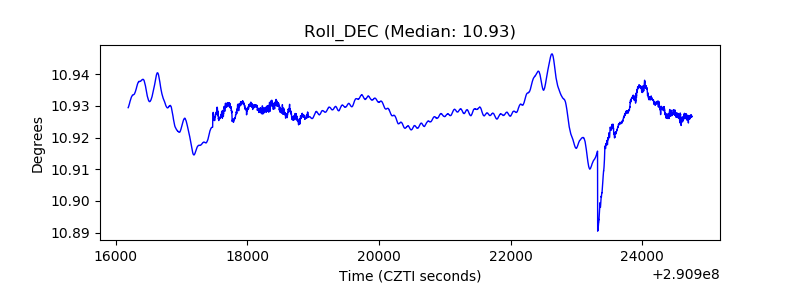 |
| _Roll_RA | 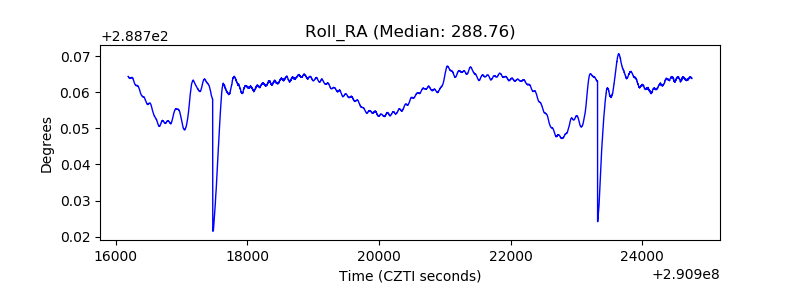 |
| Veto Counter | 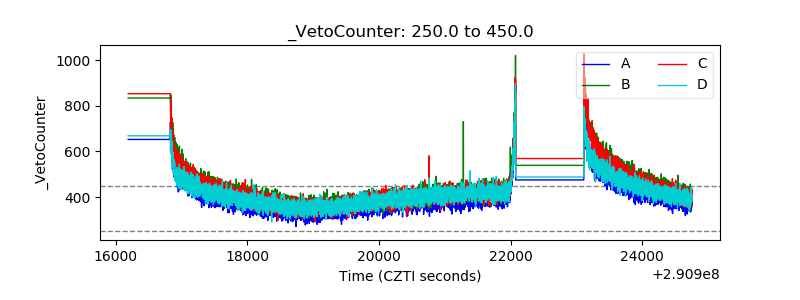 |