| Param | Original file | Final file |
|---|---|---|
| Filename | modeM0/AS1A05_173T01_9000002812_18814cztM0_level2.evt | modeM0/AS1A05_173T01_9000002812_18814cztM0_level2_quad_clean.evt |
| Size (bytes) | 465,978,240 | 97,790,400 |
| Size | 444.4 MB | 93.3 MB |
| Events in quadrant A | 3,237,098 | 639,171 |
| Events in quadrant B | 3,353,368 | 653,994 |
| Events in quadrant C | 3,543,603 | 611,460 |
| Events in quadrant D | 3,527,753 | 594,817 |
| Mode SS | |||
|---|---|---|---|
| Quadrant | BADHDUFLAG | Total packets | Discarded packets |
| A | 0 | 136 | 0 |
| B | 0 | 136 | 0 |
| C | 0 | 136 | 0 |
| D | 0 | 136 | 0 |
| Mode M9 | |||
|---|---|---|---|
| Quadrant | BADHDUFLAG | Total packets | Discarded packets |
| A | 0 | 11 | 0 |
| B | 0 | 11 | 0 |
| C | 0 | 11 | 0 |
| D | 0 | 11 | 0 |
| Mode M0 | |||
|---|---|---|---|
| Quadrant | BADHDUFLAG | Total packets | Discarded packets |
| A | 0 | 13703 | 1 |
| B | 0 | 14031 | 1 |
| C | 0 | 14624 | 1 |
| D | 0 | 14760 | 1 |
| Quadrant | Total seconds | Saturated seconds | Saturation percentage |
|---|---|---|---|
| A | 6623 | 16 | 0.241582% |
| B | 6624 | 23 | 0.347222% |
| C | 6624 | 118 | 1.781401% |
| D | 6624 | 75 | 1.132246% |
Noise dominated data is calculated using 1-second bins in cleaned event files. If a bin has >2000 counts, and if more than 50% of those come from <1% of pixels, then it is considered to be noise-dominated and hence unusable.
| Quadrant | # 1 sec bins | Bins with >0 counts | Bins with >2000 counts | High rate bins dominated by noise | Noise dominated (total time) | Noise dominated (detector-on time) | Marked lightcurve |
|---|---|---|---|---|---|---|---|
| A | 7798 | 6624 | 0 | 0 | 0.00% | 0.00% | 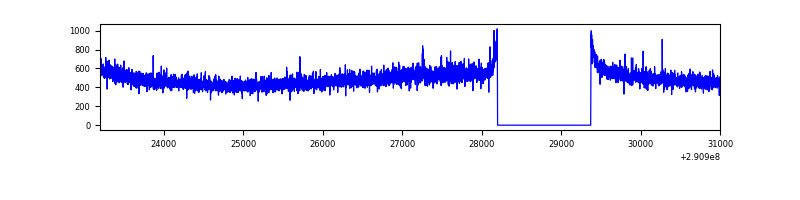 |
| B | 7799 | 6625 | 2 | 2 | 0.03% | 0.03% | 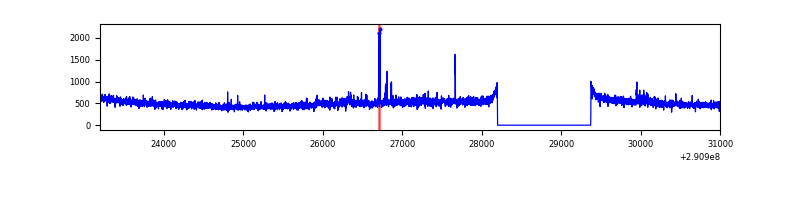 |
| C | 7799 | 6625 | 42 | 42 | 0.54% | 0.63% | 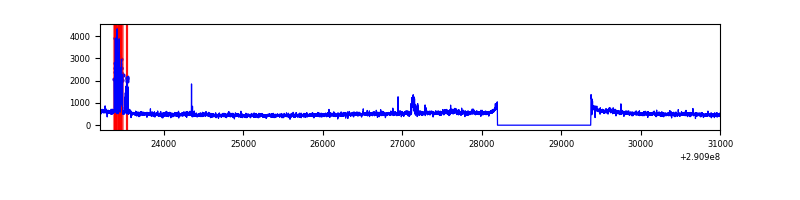 |
| D | 7799 | 6625 | 79 | 79 | 1.01% | 1.19% | 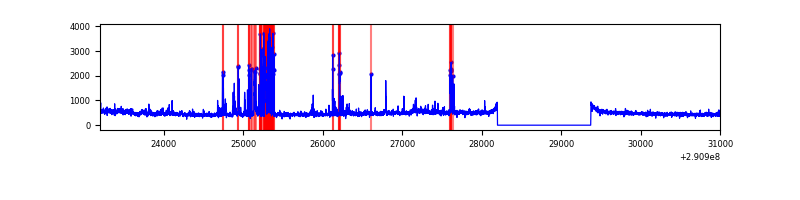 |
Top three noisy pixels from each quadrant. If the there are fewer than three noisy pixels in the level2.evt file, extra rows are filled as -1
| Pixel properties | Quadrant properties | ||||||
|---|---|---|---|---|---|---|---|
| Quadrant | DetID | PixID | Counts | Sigma | Mean | Median | Sigma |
| A | 14 | 4 | 27078 | 156.18 | 831 | 815 | 168.2 |
| A | 13 | 254 | 11195 | 61.73 | 831 | 815 | 168.2 |
| A | 0 | 226 | 7301 | 38.57 | 831 | 815 | 168.2 |
| B | 4 | 216 | 18950 | 114.72 | 834 | 816 | 158.1 |
| B | 12 | 111 | 17987 | 108.63 | 834 | 816 | 158.1 |
| B | 0 | 198 | 15685 | 94.07 | 834 | 816 | 158.1 |
| C | 3 | 233 | 175750 | 950.85 | 790 | 797 | 184.0 |
| C | 9 | 54 | 161890 | 875.52 | 790 | 797 | 184.0 |
| C | 14 | 238 | 125106 | 675.61 | 790 | 797 | 184.0 |
| D | 12 | 110 | 372057 | 1893.41 | 797 | 773 | 196.1 |
| D | 7 | 223 | 70325 | 354.69 | 797 | 773 | 196.1 |
| D | 7 | 38 | 55723 | 280.22 | 797 | 773 | 196.1 |
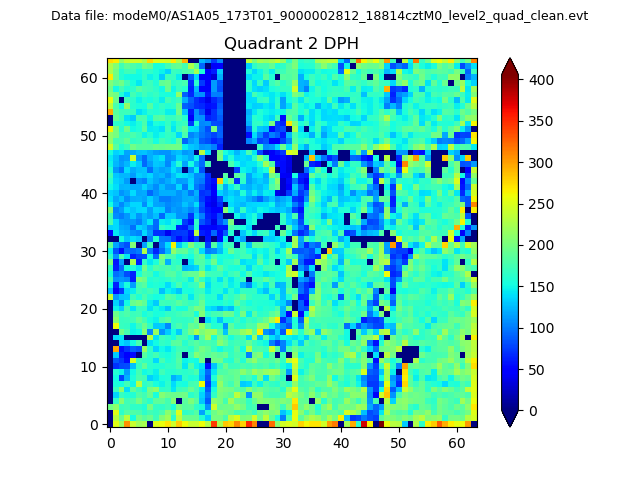
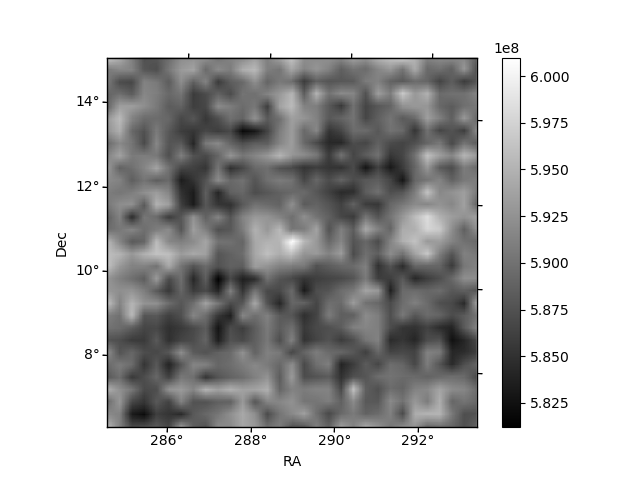
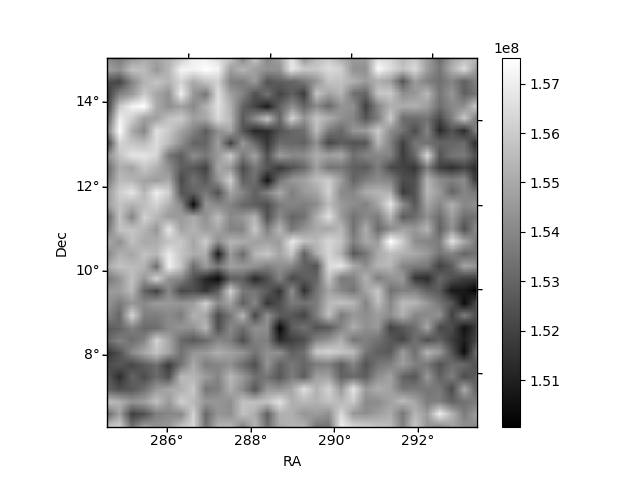
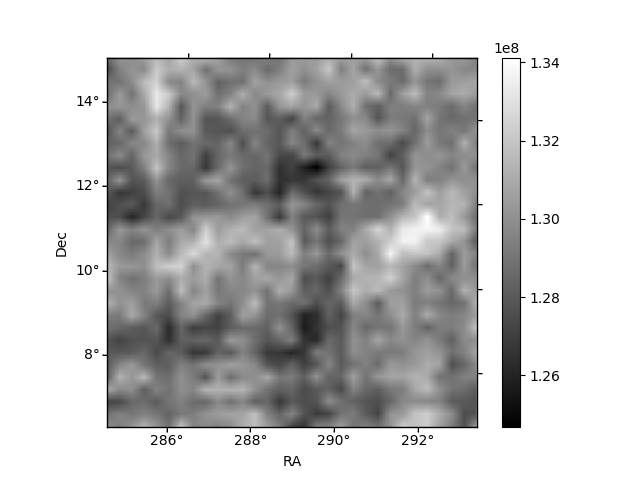
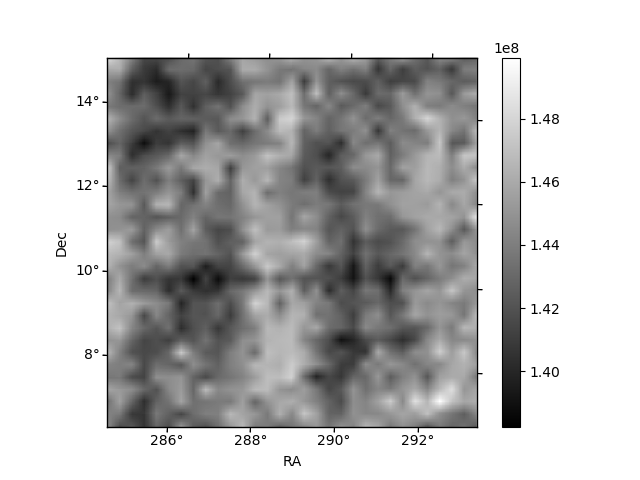
Histogram calculated using DETX and DETY for each event in the final _common_clean file
| Quadrant A | 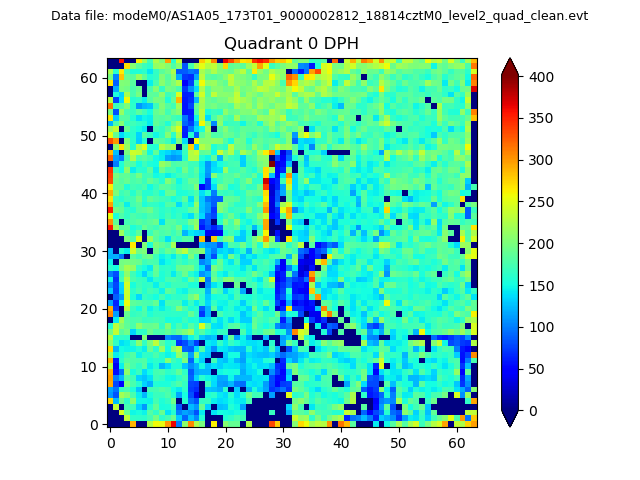 |
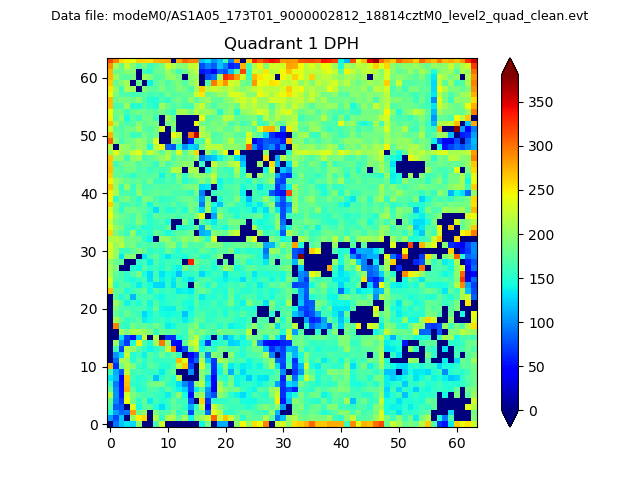 |
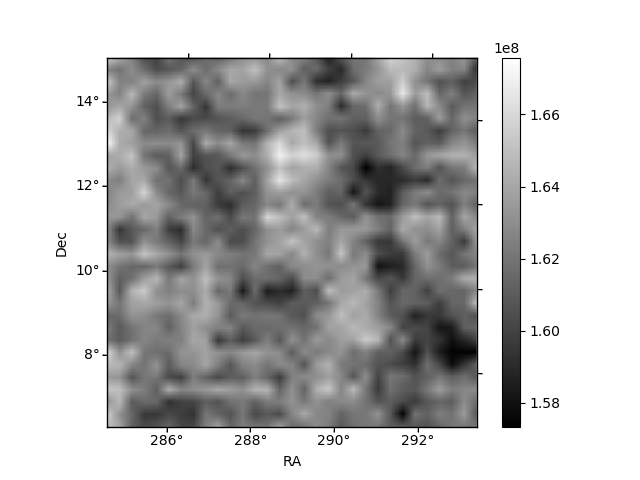
Quadrant B |
|---|---|---|---|
| Quadrant D | 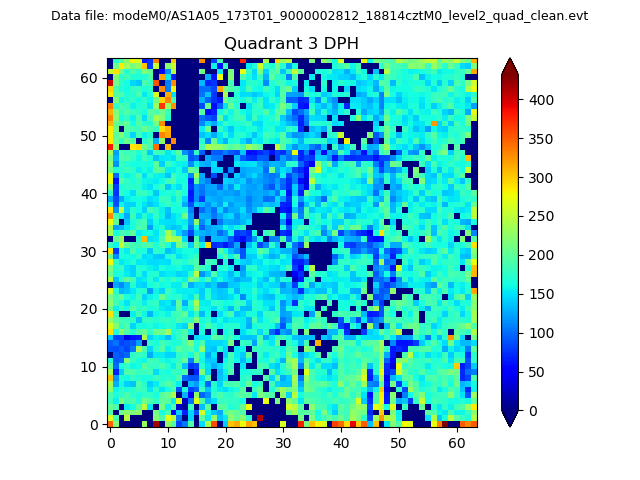 |
 |
Quadrant C |
| Plot type | Count rate plots | Images |
|---|---|---|
| Comparison with Poisson distribution Blue bars denote a histogram of data divided into 1 sec bins. Red curve is a Poisson curve with rate = median count rate of data. |
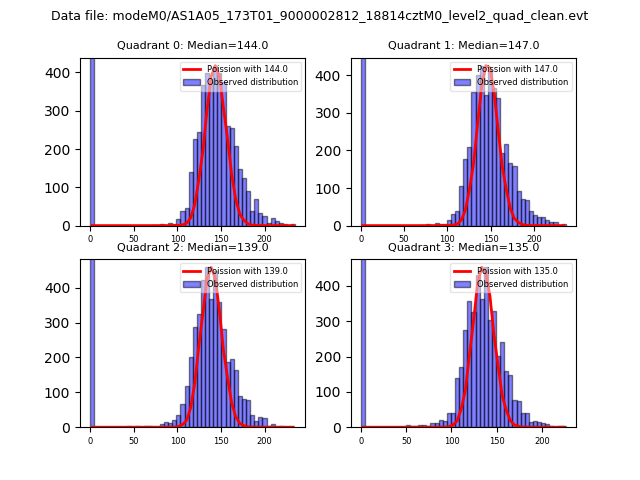 |
 |
| Quadrant-wise count rates Data is divided into 100 sec bins |
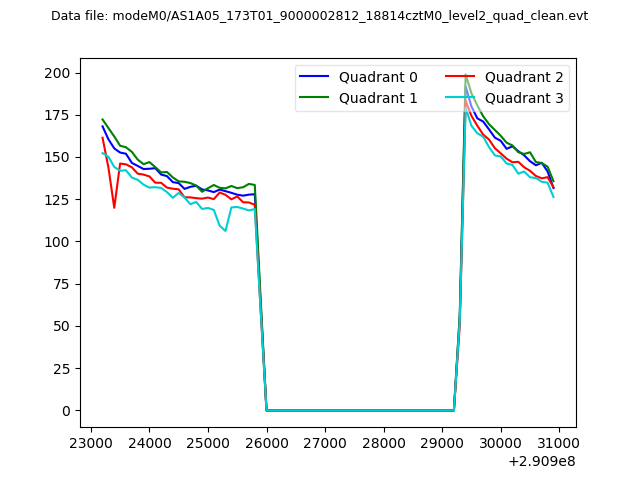 |
|
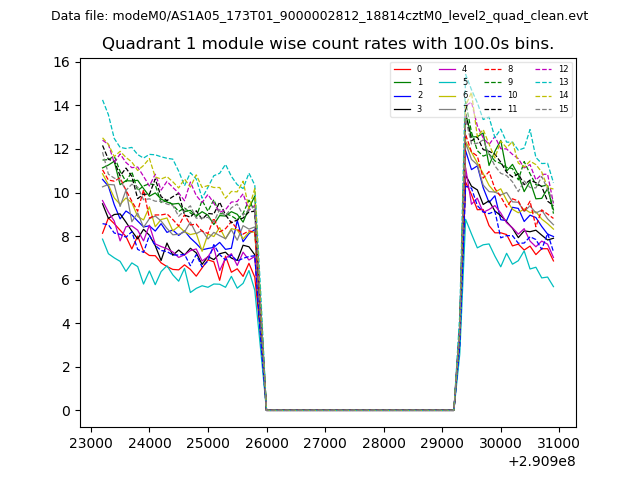
| Module-wise count rates for Quadrant A Data is divided into 100 sec bins |
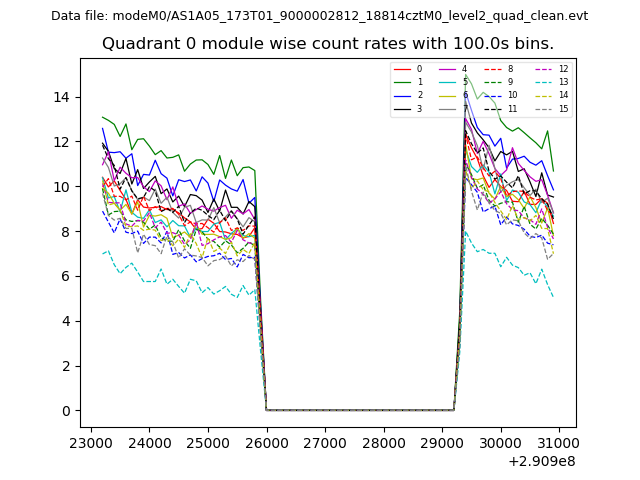 |
 |
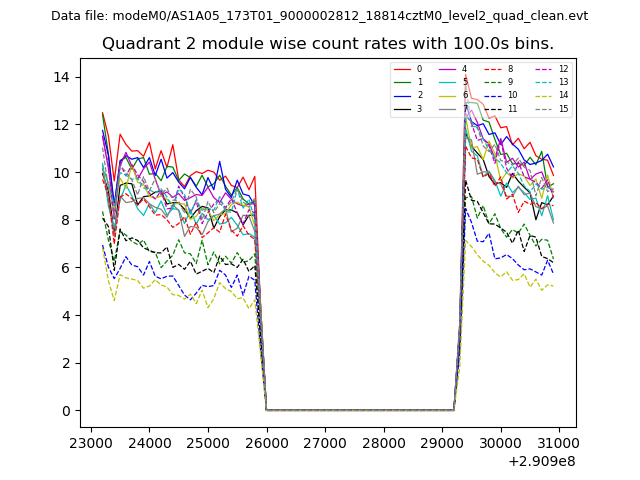
| Module-wise count rates for Quadrant B Data is divided into 100 sec bins |
 |
 |
| Module-wise count rates for Quadrant C Data is divided into 100 sec bins |
 |
 |
| Module-wise count rates for Quadrant D Data is divided into 100 sec bins |
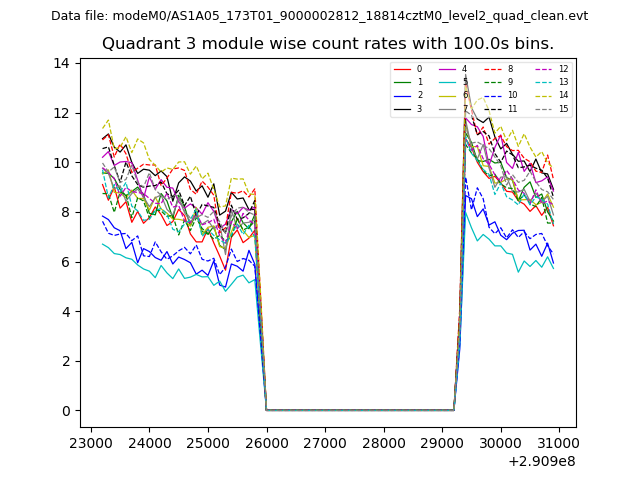 |
 |
| Parameter | Plot |
|---|---|
| CZT HV Monitor | 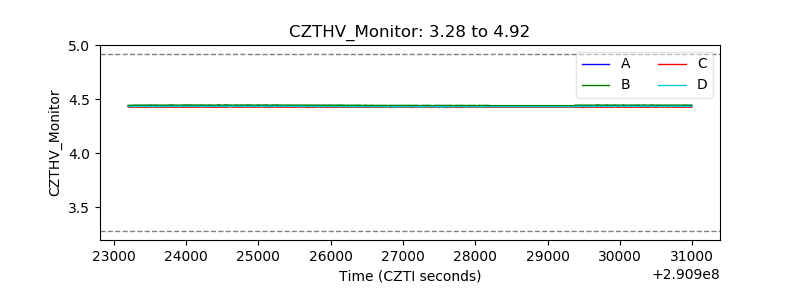 |
| D_VDD | 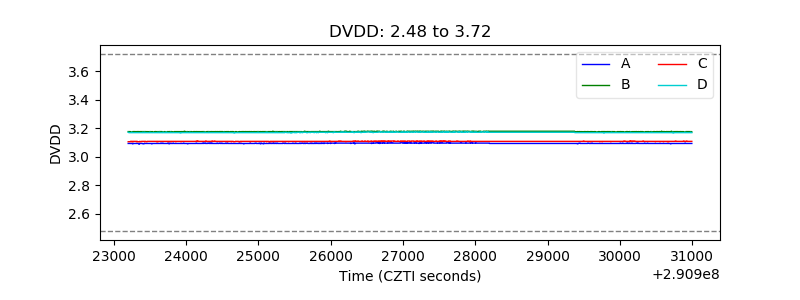 |
| Temperature 1 | 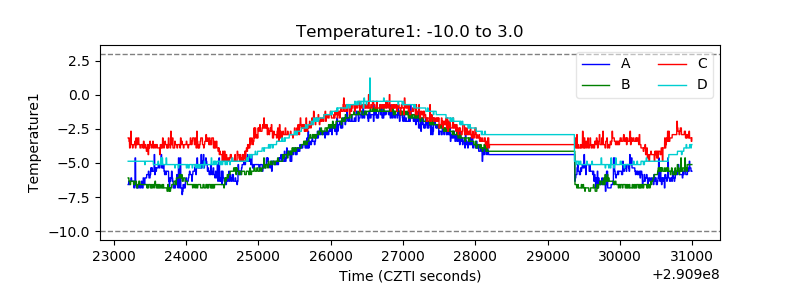 |
| Veto HV Monitor | 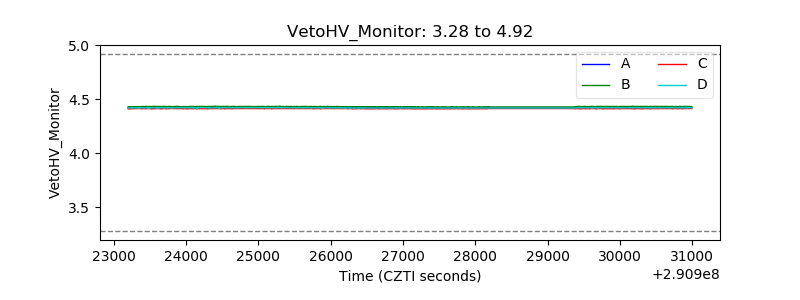 |
| Veto LLD | 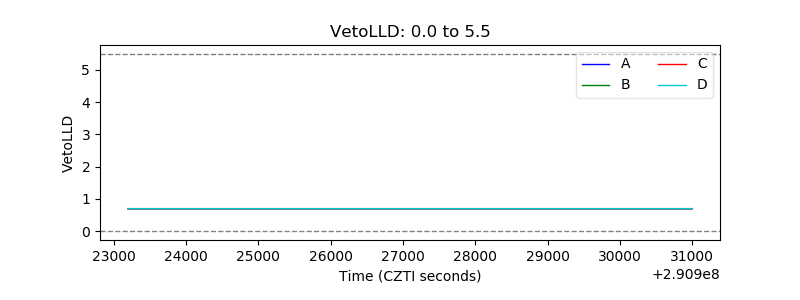 |
| Alpha Counter |  |
| _CPM_Rate |  |
| CZT Counter | 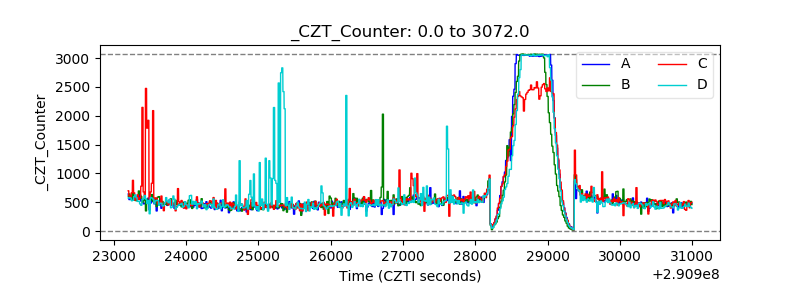 |
| +2.5 Volts monitor |  |
| +5 Volts monitor |  |
| _ROLL_ROT | 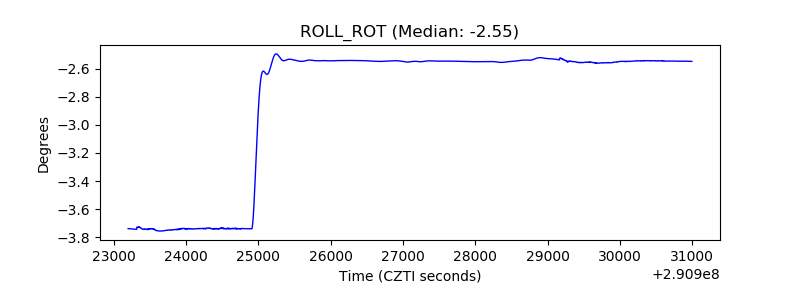 |
| _Roll_DEC | 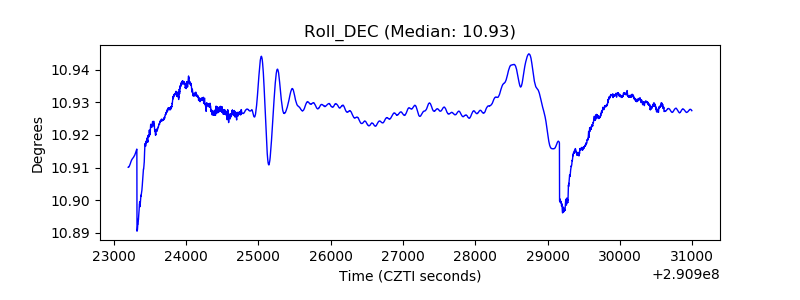 |
| _Roll_RA | 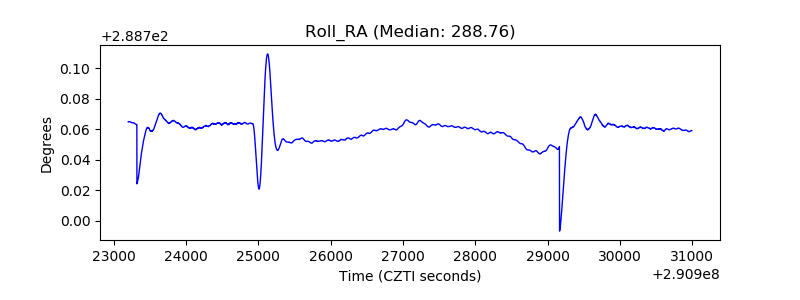 |
| Veto Counter | 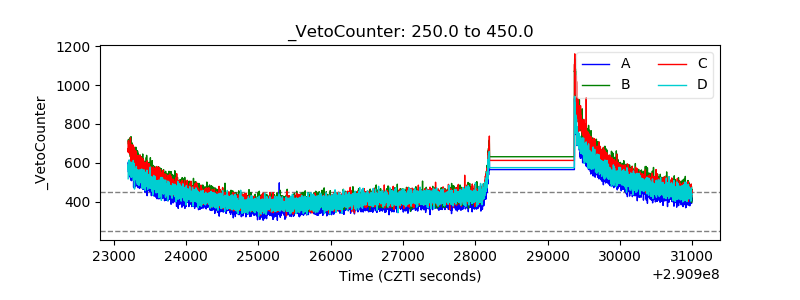 |