| Param | Original file | Final file |
|---|---|---|
| Filename | modeM0/AS1A05_173T01_9000002812_18815cztM0_level2.evt | modeM0/AS1A05_173T01_9000002812_18815cztM0_level2_quad_clean.evt |
| Size (bytes) | 431,326,080 | 89,251,200 |
| Size | 411.3 MB | 85.1 MB |
| Events in quadrant A | 3,030,425 | 582,640 |
| Events in quadrant B | 3,236,099 | 593,370 |
| Events in quadrant C | 3,186,182 | 558,928 |
| Events in quadrant D | 3,200,862 | 547,314 |
| Mode SS | |||
|---|---|---|---|
| Quadrant | BADHDUFLAG | Total packets | Discarded packets |
| A | 0 | 122 | 0 |
| B | 0 | 122 | 0 |
| C | 0 | 122 | 0 |
| D | 0 | 122 | 0 |
| Mode M9 | |||
|---|---|---|---|
| Quadrant | BADHDUFLAG | Total packets | Discarded packets |
| A | 0 | 13 | 0 |
| B | 0 | 13 | 0 |
| C | 0 | 13 | 0 |
| D | 0 | 13 | 0 |
| Mode M0 | |||
|---|---|---|---|
| Quadrant | BADHDUFLAG | Total packets | Discarded packets |
| A | 0 | 12498 | 1 |
| B | 0 | 13167 | 1 |
| C | 0 | 13043 | 1 |
| D | 0 | 13340 | 1 |
| Quadrant | Total seconds | Saturated seconds | Saturation percentage |
|---|---|---|---|
| A | 6021 | 24 | 0.398605% |
| B | 6022 | 50 | 0.830289% |
| C | 6022 | 50 | 0.830289% |
| D | 6022 | 47 | 0.780472% |
Noise dominated data is calculated using 1-second bins in cleaned event files. If a bin has >2000 counts, and if more than 50% of those come from <1% of pixels, then it is considered to be noise-dominated and hence unusable.
| Quadrant | # 1 sec bins | Bins with >0 counts | Bins with >2000 counts | High rate bins dominated by noise | Noise dominated (total time) | Noise dominated (detector-on time) | Marked lightcurve |
|---|---|---|---|---|---|---|---|
| A | 7281 | 6022 | 0 | 0 | 0.00% | 0.00% | 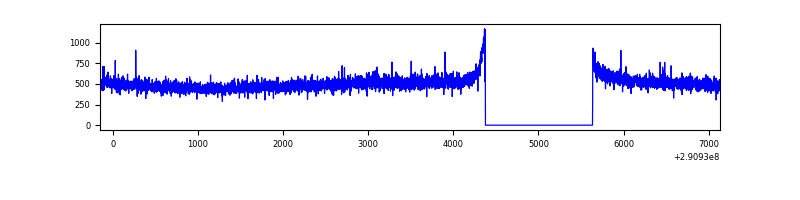 |
| B | 7282 | 6023 | 3 | 3 | 0.04% | 0.05% | 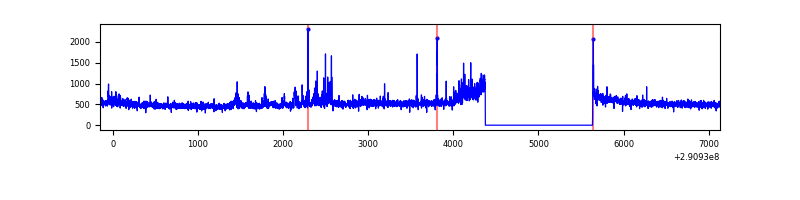 |
| C | 7282 | 6023 | 1 | 1 | 0.01% | 0.02% | 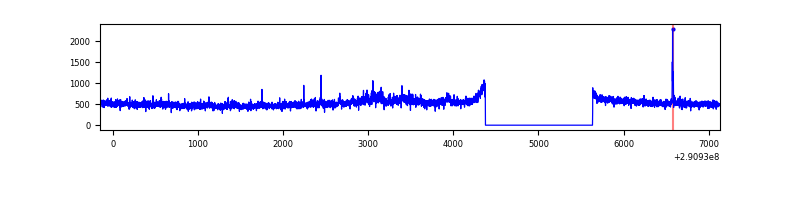 |
| D | 7282 | 6023 | 37 | 37 | 0.51% | 0.61% | 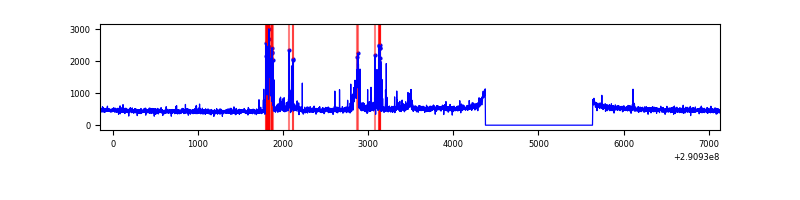 |
Top three noisy pixels from each quadrant. If the there are fewer than three noisy pixels in the level2.evt file, extra rows are filled as -1
| Pixel properties | Quadrant properties | ||||||
|---|---|---|---|---|---|---|---|
| Quadrant | DetID | PixID | Counts | Sigma | Mean | Median | Sigma |
| A | 13 | 254 | 9586 | 55.87 | 783 | 770 | 157.8 |
| A | 0 | 226 | 6842 | 38.48 | 783 | 770 | 157.8 |
| A | 11 | 29 | 6772 | 38.04 | 783 | 770 | 157.8 |
| B | 6 | 36 | 90349 | 606.52 | 778 | 762 | 147.7 |
| B | 10 | 247 | 17740 | 114.94 | 778 | 762 | 147.7 |
| B | 4 | 216 | 17129 | 110.81 | 778 | 762 | 147.7 |
| C | 3 | 233 | 168980 | 972.78 | 743 | 749 | 172.9 |
| C | 14 | 238 | 117611 | 675.75 | 743 | 749 | 172.9 |
| C | 13 | 61 | 5423 | 27.03 | 743 | 749 | 172.9 |
| D | 12 | 110 | 270986 | 1465.68 | 754 | 732 | 184.4 |
| D | 7 | 38 | 70136 | 376.4 | 754 | 732 | 184.4 |
| D | 2 | 234 | 24624 | 129.57 | 754 | 732 | 184.4 |
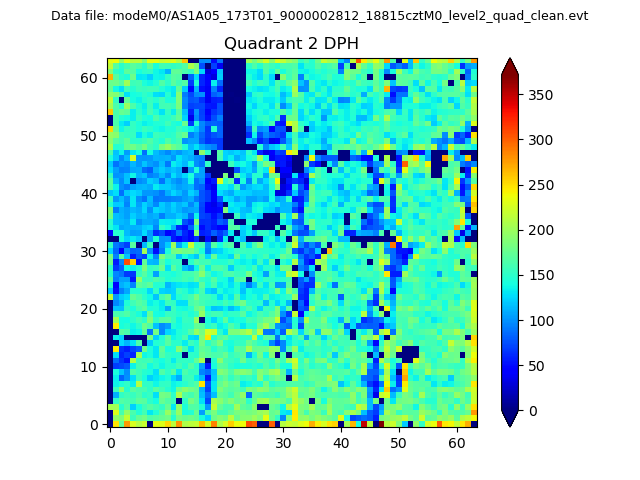
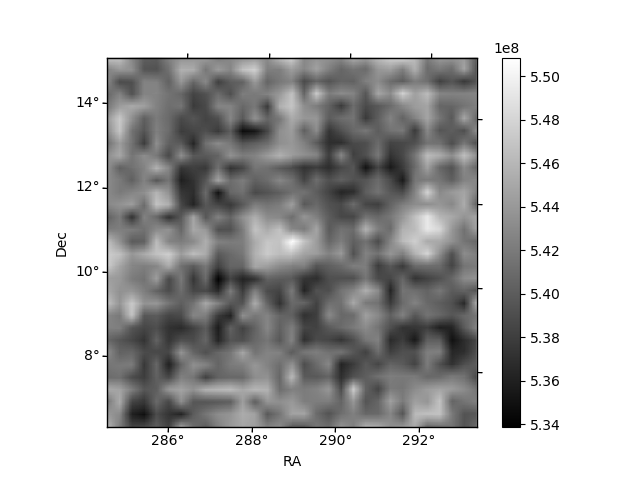
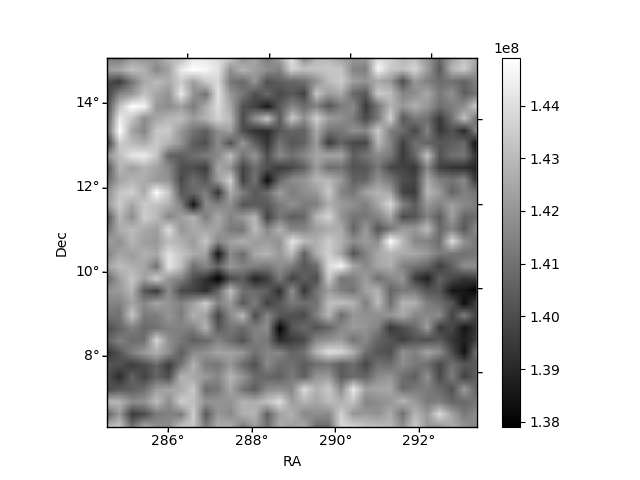
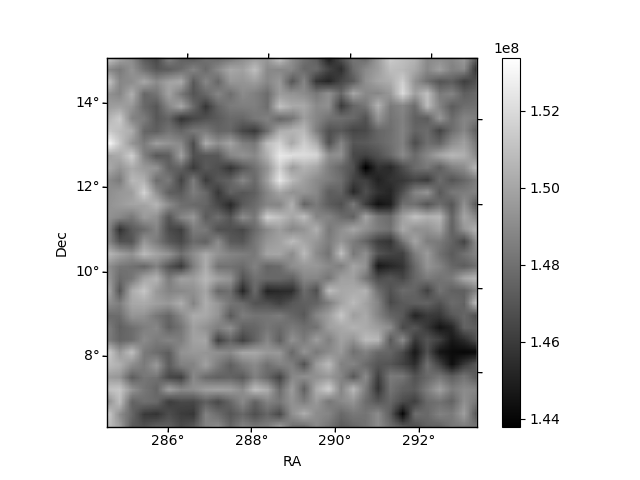
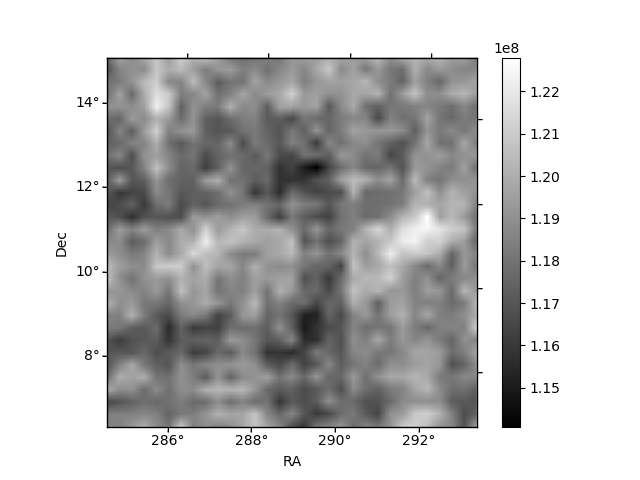
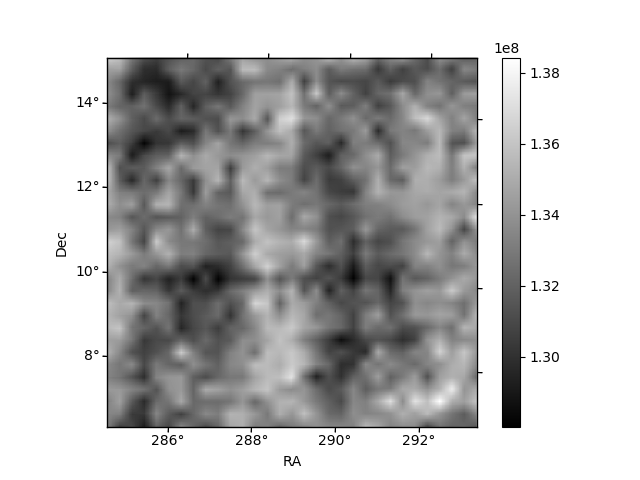
Histogram calculated using DETX and DETY for each event in the final _common_clean file
| Quadrant A | 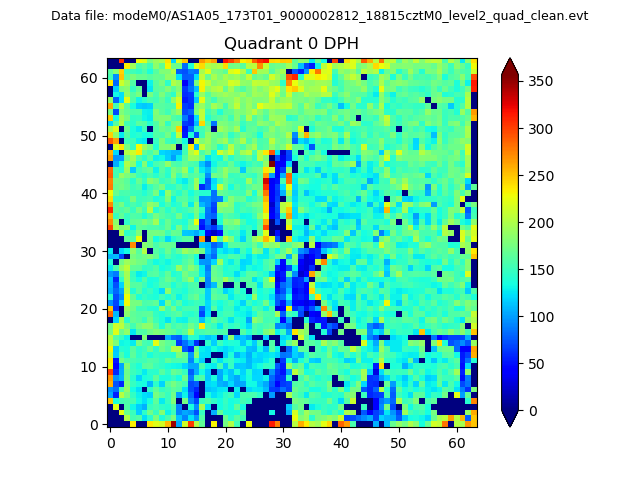 |
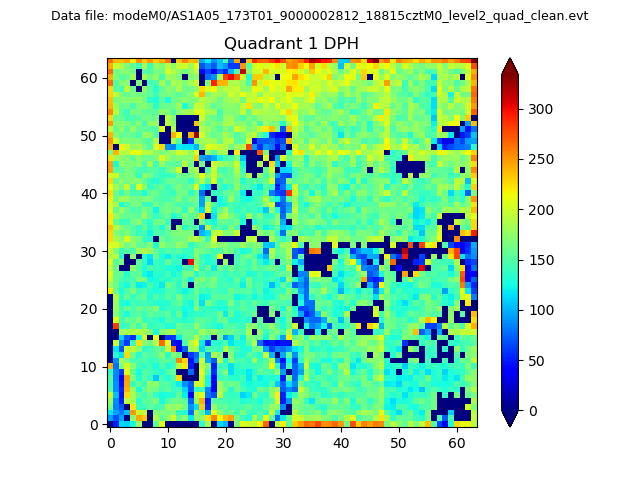 |
Quadrant B |
|---|---|---|---|
| Quadrant D | 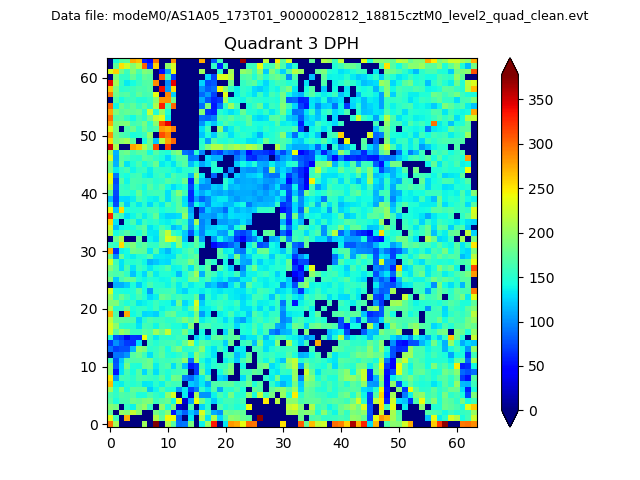 |
 |
Quadrant C |
| Plot type | Count rate plots | Images |
|---|---|---|
| Comparison with Poisson distribution Blue bars denote a histogram of data divided into 1 sec bins. Red curve is a Poisson curve with rate = median count rate of data. |
 |
 |
| Quadrant-wise count rates Data is divided into 100 sec bins |
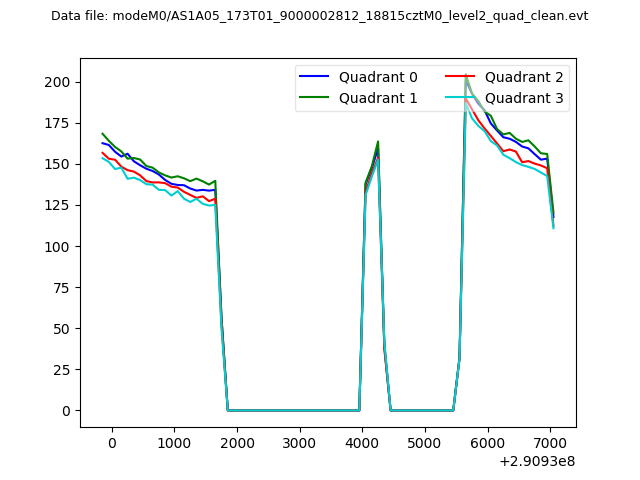 |
|
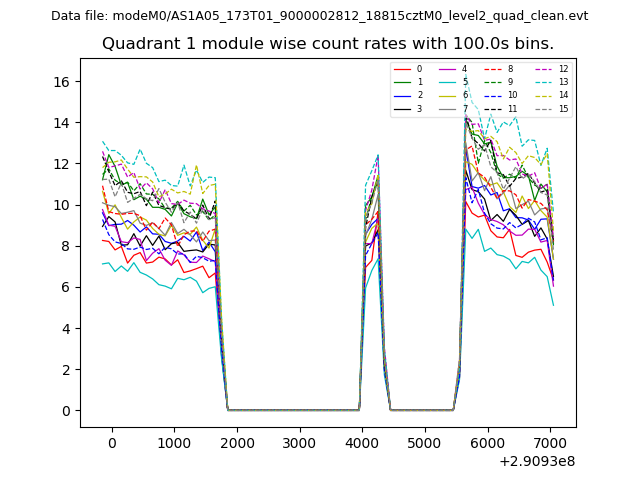
| Module-wise count rates for Quadrant A Data is divided into 100 sec bins |
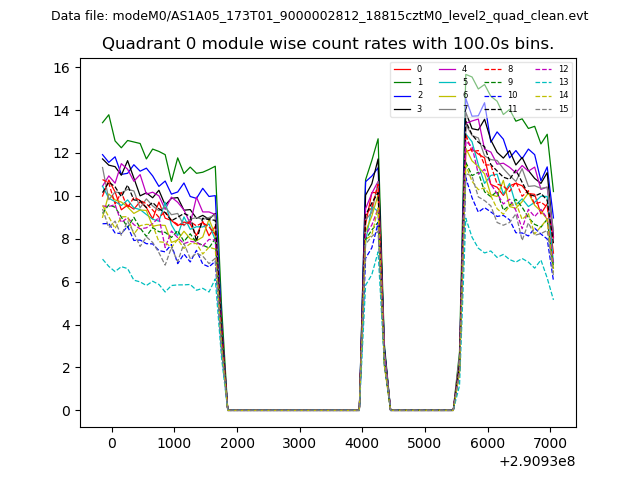 |
 |
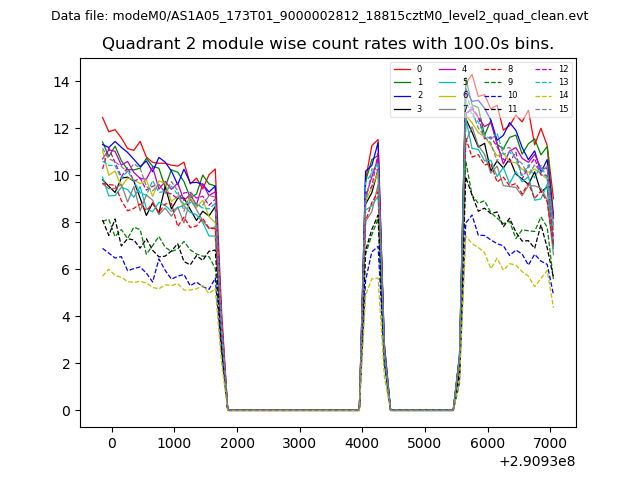
| Module-wise count rates for Quadrant B Data is divided into 100 sec bins |
 |
 |
| Module-wise count rates for Quadrant C Data is divided into 100 sec bins |
 |
 |
| Module-wise count rates for Quadrant D Data is divided into 100 sec bins |
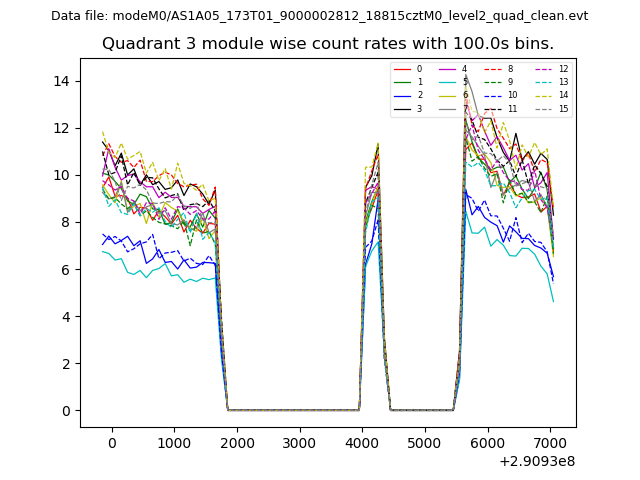 |
 |
| Parameter | Plot |
|---|---|
| CZT HV Monitor | 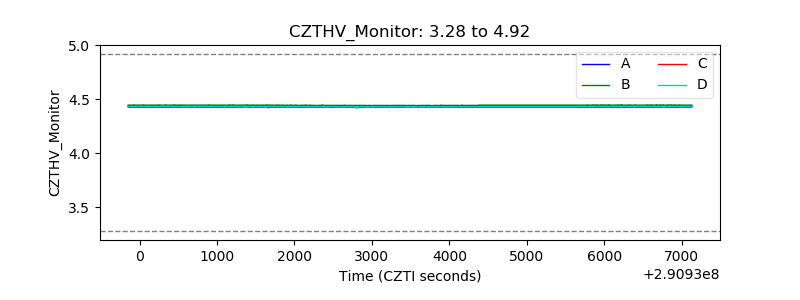 |
| D_VDD | 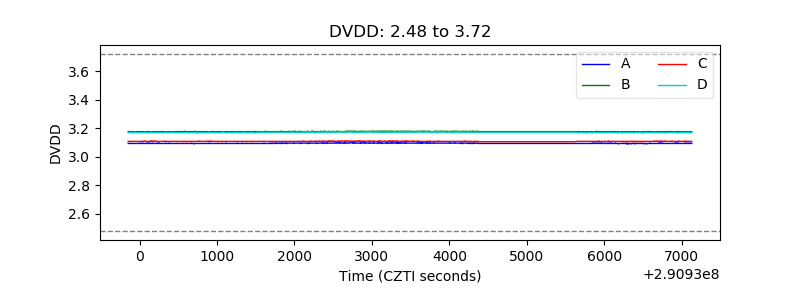 |
| Temperature 1 | 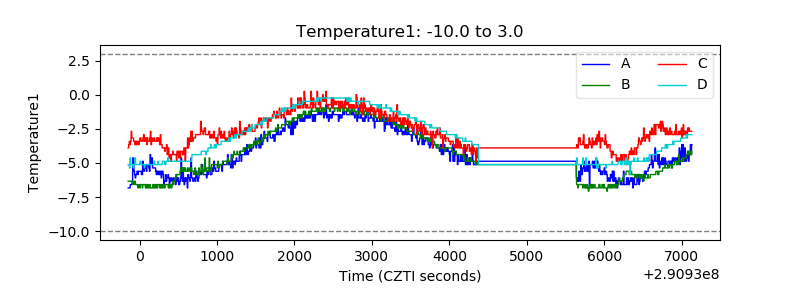 |
| Veto HV Monitor |  |
| Veto LLD | 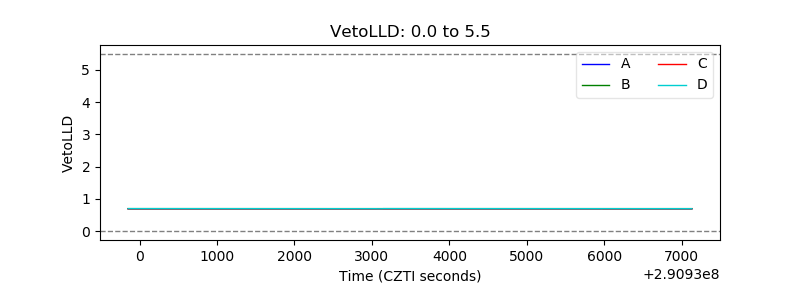 |
| Alpha Counter |  |
| _CPM_Rate | 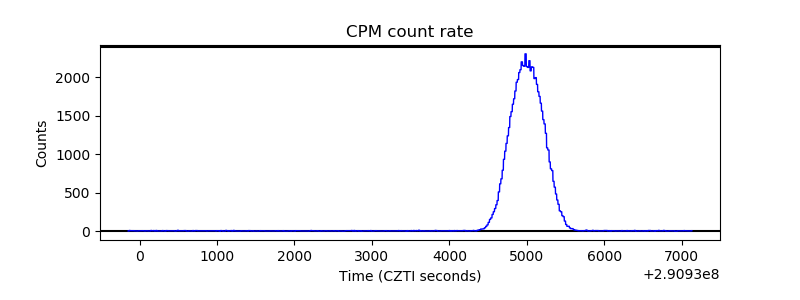 |
| CZT Counter | 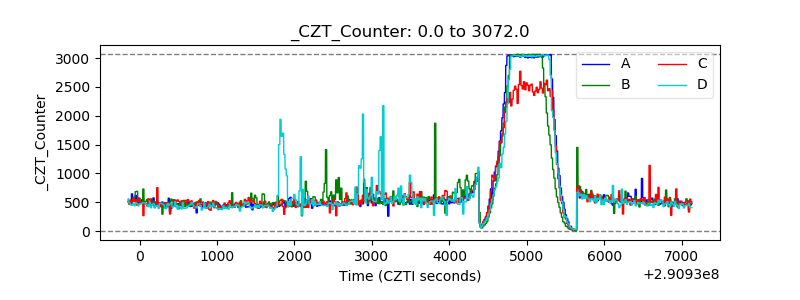 |
| +2.5 Volts monitor |  |
| +5 Volts monitor |  |
| _ROLL_ROT | 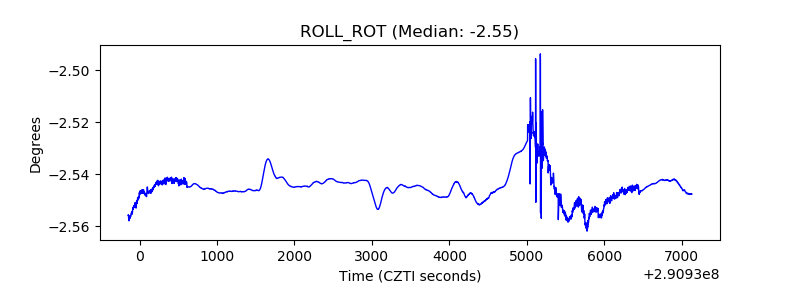 |
| _Roll_DEC | 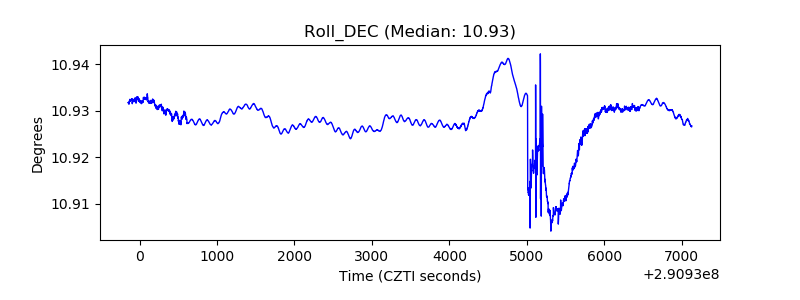 |
| _Roll_RA | 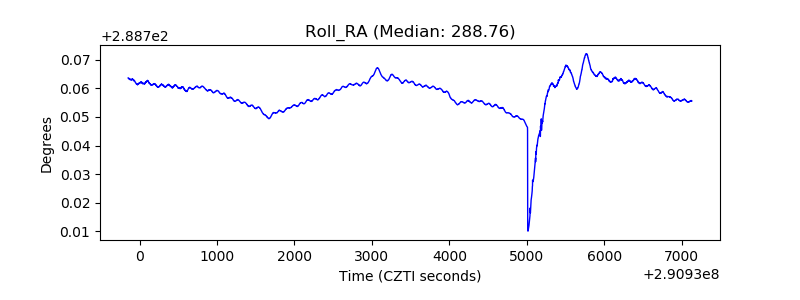 |
| Veto Counter | 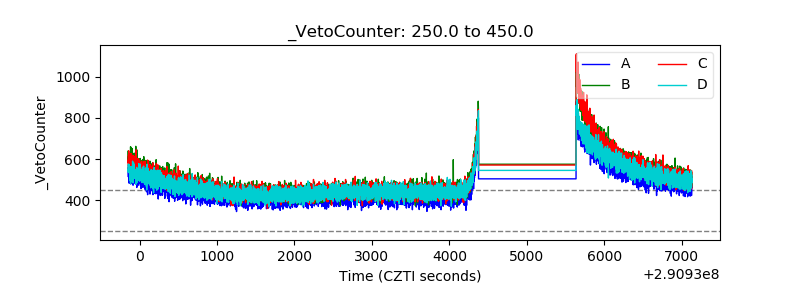 |