| Param | Original file | Final file |
|---|---|---|
| Filename | modeM0/AS1A05_173T01_9000002812_18817cztM0_level2.evt | modeM0/AS1A05_173T01_9000002812_18817cztM0_level2_quad_clean.evt |
| Size (bytes) | 438,099,840 | 85,547,520 |
| Size | 417.8 MB | 81.6 MB |
| Events in quadrant A | 3,142,662 | 560,001 |
| Events in quadrant B | 3,270,544 | 565,339 |
| Events in quadrant C | 3,409,540 | 534,649 |
| Events in quadrant D | 3,047,828 | 521,971 |
| Mode SS | |||
|---|---|---|---|
| Quadrant | BADHDUFLAG | Total packets | Discarded packets |
| A | 0 | 118 | 0 |
| B | 0 | 118 | 0 |
| C | 0 | 118 | 0 |
| D | 0 | 118 | 0 |
| Mode M9 | |||
|---|---|---|---|
| Quadrant | BADHDUFLAG | Total packets | Discarded packets |
| A | 0 | 13 | 0 |
| B | 0 | 13 | 0 |
| C | 0 | 13 | 0 |
| D | 0 | 13 | 0 |
| Mode M0 | |||
|---|---|---|---|
| Quadrant | BADHDUFLAG | Total packets | Discarded packets |
| A | 0 | 12542 | 1 |
| B | 0 | 13013 | 1 |
| C | 0 | 13620 | 1 |
| D | 0 | 12417 | 1 |
| Quadrant | Total seconds | Saturated seconds | Saturation percentage |
|---|---|---|---|
| A | 5851 | 113 | 1.931294% |
| B | 5852 | 114 | 1.948052% |
| C | 5852 | 146 | 2.494874% |
| D | 5852 | 101 | 1.725906% |
Noise dominated data is calculated using 1-second bins in cleaned event files. If a bin has >2000 counts, and if more than 50% of those come from <1% of pixels, then it is considered to be noise-dominated and hence unusable.
| Quadrant | # 1 sec bins | Bins with >0 counts | Bins with >2000 counts | High rate bins dominated by noise | Noise dominated (total time) | Noise dominated (detector-on time) | Marked lightcurve |
|---|---|---|---|---|---|---|---|
| A | 7101 | 5852 | 5 | 5 | 0.07% | 0.09% | 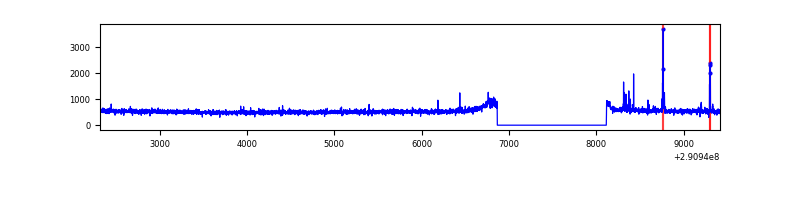 |
| B | 7102 | 5853 | 2 | 2 | 0.03% | 0.03% | 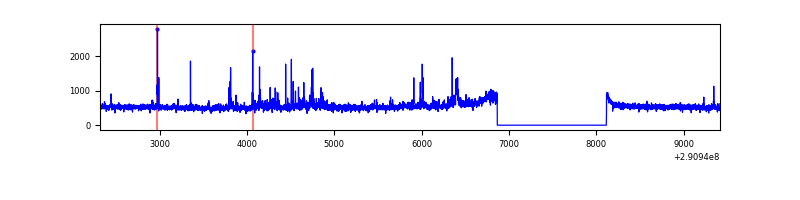 |
| C | 7102 | 5853 | 12 | 12 | 0.17% | 0.21% | 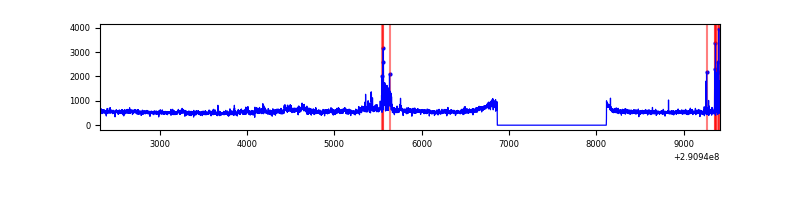 |
| D | 7102 | 5853 | 4 | 4 | 0.06% | 0.07% | 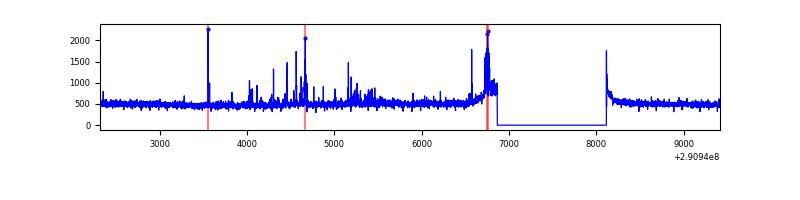 |
Top three noisy pixels from each quadrant. If the there are fewer than three noisy pixels in the level2.evt file, extra rows are filled as -1
| Pixel properties | Quadrant properties | ||||||
|---|---|---|---|---|---|---|---|
| Quadrant | DetID | PixID | Counts | Sigma | Mean | Median | Sigma |
| A | 4 | 2 | 58003 | 355.25 | 800 | 787 | 161.1 |
| A | 13 | 254 | 8722 | 49.27 | 800 | 787 | 161.1 |
| A | 0 | 226 | 7220 | 39.94 | 800 | 787 | 161.1 |
| B | 4 | 171 | 50691 | 336.95 | 786 | 769 | 148.2 |
| B | 12 | 18 | 32899 | 216.86 | 786 | 769 | 148.2 |
| B | 0 | 229 | 24015 | 156.9 | 786 | 769 | 148.2 |
| C | 3 | 233 | 264667 | 1510.34 | 751 | 758 | 174.7 |
| C | 14 | 238 | 118674 | 674.83 | 751 | 758 | 174.7 |
| C | 0 | 207 | 98669 | 560.34 | 751 | 758 | 174.7 |
| D | 12 | 233 | 41509 | 217.46 | 773 | 753 | 187.4 |
| D | 7 | 223 | 29806 | 155.02 | 773 | 753 | 187.4 |
| D | 2 | 234 | 23979 | 123.93 | 773 | 753 | 187.4 |
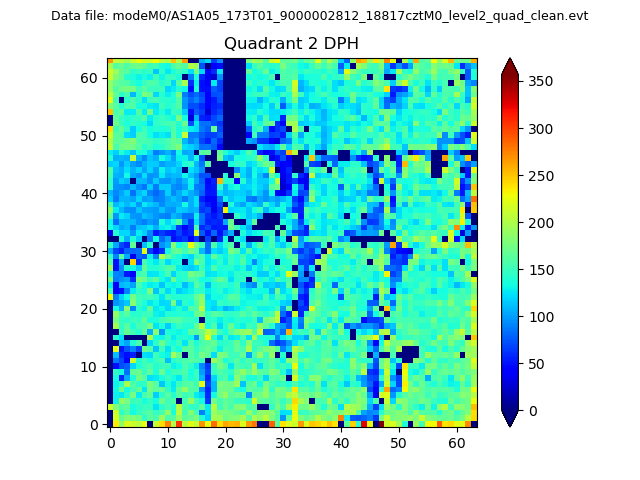
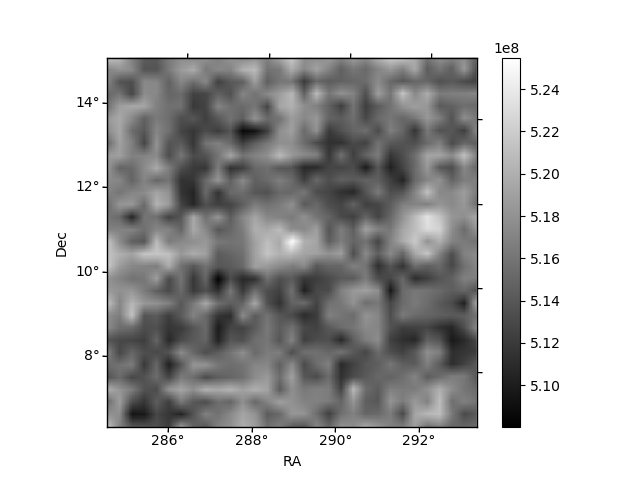
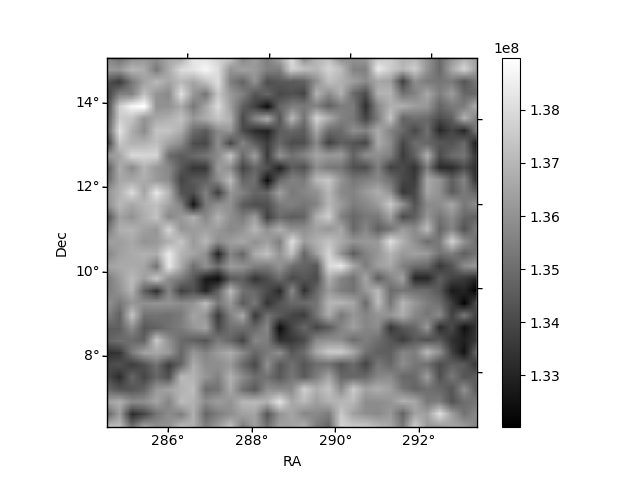
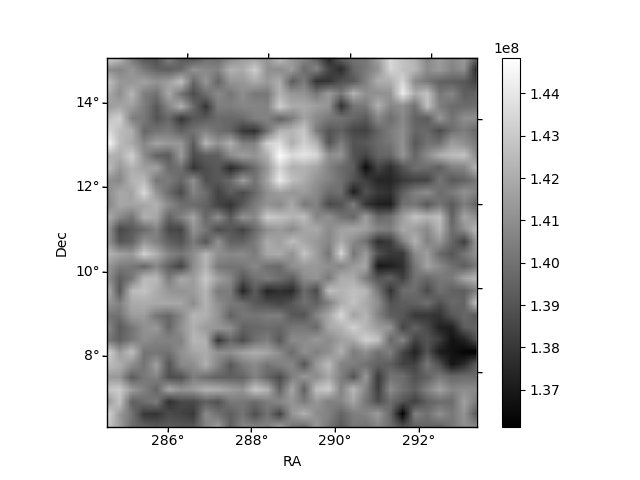
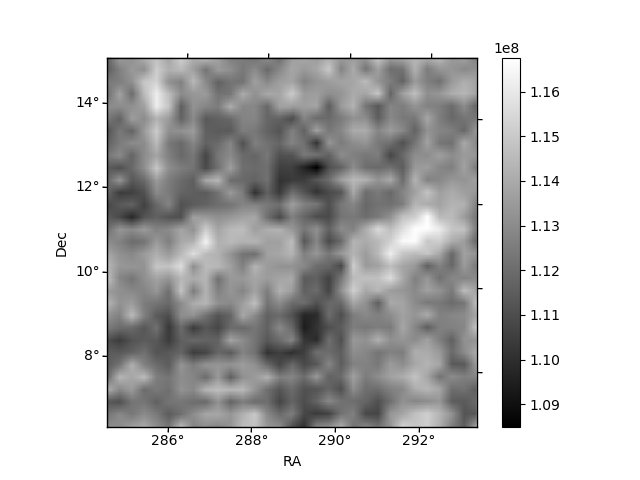
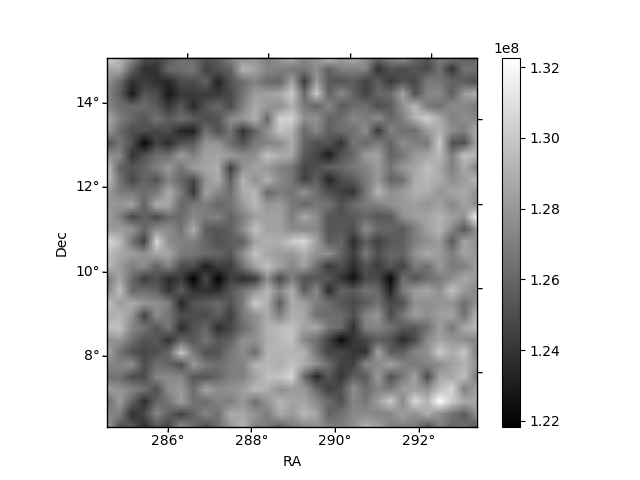
Histogram calculated using DETX and DETY for each event in the final _common_clean file
| Quadrant A | 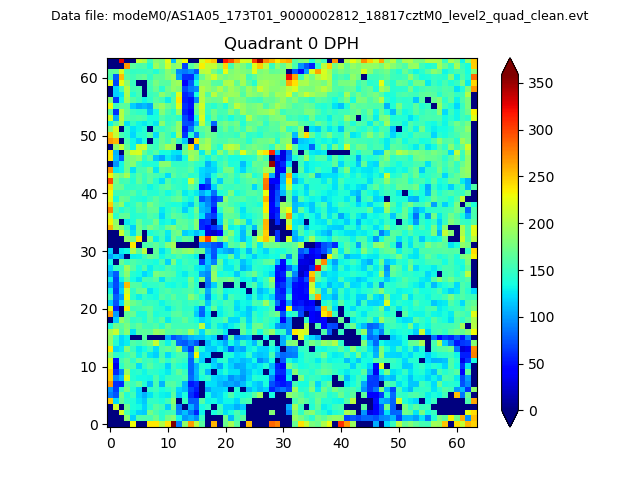 |
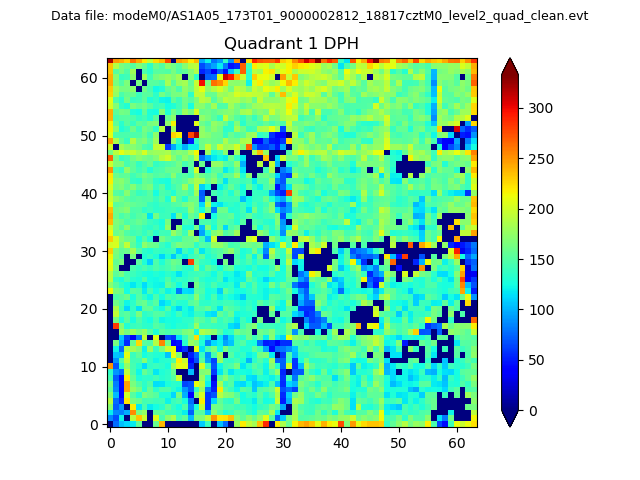 |
Quadrant B |
|---|---|---|---|
| Quadrant D | 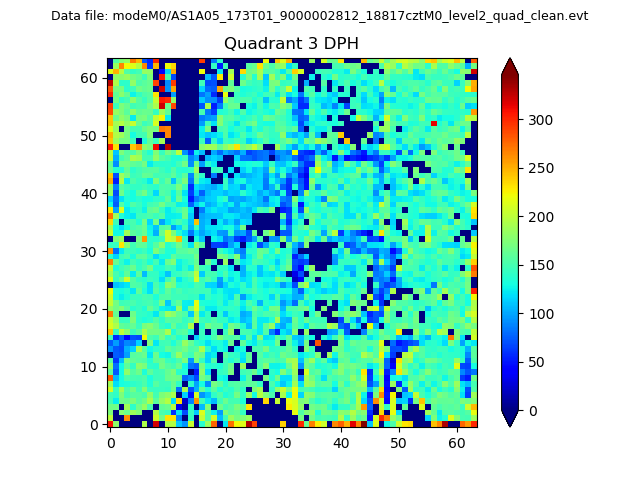 |
 |
Quadrant C |
| Plot type | Count rate plots | Images |
|---|---|---|
| Comparison with Poisson distribution Blue bars denote a histogram of data divided into 1 sec bins. Red curve is a Poisson curve with rate = median count rate of data. |
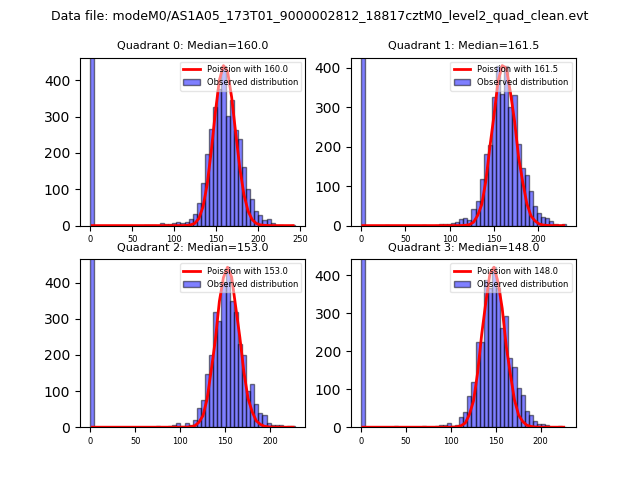 |
 |
| Quadrant-wise count rates Data is divided into 100 sec bins |
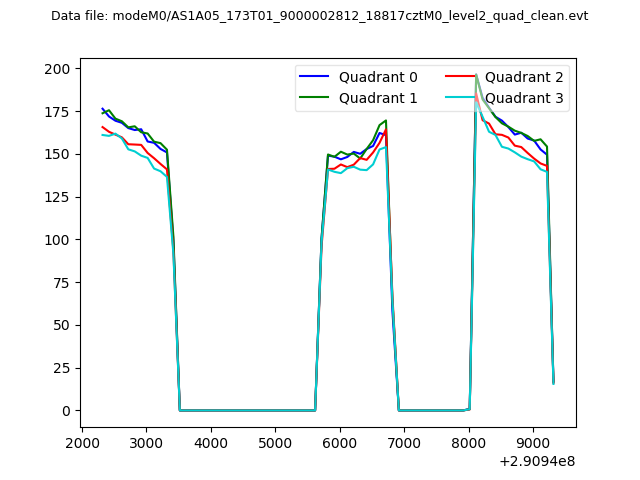 |
|
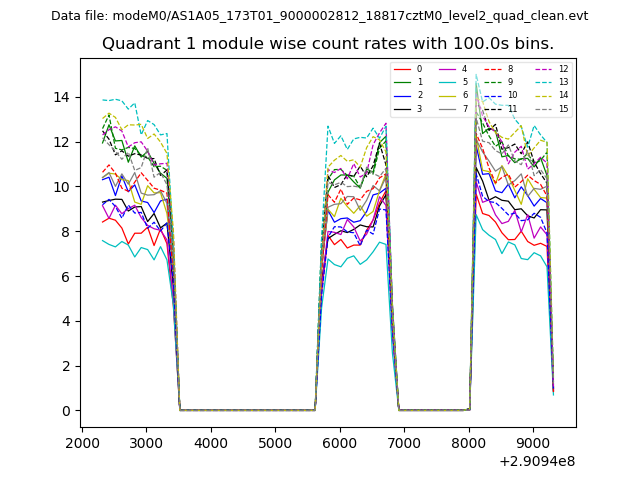
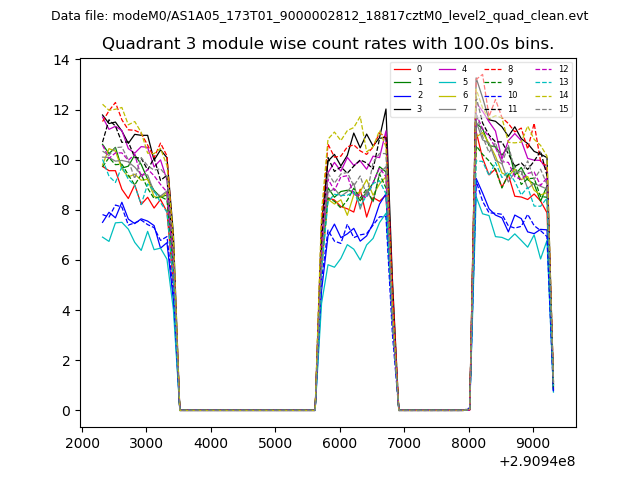
| Module-wise count rates for Quadrant A Data is divided into 100 sec bins |
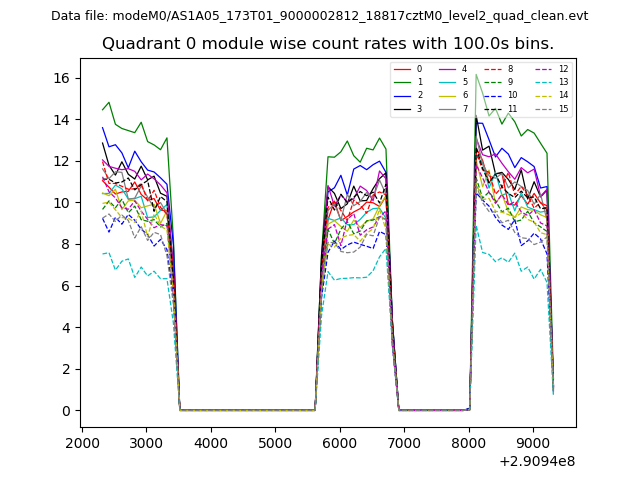 |
 |
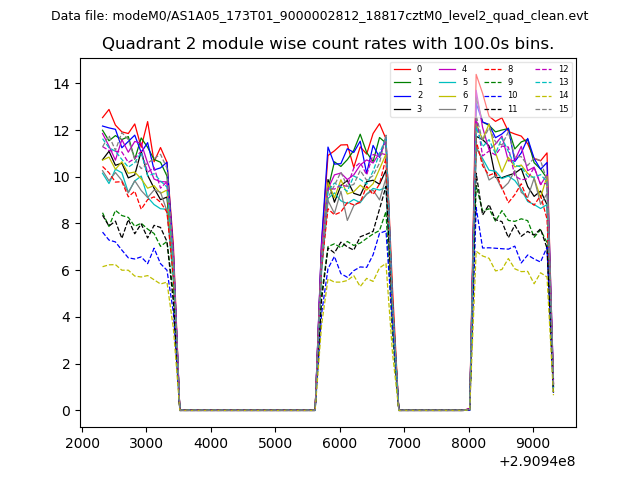
| Module-wise count rates for Quadrant B Data is divided into 100 sec bins |
 |
 |
| Module-wise count rates for Quadrant C Data is divided into 100 sec bins |
 |
 |
| Module-wise count rates for Quadrant D Data is divided into 100 sec bins |
 |
 |
| Parameter | Plot |
|---|---|
| CZT HV Monitor | 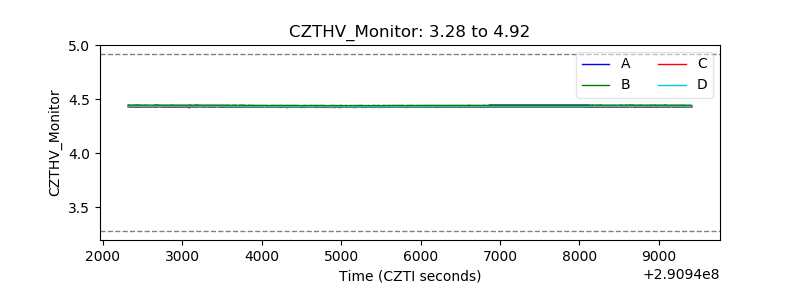 |
| D_VDD | 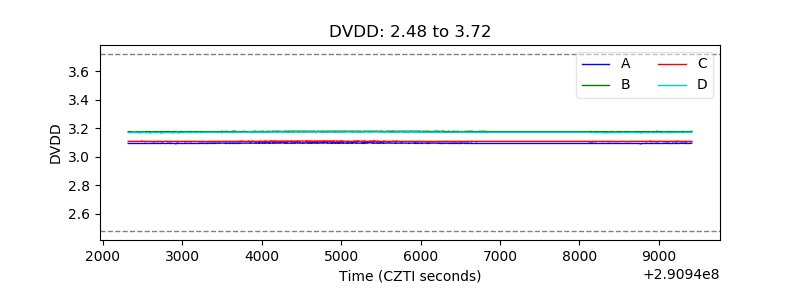 |
| Temperature 1 | 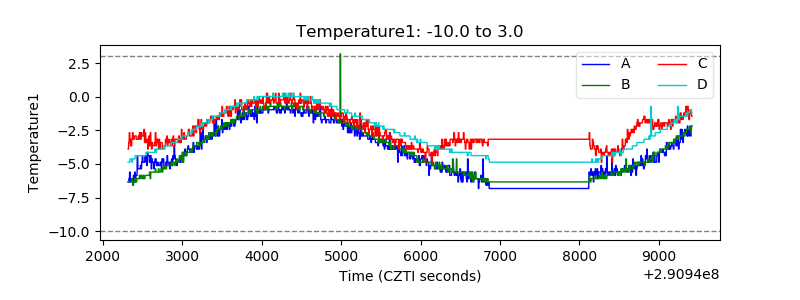 |
| Veto HV Monitor | 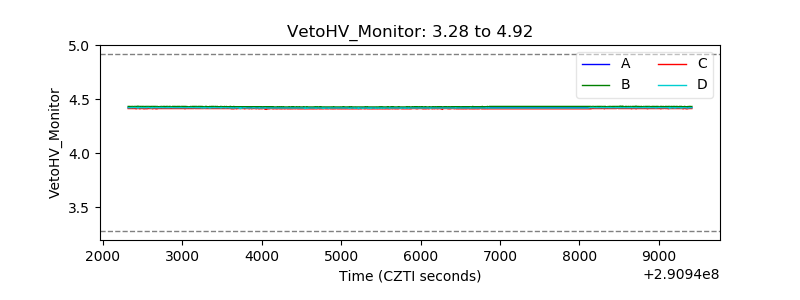 |
| Veto LLD | 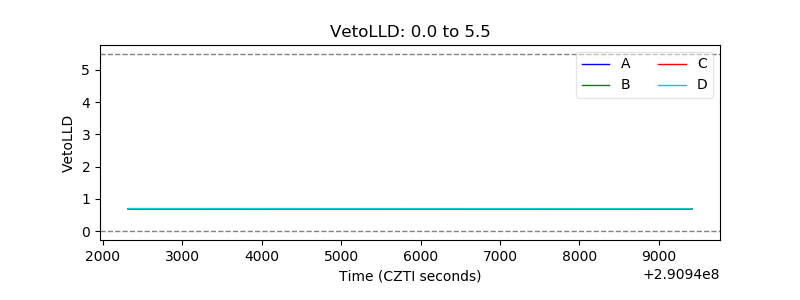 |
| Alpha Counter | 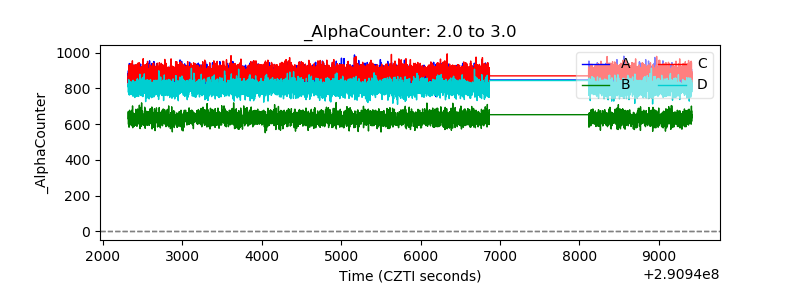 |
| _CPM_Rate | 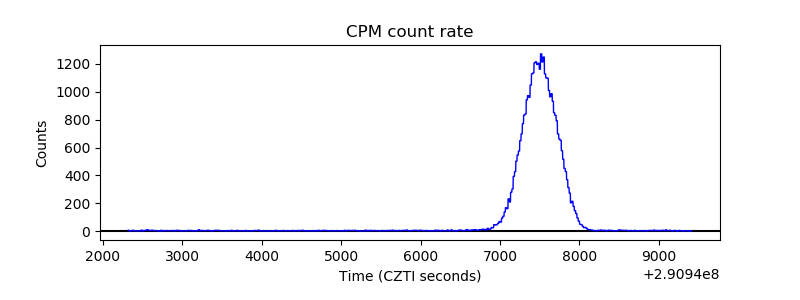 |
| CZT Counter |  |
| +2.5 Volts monitor |  |
| +5 Volts monitor |  |
| _ROLL_ROT | 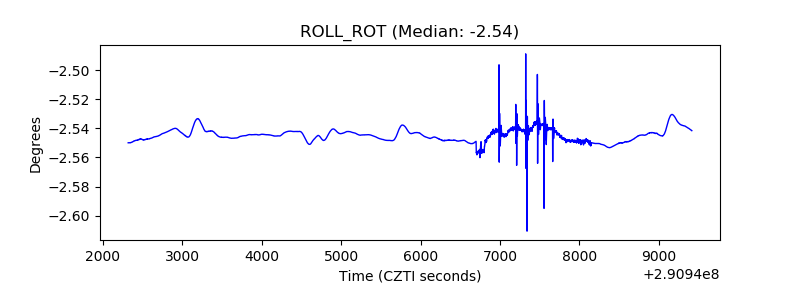 |
| _Roll_DEC |  |
| _Roll_RA | 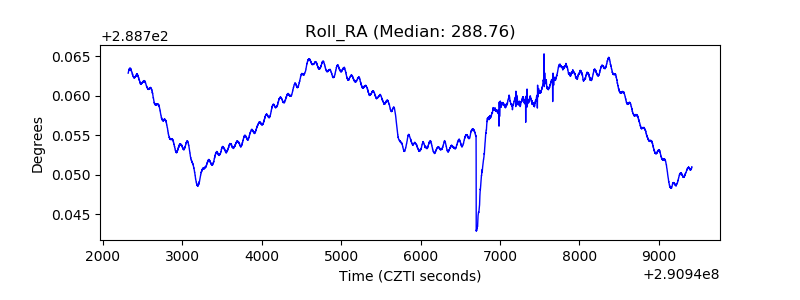 |
| Veto Counter | 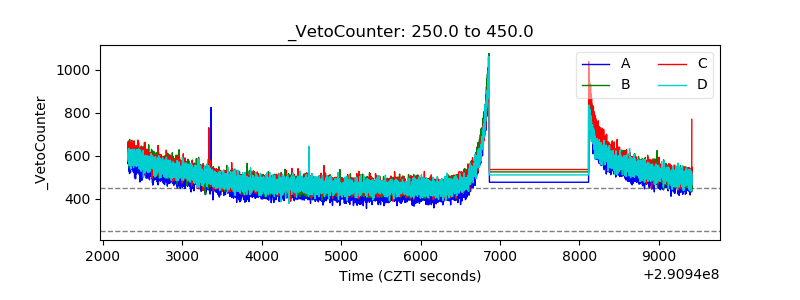 |