| Param | Original file | Final file |
|---|---|---|
| Filename | modeM0/AS1A05_173T01_9000002812_18818cztM0_level2.evt | modeM0/AS1A05_173T01_9000002812_18818cztM0_level2_quad_clean.evt |
| Size (bytes) | 439,050,240 | 80,075,520 |
| Size | 418.7 MB | 76.4 MB |
| Events in quadrant A | 3,145,666 | 514,317 |
| Events in quadrant B | 3,261,578 | 517,191 |
| Events in quadrant C | 3,289,820 | 494,136 |
| Events in quadrant D | 3,193,235 | 481,352 |
| Mode SS | |||
|---|---|---|---|
| Quadrant | BADHDUFLAG | Total packets | Discarded packets |
| A | 0 | 122 | 0 |
| B | 0 | 122 | 0 |
| C | 0 | 122 | 0 |
| D | 0 | 122 | 0 |
| Mode M9 | |||
|---|---|---|---|
| Quadrant | BADHDUFLAG | Total packets | Discarded packets |
| A | 0 | 12 | 0 |
| B | 0 | 12 | 0 |
| C | 0 | 12 | 0 |
| D | 0 | 12 | 0 |
| Mode M0 | |||
|---|---|---|---|
| Quadrant | BADHDUFLAG | Total packets | Discarded packets |
| A | 0 | 12694 | 1 |
| B | 0 | 12980 | 1 |
| C | 0 | 13082 | 1 |
| D | 0 | 12991 | 1 |
| Quadrant | Total seconds | Saturated seconds | Saturation percentage |
|---|---|---|---|
| A | 5980 | 85 | 1.421405% |
| B | 5980 | 82 | 1.371237% |
| C | 5980 | 118 | 1.973244% |
| D | 5980 | 58 | 0.969900% |
Noise dominated data is calculated using 1-second bins in cleaned event files. If a bin has >2000 counts, and if more than 50% of those come from <1% of pixels, then it is considered to be noise-dominated and hence unusable.
| Quadrant | # 1 sec bins | Bins with >0 counts | Bins with >2000 counts | High rate bins dominated by noise | Noise dominated (total time) | Noise dominated (detector-on time) | Marked lightcurve |
|---|---|---|---|---|---|---|---|
| A | 7185 | 5981 | 6 | 6 | 0.08% | 0.10% | 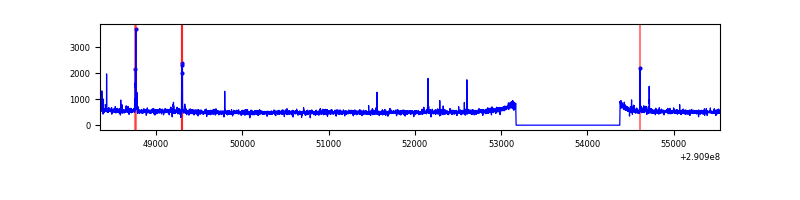 |
| B | 7185 | 5981 | 9 | 9 | 0.13% | 0.15% | 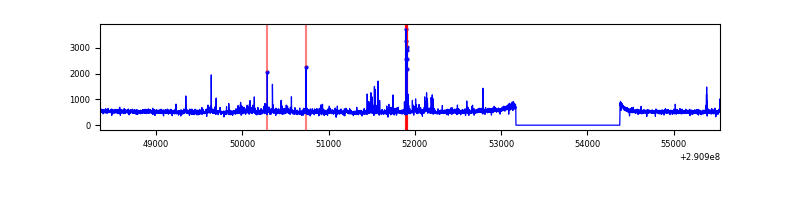 |
| C | 7185 | 5981 | 35 | 35 | 0.49% | 0.59% | 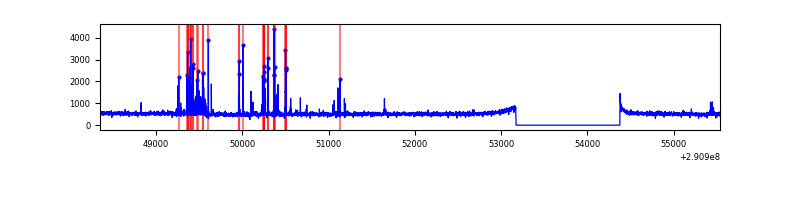 |
| D | 7185 | 5981 | 22 | 22 | 0.31% | 0.37% | 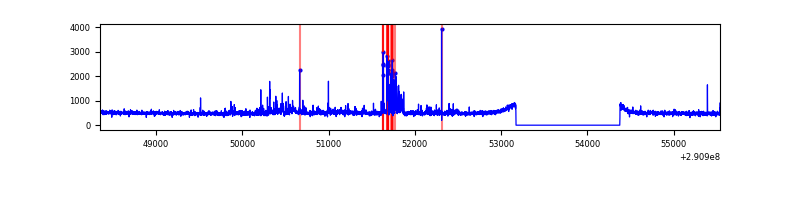 |
Top three noisy pixels from each quadrant. If the there are fewer than three noisy pixels in the level2.evt file, extra rows are filled as -1
| Pixel properties | Quadrant properties | ||||||
|---|---|---|---|---|---|---|---|
| Quadrant | DetID | PixID | Counts | Sigma | Mean | Median | Sigma |
| A | 4 | 2 | 73954 | 455.11 | 796 | 782 | 160.8 |
| A | 13 | 254 | 9033 | 51.32 | 796 | 782 | 160.8 |
| A | 0 | 226 | 6911 | 38.12 | 796 | 782 | 160.8 |
| B | 0 | 229 | 38862 | 255.33 | 783 | 768 | 149.2 |
| B | 4 | 171 | 36219 | 237.61 | 783 | 768 | 149.2 |
| B | 6 | 36 | 34147 | 223.72 | 783 | 768 | 149.2 |
| C | 0 | 207 | 217279 | 1240.93 | 750 | 757 | 174.5 |
| C | 14 | 238 | 117189 | 667.29 | 750 | 757 | 174.5 |
| C | 3 | 233 | 33364 | 186.88 | 750 | 757 | 174.5 |
| D | 9 | 1 | 128675 | 683.43 | 772 | 752 | 187.2 |
| D | 7 | 238 | 51044 | 268.69 | 772 | 752 | 187.2 |
| D | 2 | 234 | 24503 | 126.89 | 772 | 752 | 187.2 |
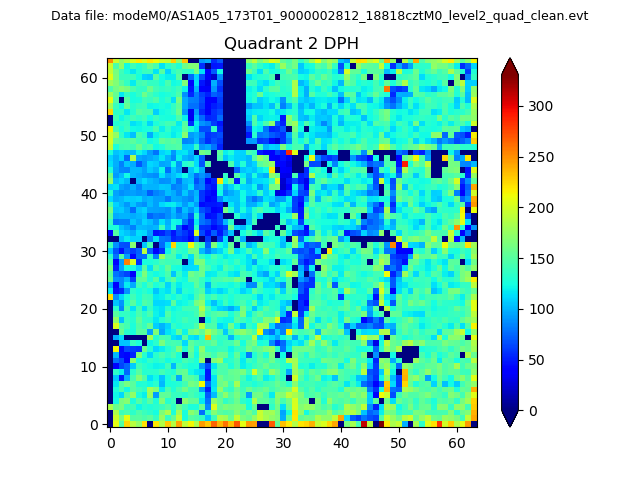
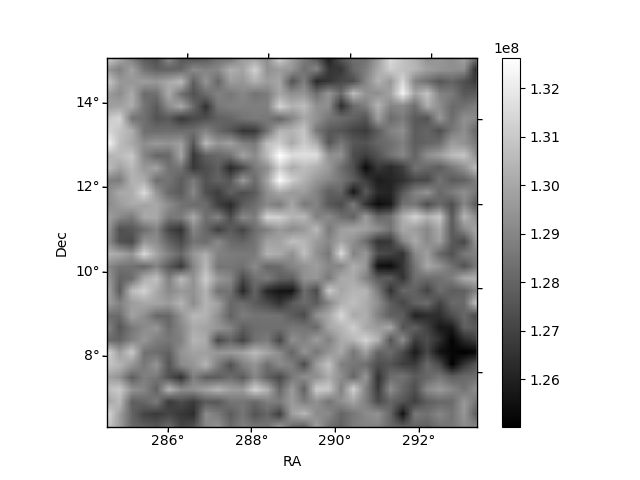
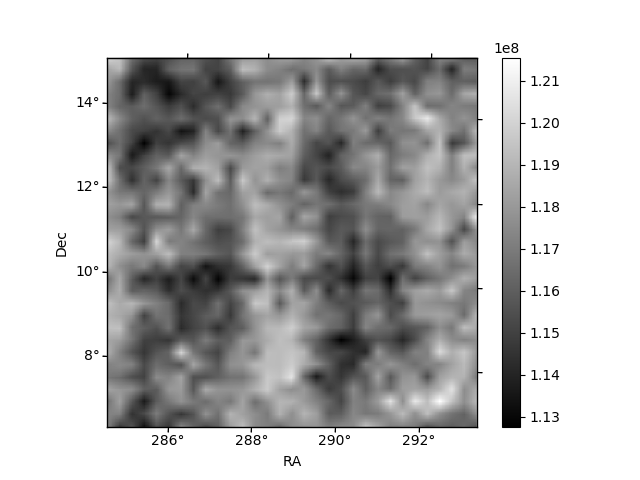
Histogram calculated using DETX and DETY for each event in the final _common_clean file
| Quadrant A | 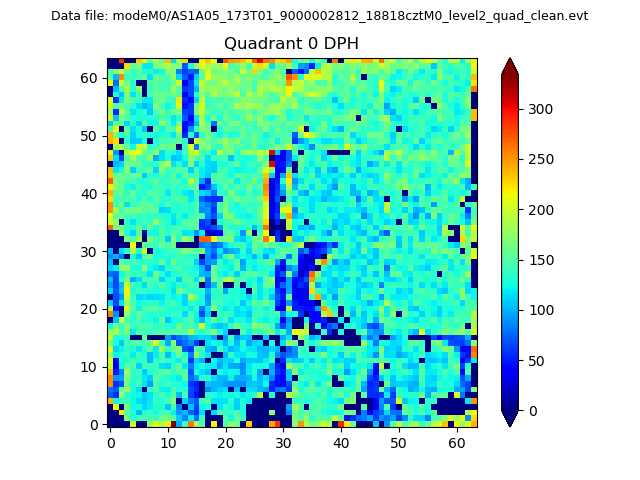 |
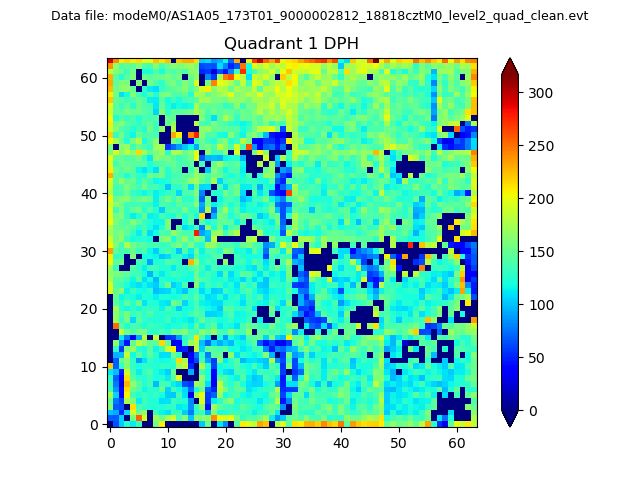 |
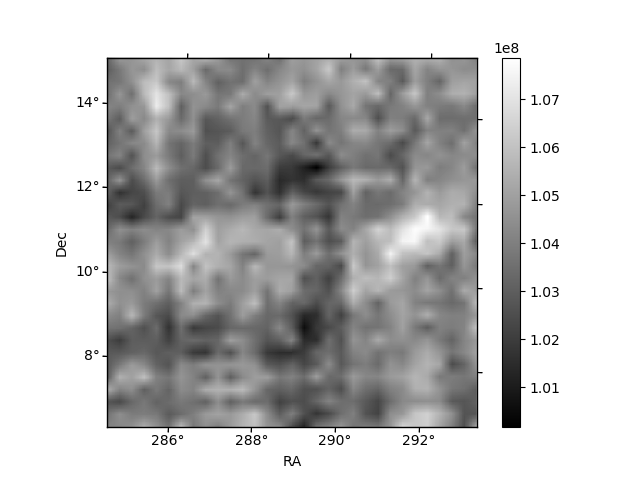
Quadrant B |
|---|---|---|---|
| Quadrant D | 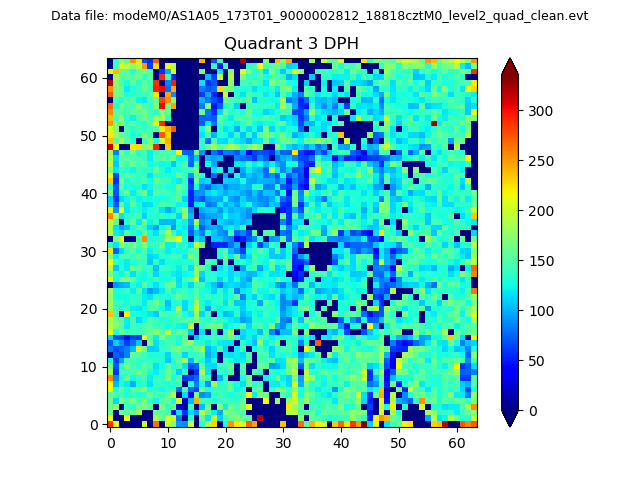 |
 |
Quadrant C |
| Plot type | Count rate plots | Images |
|---|---|---|
| Comparison with Poisson distribution Blue bars denote a histogram of data divided into 1 sec bins. Red curve is a Poisson curve with rate = median count rate of data. |
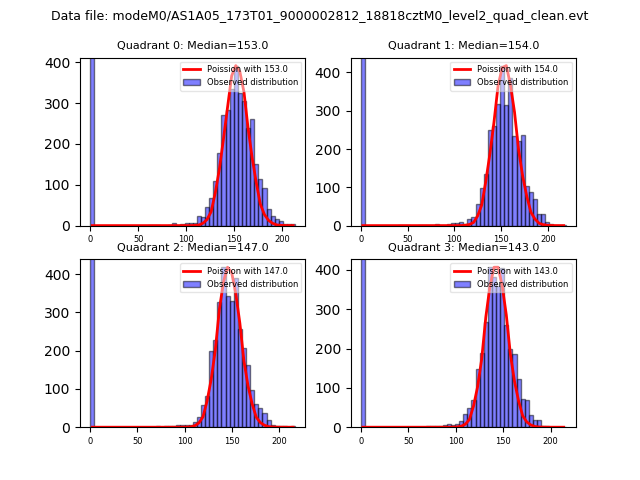 |
 |
| Quadrant-wise count rates Data is divided into 100 sec bins |
 |
|
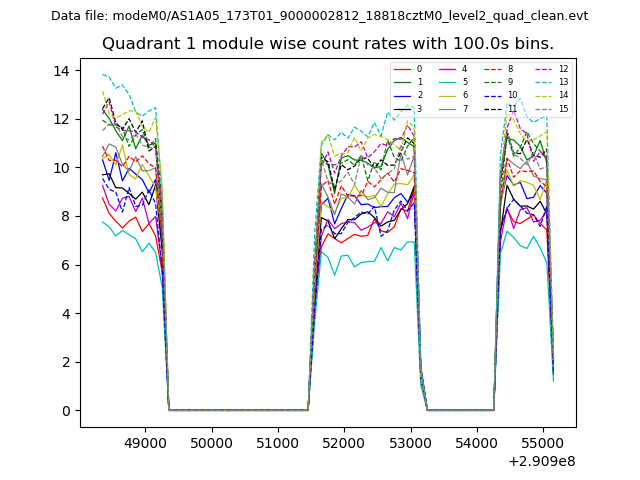
| Module-wise count rates for Quadrant A Data is divided into 100 sec bins |
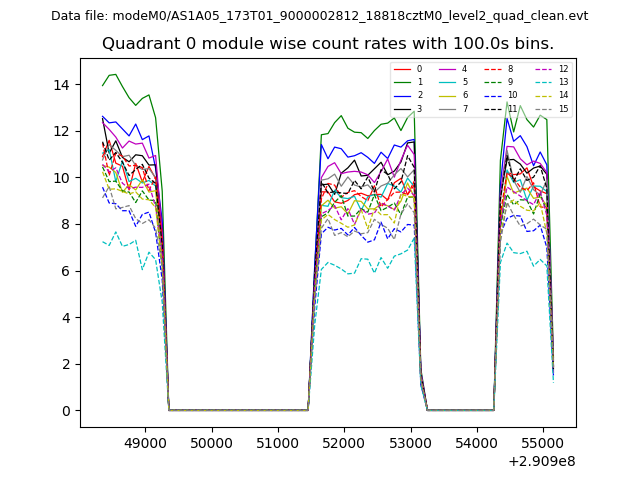 |
 |
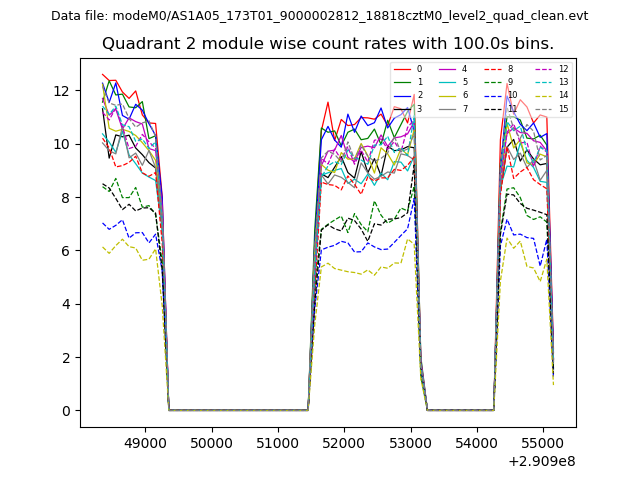
| Module-wise count rates for Quadrant B Data is divided into 100 sec bins |
 |
 |
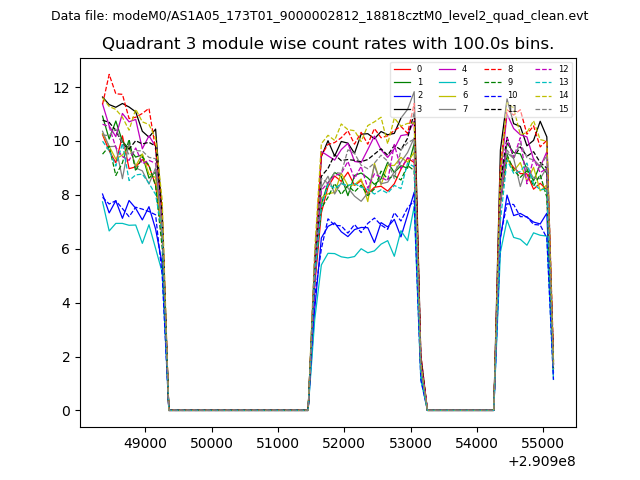
| Module-wise count rates for Quadrant C Data is divided into 100 sec bins |
 |
 |
| Module-wise count rates for Quadrant D Data is divided into 100 sec bins |
 |
 |
| Parameter | Plot |
|---|---|
| CZT HV Monitor | 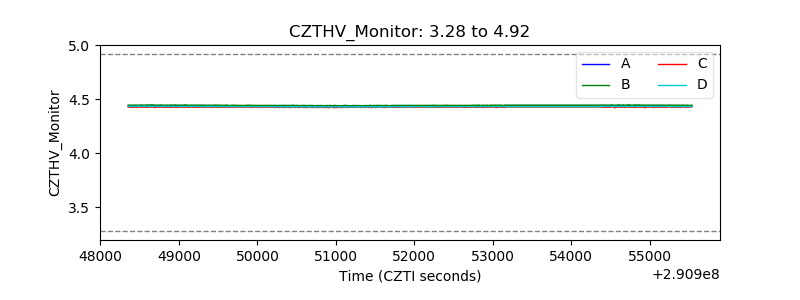 |
| D_VDD | 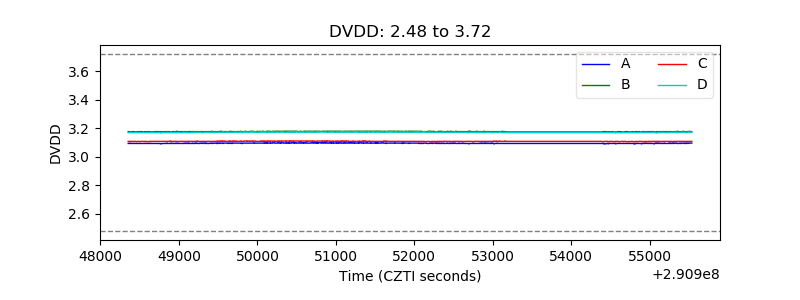 |
| Temperature 1 | 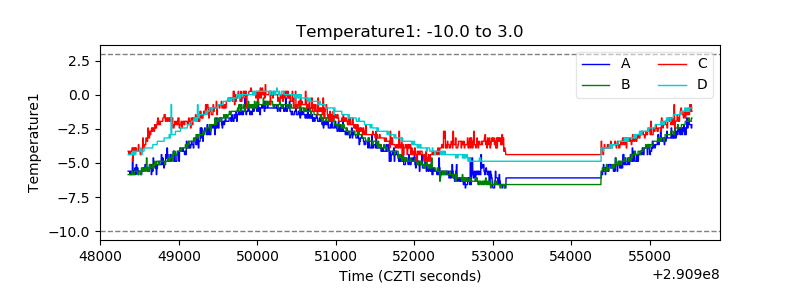 |
| Veto HV Monitor |  |
| Veto LLD |  |
| Alpha Counter | 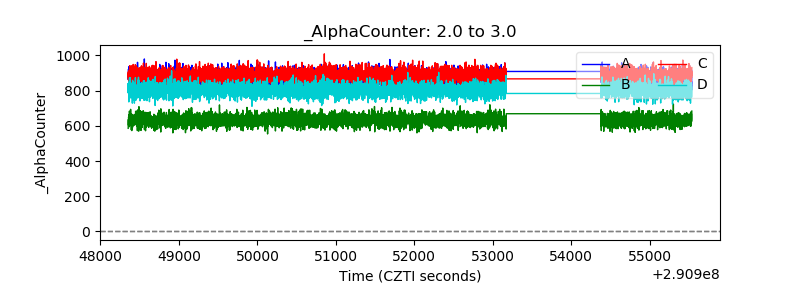 |
| _CPM_Rate | 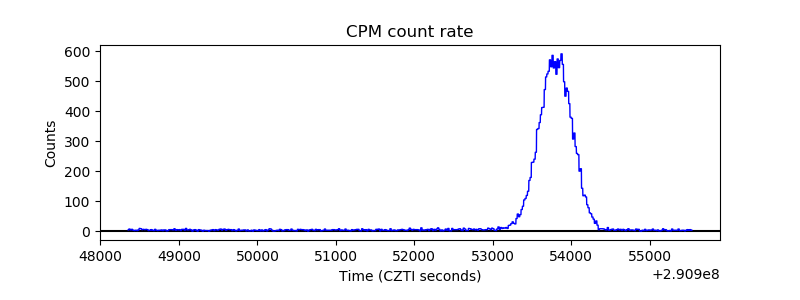 |
| CZT Counter | 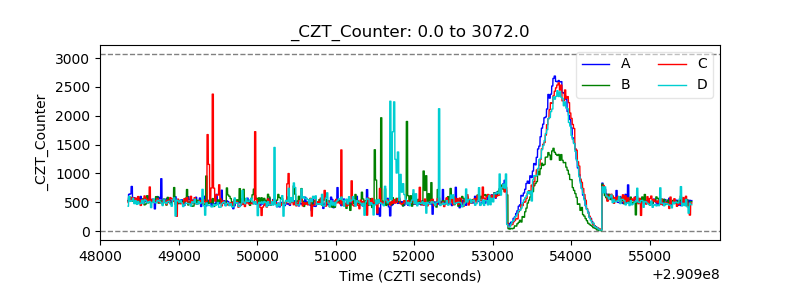 |
| +2.5 Volts monitor |  |
| +5 Volts monitor |  |
| _ROLL_ROT | 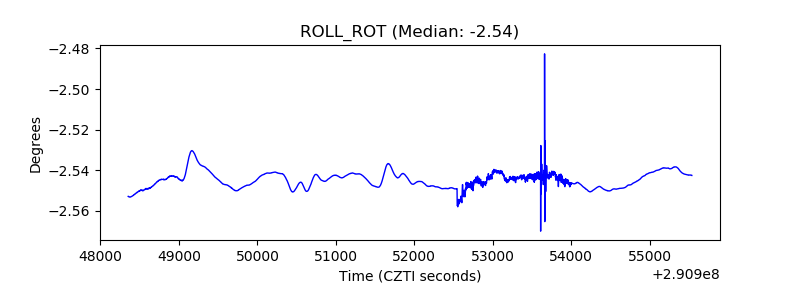 |
| _Roll_DEC | 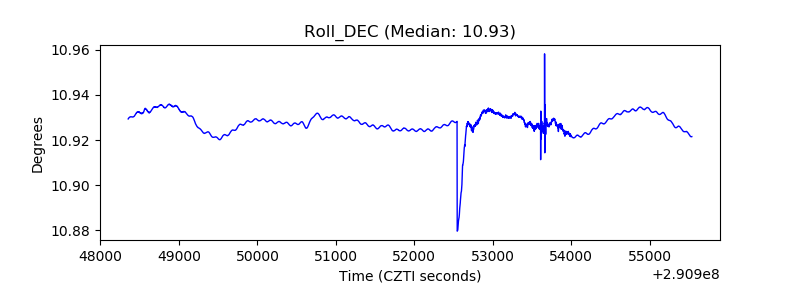 |
| _Roll_RA |  |
| Veto Counter | 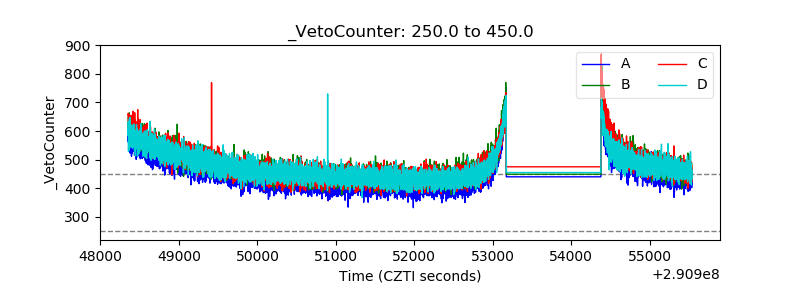 |