| Param | Original file | Final file |
|---|---|---|
| Filename | modeM0/AS1A05_173T01_9000002812_18819cztM0_level2.evt | modeM0/AS1A05_173T01_9000002812_18819cztM0_level2_quad_clean.evt |
| Size (bytes) | 476,726,400 | 81,025,920 |
| Size | 454.6 MB | 77.3 MB |
| Events in quadrant A | 3,519,797 | 505,756 |
| Events in quadrant B | 3,611,522 | 508,712 |
| Events in quadrant C | 3,564,543 | 488,382 |
| Events in quadrant D | 3,282,334 | 479,414 |
| Mode SS | |||
|---|---|---|---|
| Quadrant | BADHDUFLAG | Total packets | Discarded packets |
| A | 0 | 140 | 0 |
| B | 0 | 140 | 0 |
| C | 0 | 140 | 0 |
| D | 0 | 140 | 0 |
| Mode M9 | |||
|---|---|---|---|
| Quadrant | BADHDUFLAG | Total packets | Discarded packets |
| A | 0 | 8 | 0 |
| B | 0 | 8 | 0 |
| C | 0 | 8 | 0 |
| D | 0 | 8 | 0 |
| Mode M0 | |||
|---|---|---|---|
| Quadrant | BADHDUFLAG | Total packets | Discarded packets |
| A | 0 | 14397 | 2 |
| B | 0 | 14609 | 2 |
| C | 0 | 14501 | 2 |
| D | 0 | 14043 | 2 |
| Quadrant | Total seconds | Saturated seconds | Saturation percentage |
|---|---|---|---|
| A | 6751 | 135 | 1.999704% |
| B | 6752 | 153 | 2.265995% |
| C | 6752 | 177 | 2.621445% |
| D | 6752 | 105 | 1.555095% |
Noise dominated data is calculated using 1-second bins in cleaned event files. If a bin has >2000 counts, and if more than 50% of those come from <1% of pixels, then it is considered to be noise-dominated and hence unusable.
| Quadrant | # 1 sec bins | Bins with >0 counts | Bins with >2000 counts | High rate bins dominated by noise | Noise dominated (total time) | Noise dominated (detector-on time) | Marked lightcurve |
|---|---|---|---|---|---|---|---|
| A | 7626 | 6752 | 3 | 3 | 0.04% | 0.04% | 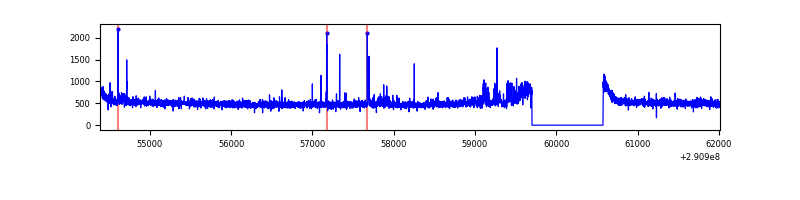 |
| B | 7627 | 6753 | 16 | 16 | 0.21% | 0.24% | 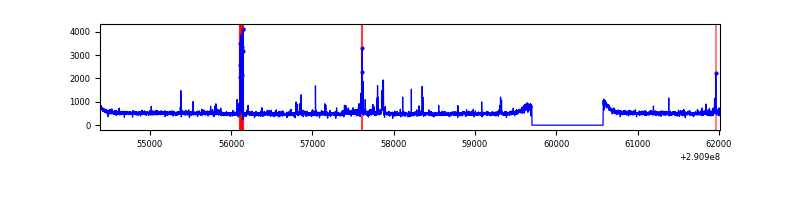 |
| C | 7627 | 6752 | 19 | 19 | 0.25% | 0.28% | 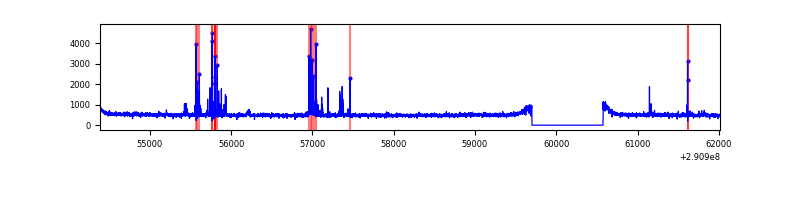 |
| D | 7627 | 6753 | 3 | 3 | 0.04% | 0.04% | 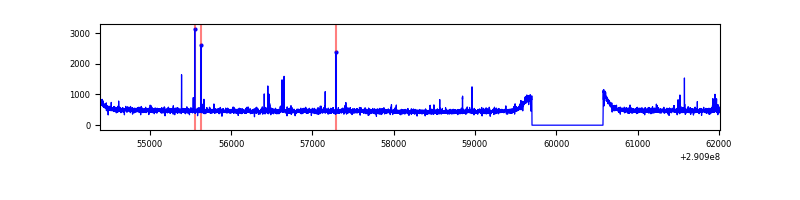 |
Top three noisy pixels from each quadrant. If the there are fewer than three noisy pixels in the level2.evt file, extra rows are filled as -1
| Pixel properties | Quadrant properties | ||||||
|---|---|---|---|---|---|---|---|
| Quadrant | DetID | PixID | Counts | Sigma | Mean | Median | Sigma |
| A | 8 | 144 | 117926 | 654.67 | 877 | 860 | 178.8 |
| A | 4 | 2 | 17335 | 92.13 | 877 | 860 | 178.8 |
| A | 13 | 254 | 11116 | 57.35 | 877 | 860 | 178.8 |
| B | 4 | 216 | 73538 | 435.62 | 865 | 845 | 166.9 |
| B | 6 | 36 | 41734 | 245.03 | 865 | 845 | 166.9 |
| B | 0 | 189 | 36332 | 212.66 | 865 | 845 | 166.9 |
| C | 0 | 207 | 165144 | 843.16 | 829 | 837 | 194.9 |
| C | 14 | 238 | 129977 | 662.69 | 829 | 837 | 194.9 |
| C | 3 | 233 | 36845 | 184.78 | 829 | 837 | 194.9 |
| D | 2 | 234 | 27579 | 128.27 | 852 | 827 | 208.6 |
| D | 7 | 38 | 17173 | 78.37 | 852 | 827 | 208.6 |
| D | 7 | 238 | 9273 | 40.49 | 852 | 827 | 208.6 |
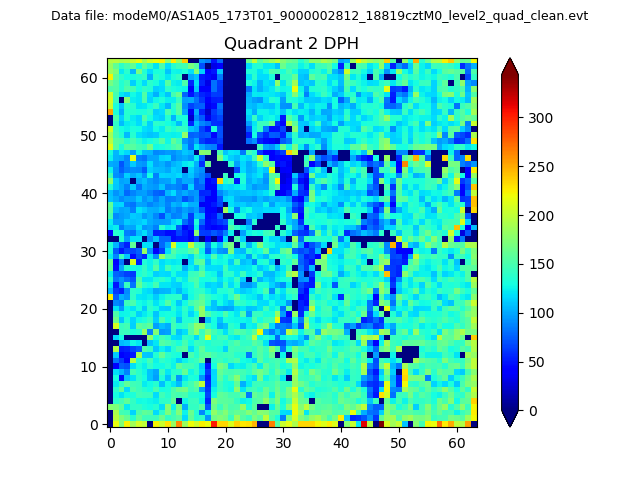
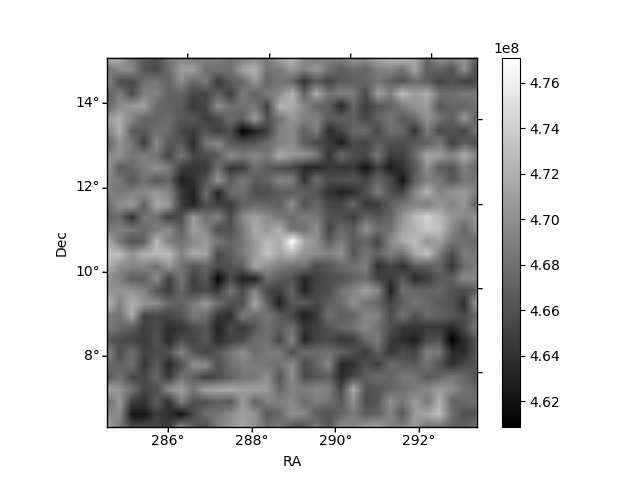
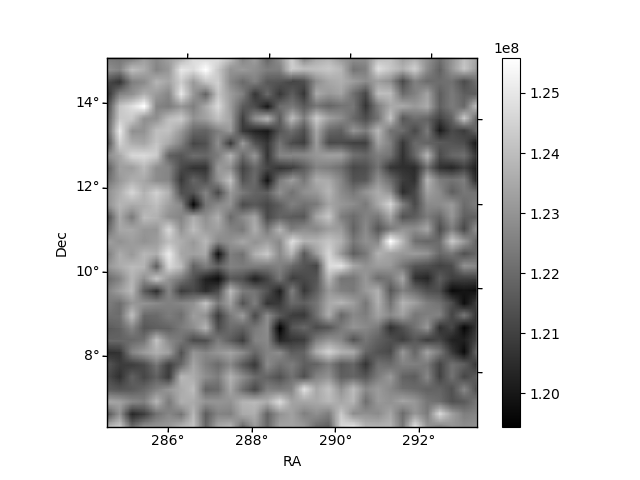
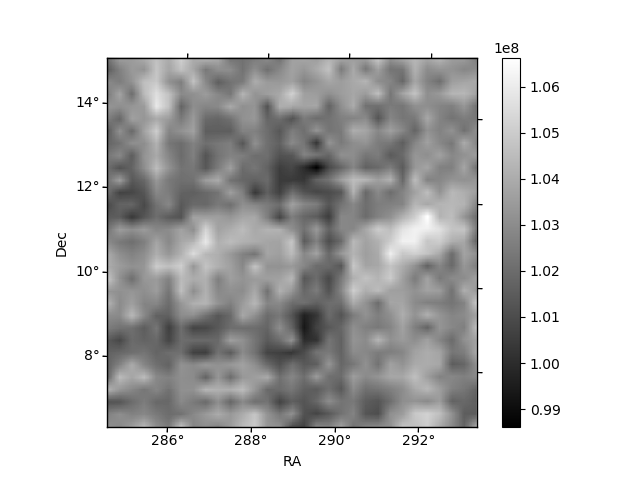
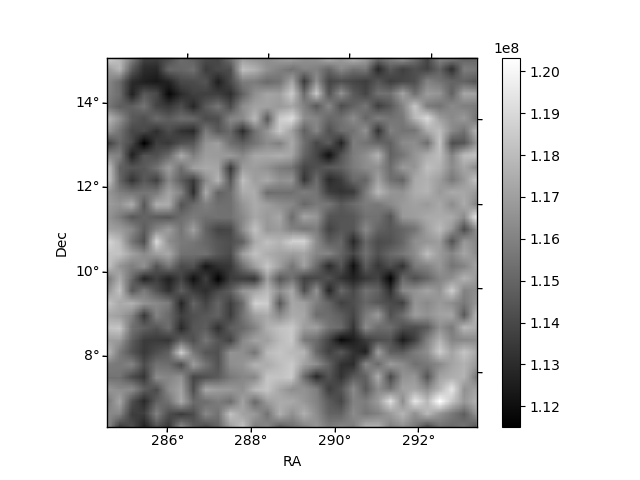
Histogram calculated using DETX and DETY for each event in the final _common_clean file
| Quadrant A | 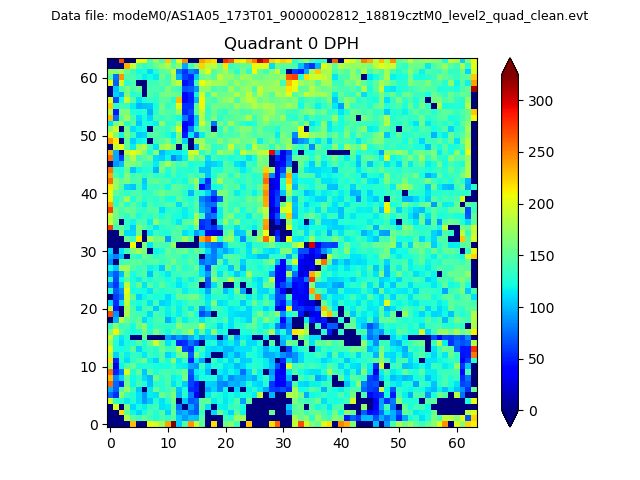 |
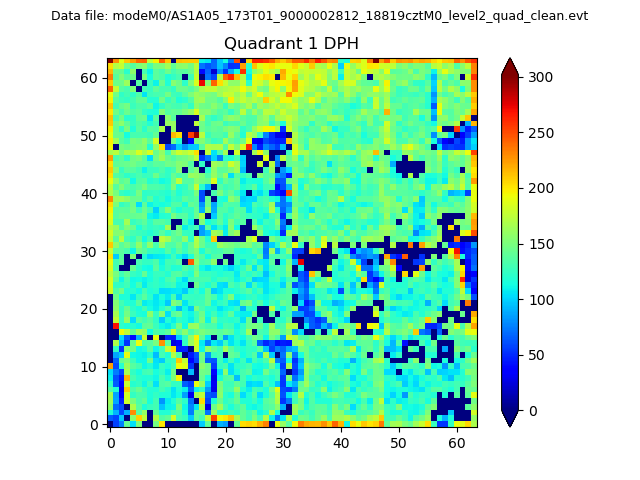 |
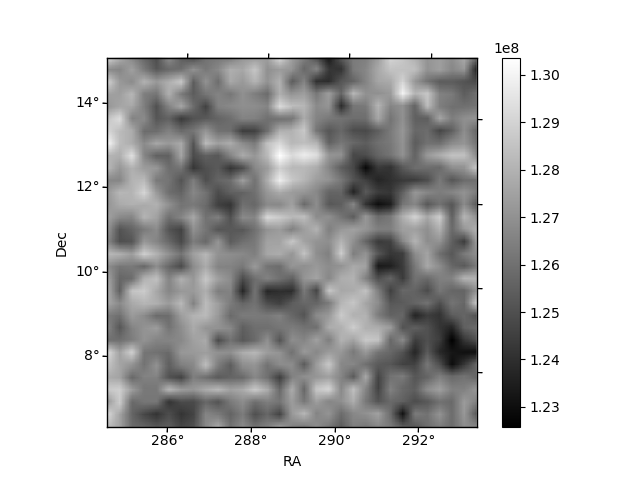
Quadrant B |
|---|---|---|---|
| Quadrant D | 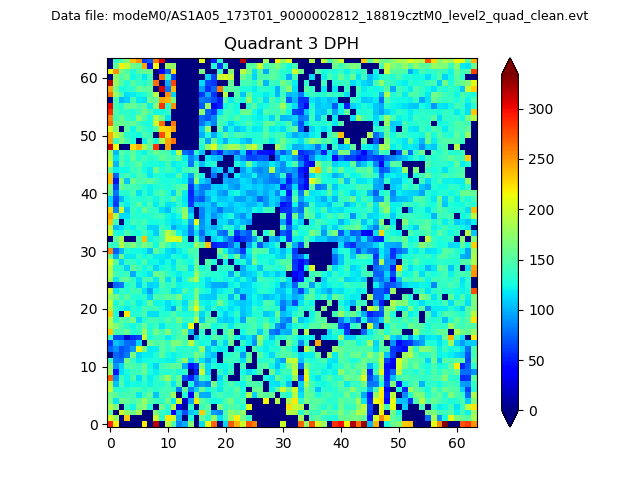 |
 |
Quadrant C |
| Plot type | Count rate plots | Images |
|---|---|---|
| Comparison with Poisson distribution Blue bars denote a histogram of data divided into 1 sec bins. Red curve is a Poisson curve with rate = median count rate of data. |
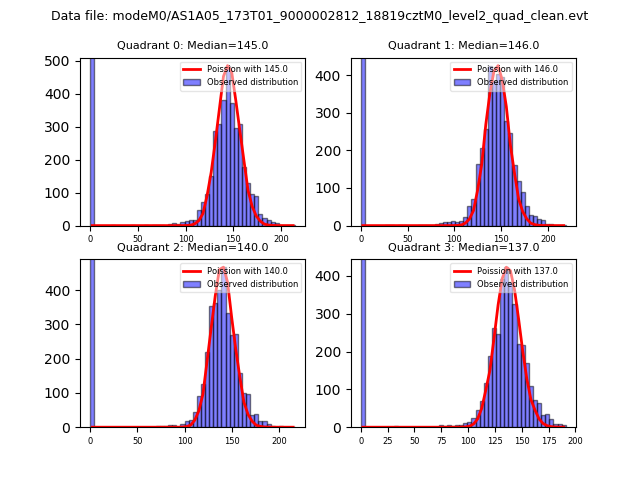 |
 |
| Quadrant-wise count rates Data is divided into 100 sec bins |
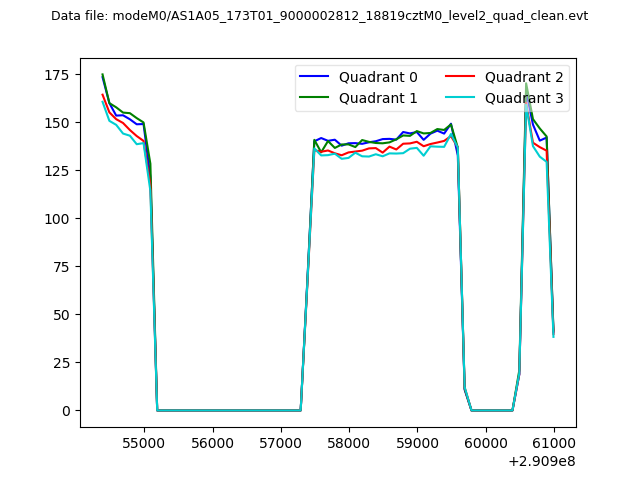 |
|
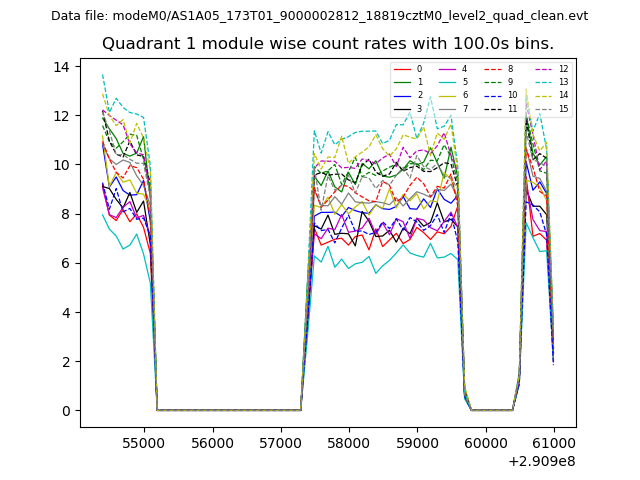
| Module-wise count rates for Quadrant A Data is divided into 100 sec bins |
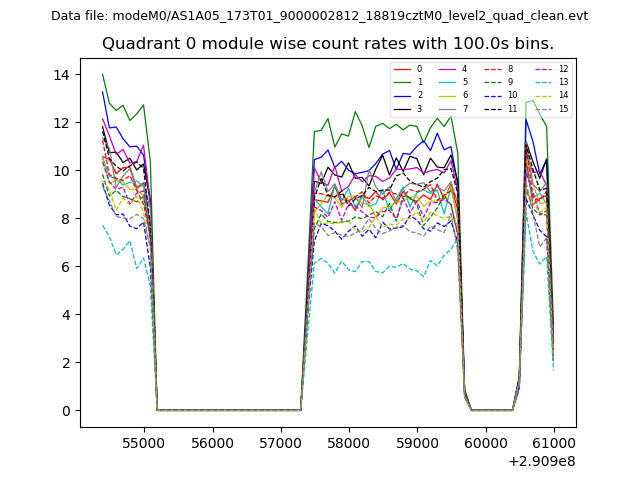 |
 |
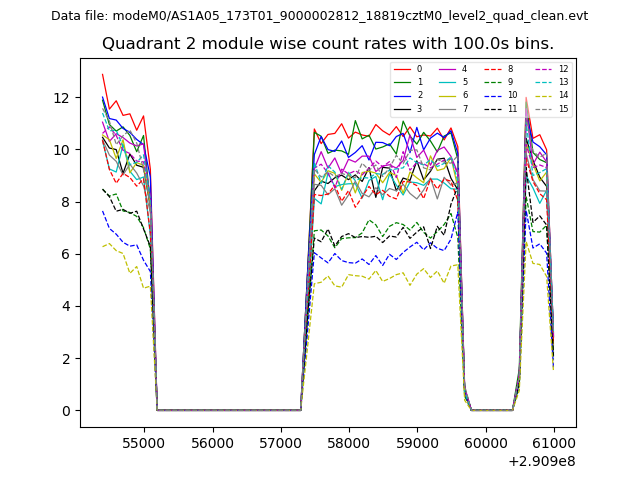
| Module-wise count rates for Quadrant B Data is divided into 100 sec bins |
 |
 |
| Module-wise count rates for Quadrant C Data is divided into 100 sec bins |
 |
 |
| Module-wise count rates for Quadrant D Data is divided into 100 sec bins |
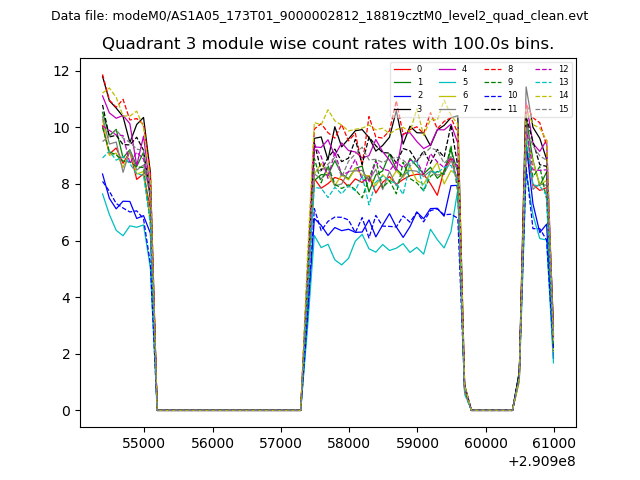 |
 |
| Parameter | Plot |
|---|---|
| CZT HV Monitor | 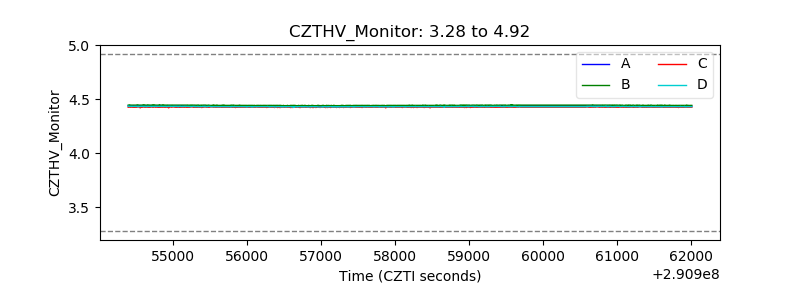 |
| D_VDD | 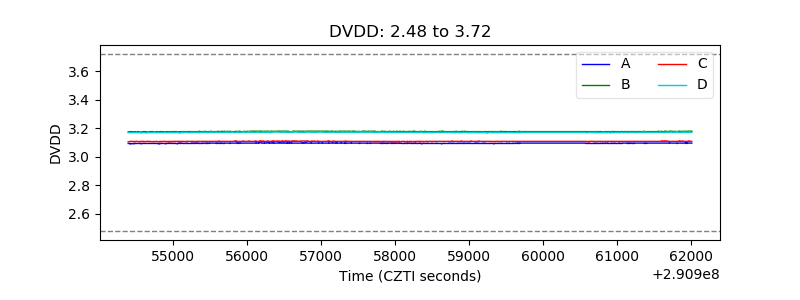 |
| Temperature 1 | 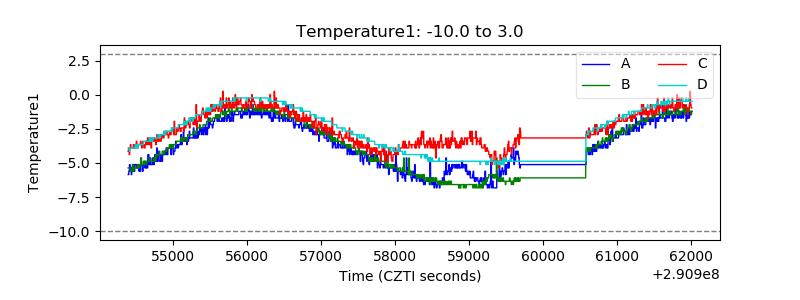 |
| Veto HV Monitor | 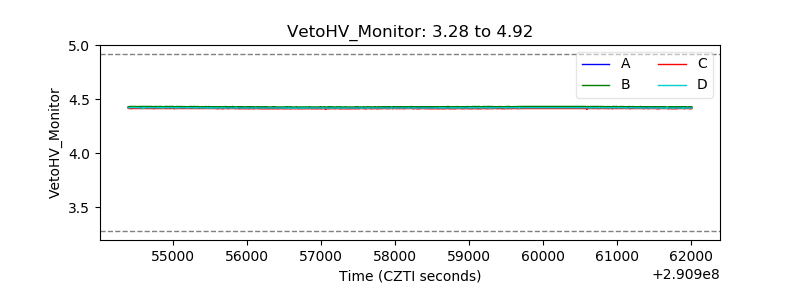 |
| Veto LLD | 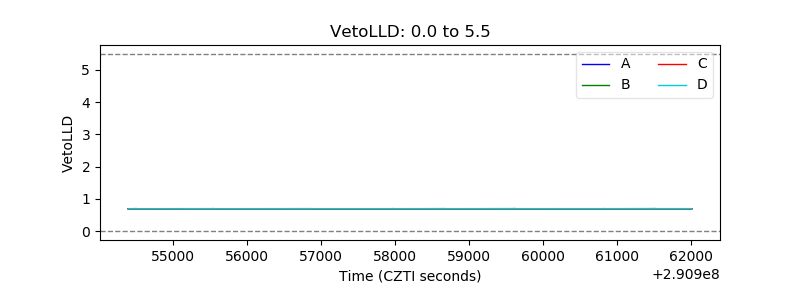 |
| Alpha Counter | 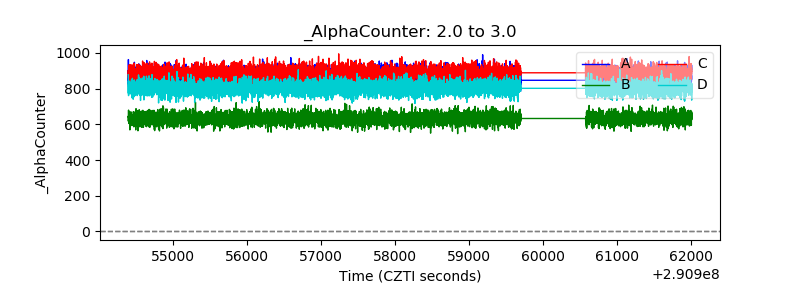 |
| _CPM_Rate | 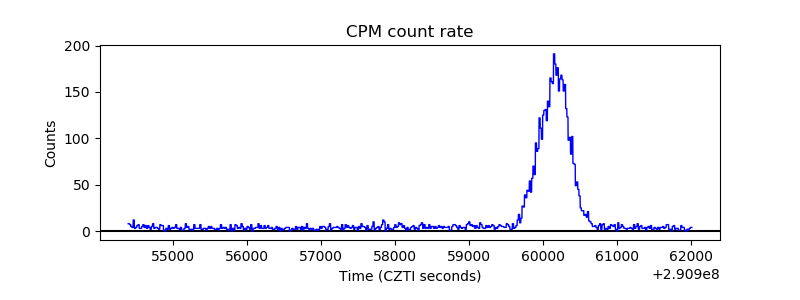 |
| CZT Counter | 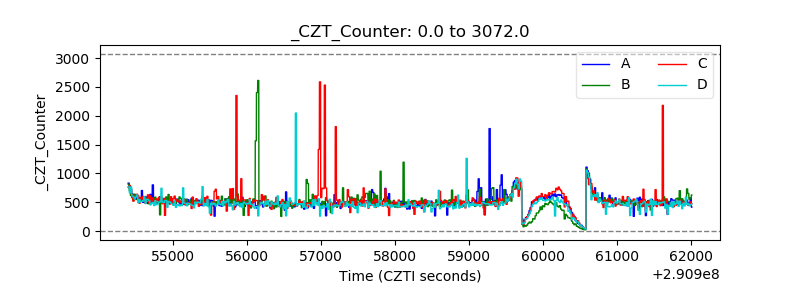 |
| +2.5 Volts monitor | 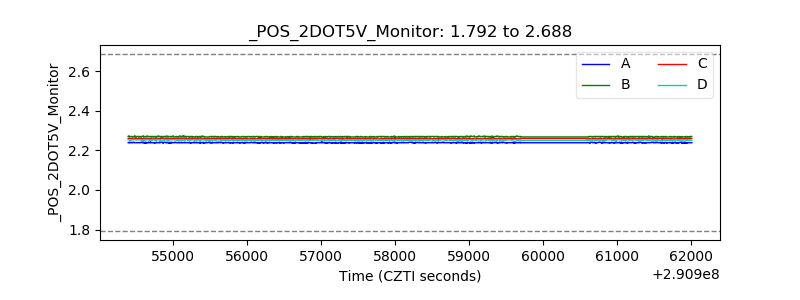 |
| +5 Volts monitor | 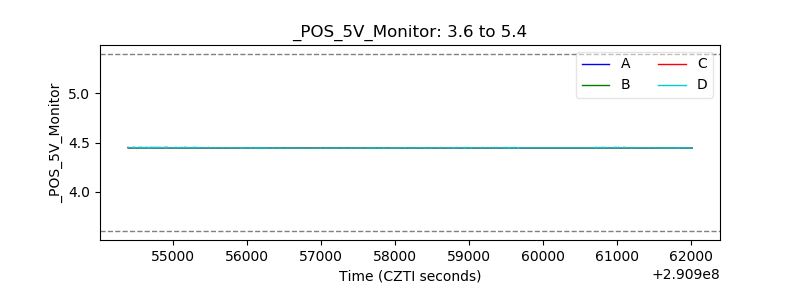 |
| _ROLL_ROT | 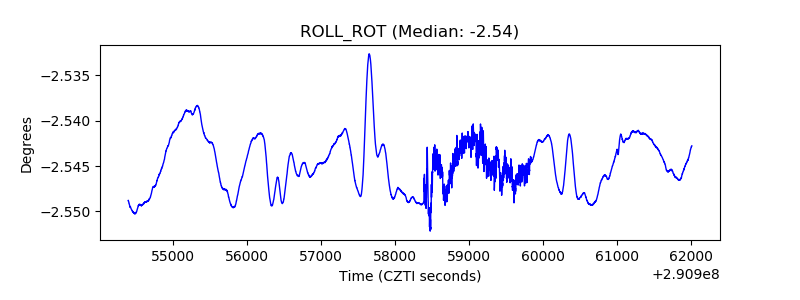 |
| _Roll_DEC | 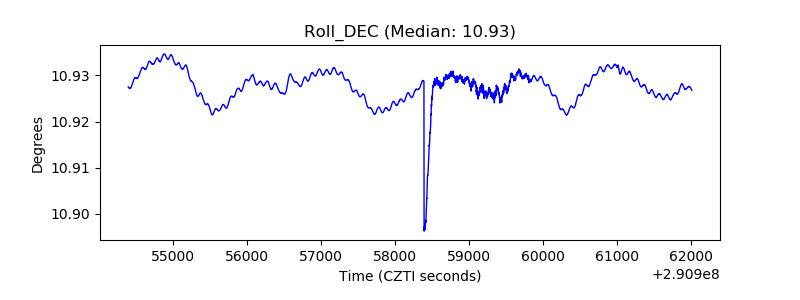 |
| _Roll_RA | 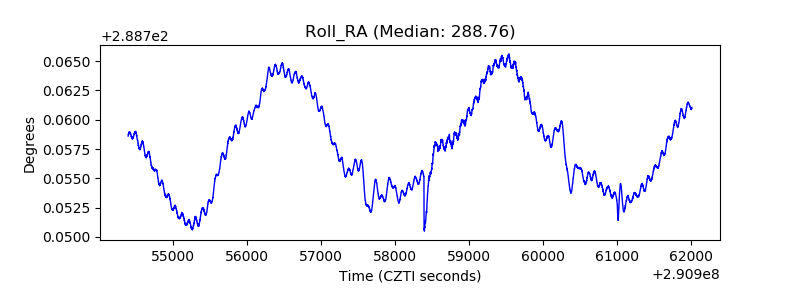 |
| Veto Counter | 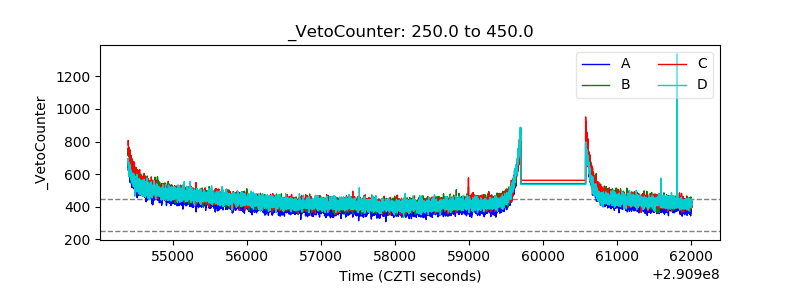 |