| Param | Original file | Final file |
|---|---|---|
| Filename | modeM0/AS1A05_173T01_9000002812_18820cztM0_level2.evt | modeM0/AS1A05_173T01_9000002812_18820cztM0_level2_quad_clean.evt |
| Size (bytes) | 532,229,760 | 80,133,120 |
| Size | 507.6 MB | 76.4 MB |
| Events in quadrant A | 4,046,285 | 486,762 |
| Events in quadrant B | 3,996,373 | 492,852 |
| Events in quadrant C | 3,787,077 | 469,955 |
| Events in quadrant D | 3,787,922 | 462,980 |
| Mode SS | |||
|---|---|---|---|
| Quadrant | BADHDUFLAG | Total packets | Discarded packets |
| A | 0 | 150 | 0 |
| B | 0 | 150 | 0 |
| C | 0 | 150 | 0 |
| D | 0 | 150 | 0 |
| Mode M9 | |||
|---|---|---|---|
| Quadrant | BADHDUFLAG | Total packets | Discarded packets |
| A | 0 | 6 | 0 |
| B | 0 | 7 | 0 |
| C | 0 | 7 | 0 |
| D | 0 | 7 | 0 |
| Mode M0 | |||
|---|---|---|---|
| Quadrant | BADHDUFLAG | Total packets | Discarded packets |
| A | 0 | 16391 | 2 |
| B | 0 | 16359 | 2 |
| C | 0 | 15697 | 2 |
| D | 0 | 16129 | 2 |
| Quadrant | Total seconds | Saturated seconds | Saturation percentage |
|---|---|---|---|
| A | 7377 | 205 | 2.778907% |
| B | 7377 | 207 | 2.806019% |
| C | 7377 | 215 | 2.914464% |
| D | 7377 | 187 | 2.534906% |
Noise dominated data is calculated using 1-second bins in cleaned event files. If a bin has >2000 counts, and if more than 50% of those come from <1% of pixels, then it is considered to be noise-dominated and hence unusable.
| Quadrant | # 1 sec bins | Bins with >0 counts | Bins with >2000 counts | High rate bins dominated by noise | Noise dominated (total time) | Noise dominated (detector-on time) | Marked lightcurve |
|---|---|---|---|---|---|---|---|
| A | 7862 | 7378 | 29 | 29 | 0.37% | 0.39% | 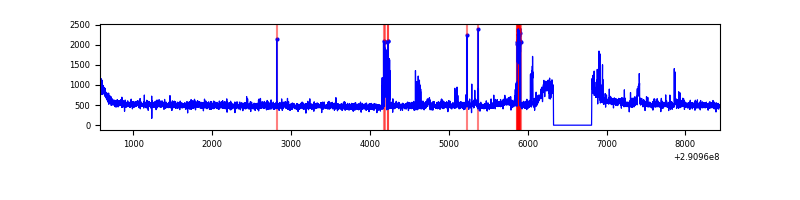 |
| B | 7862 | 7378 | 18 | 18 | 0.23% | 0.24% | 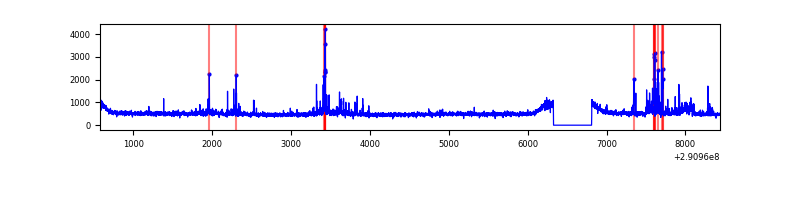 |
| C | 7862 | 7378 | 4 | 4 | 0.05% | 0.05% | 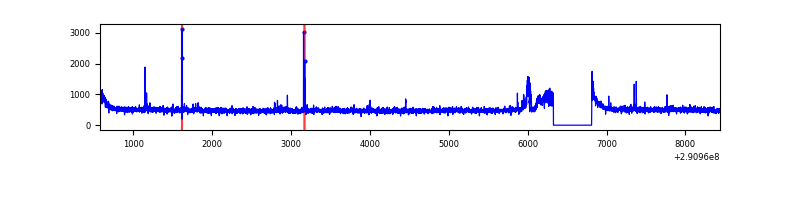 |
| D | 7862 | 7378 | 28 | 28 | 0.36% | 0.38% | 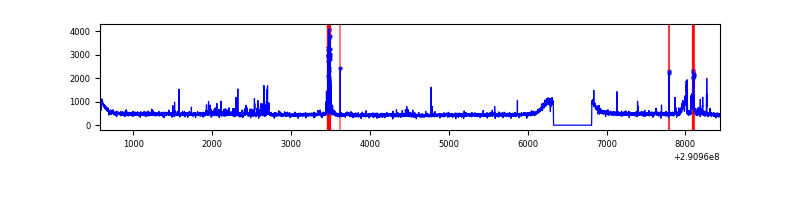 |
Top three noisy pixels from each quadrant. If the there are fewer than three noisy pixels in the level2.evt file, extra rows are filled as -1
| Pixel properties | Quadrant properties | ||||||
|---|---|---|---|---|---|---|---|
| Quadrant | DetID | PixID | Counts | Sigma | Mean | Median | Sigma |
| A | 8 | 144 | 352220 | 1813.28 | 948 | 927 | 193.7 |
| A | 9 | 143 | 31620 | 158.43 | 948 | 927 | 193.7 |
| A | 13 | 254 | 12327 | 58.84 | 948 | 927 | 193.7 |
| B | 4 | 216 | 90099 | 487.86 | 940 | 917 | 182.8 |
| B | 7 | 220 | 67735 | 365.52 | 940 | 917 | 182.8 |
| B | 6 | 36 | 50778 | 272.76 | 940 | 917 | 182.8 |
| C | 14 | 238 | 139473 | 642.66 | 904 | 910 | 215.6 |
| C | 3 | 233 | 80152 | 367.53 | 904 | 910 | 215.6 |
| C | 0 | 207 | 40807 | 185.04 | 904 | 910 | 215.6 |
| D | 7 | 38 | 224787 | 983.72 | 922 | 896 | 227.6 |
| D | 7 | 238 | 44753 | 192.7 | 922 | 896 | 227.6 |
| D | 2 | 234 | 31401 | 134.03 | 922 | 896 | 227.6 |
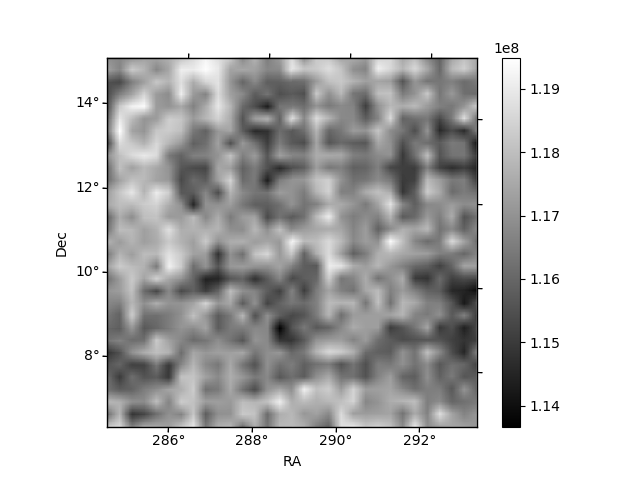
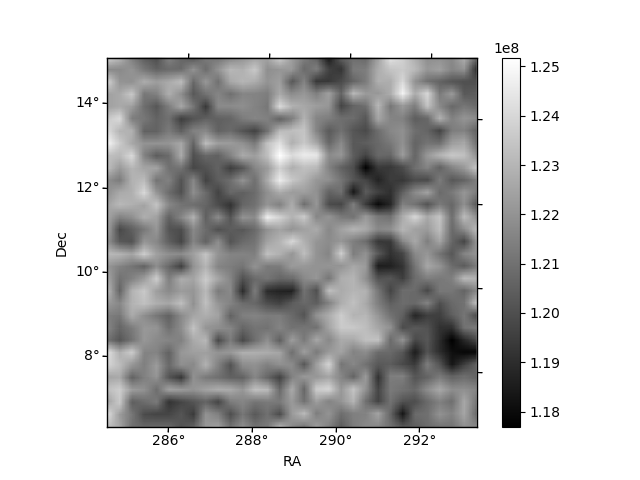
Histogram calculated using DETX and DETY for each event in the final _common_clean file
| Quadrant A | 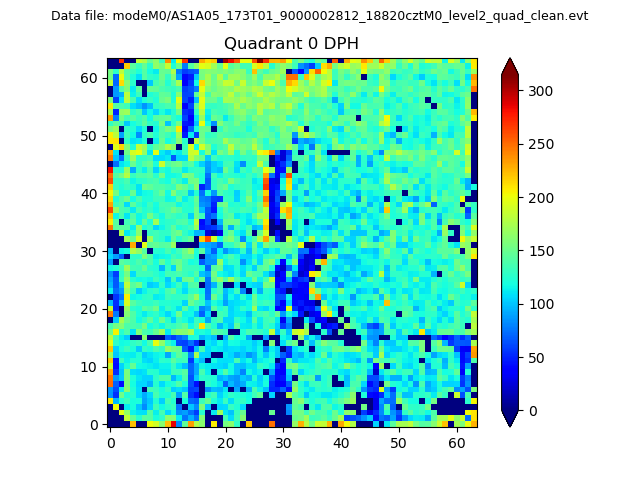 |
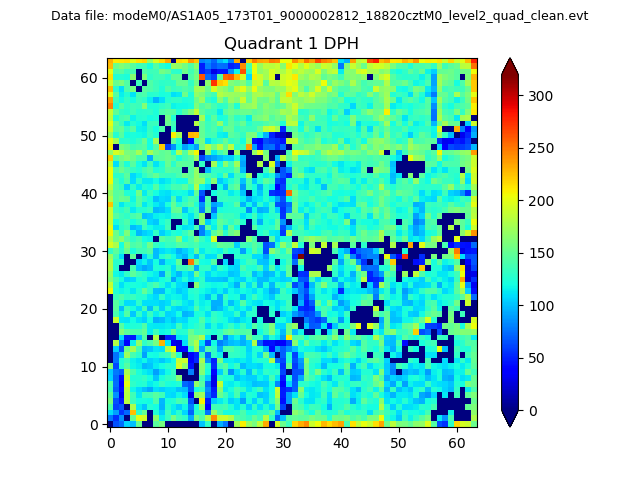 |
Quadrant B |
|---|---|---|---|
| Quadrant D | 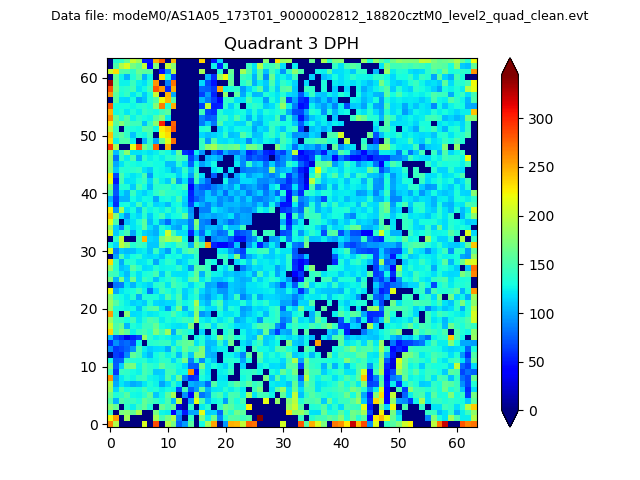 |
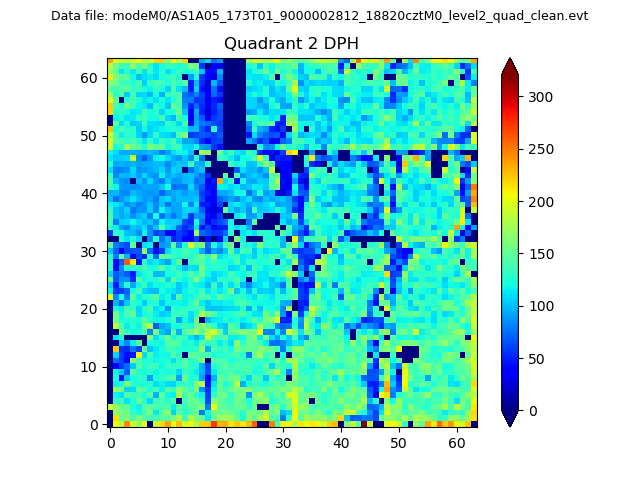 |
Quadrant C |
| Plot type | Count rate plots | Images |
|---|---|---|
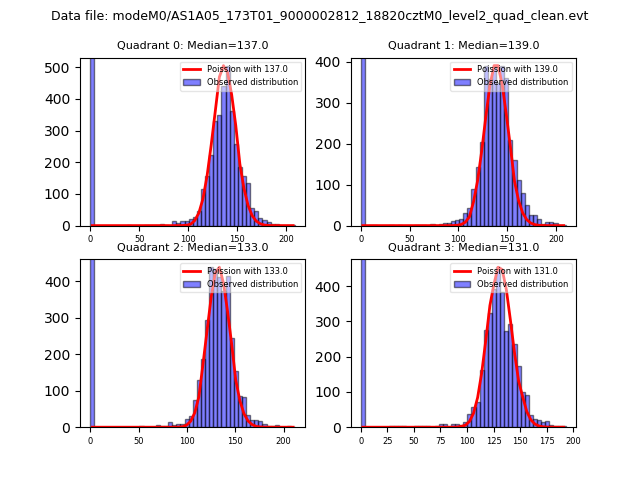
| Comparison with Poisson distribution Blue bars denote a histogram of data divided into 1 sec bins. Red curve is a Poisson curve with rate = median count rate of data. |
 |
 |
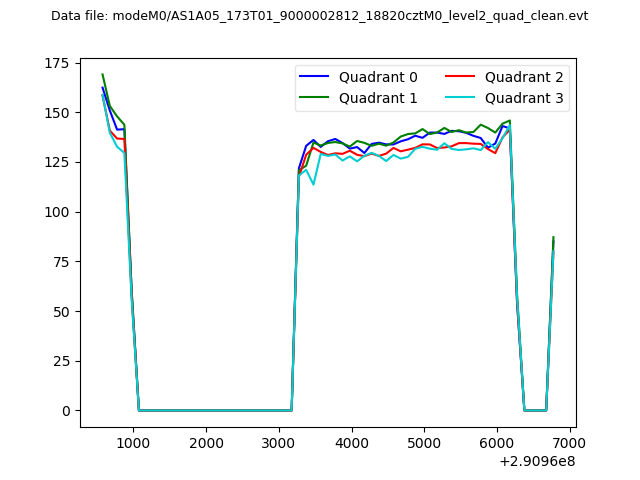
| Quadrant-wise count rates Data is divided into 100 sec bins |
 |
|
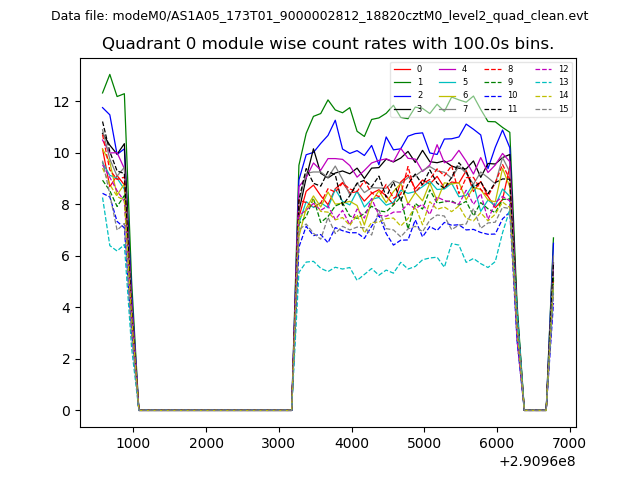
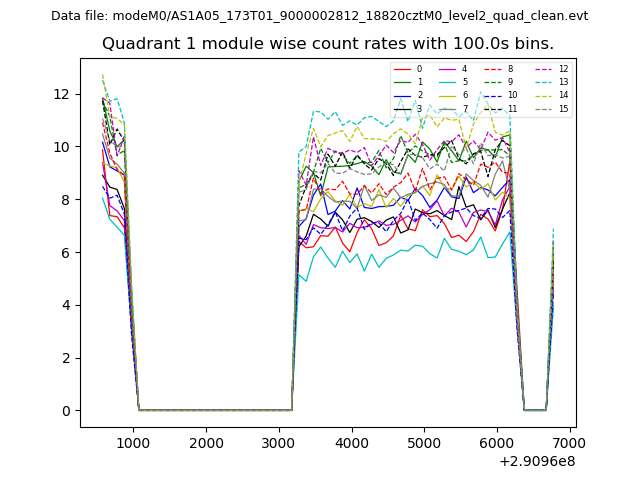
| Module-wise count rates for Quadrant A Data is divided into 100 sec bins |
 |
 |
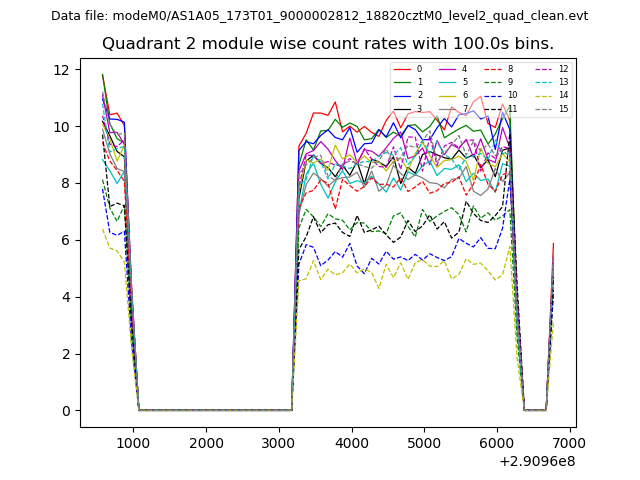
| Module-wise count rates for Quadrant B Data is divided into 100 sec bins |
 |
 |
| Module-wise count rates for Quadrant C Data is divided into 100 sec bins |
 |
 |
| Module-wise count rates for Quadrant D Data is divided into 100 sec bins |
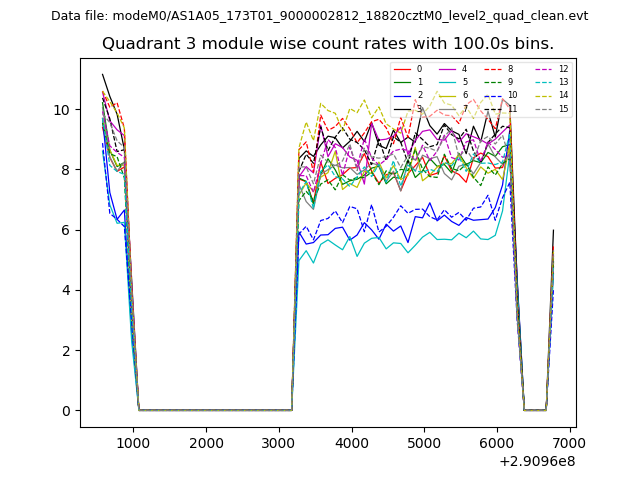 |
 |
| Parameter | Plot |
|---|---|
| CZT HV Monitor | 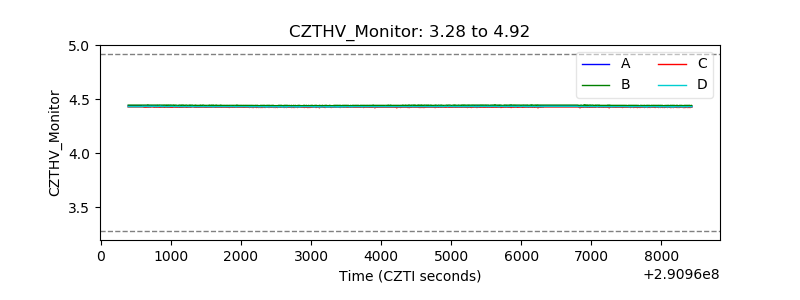 |
| D_VDD | 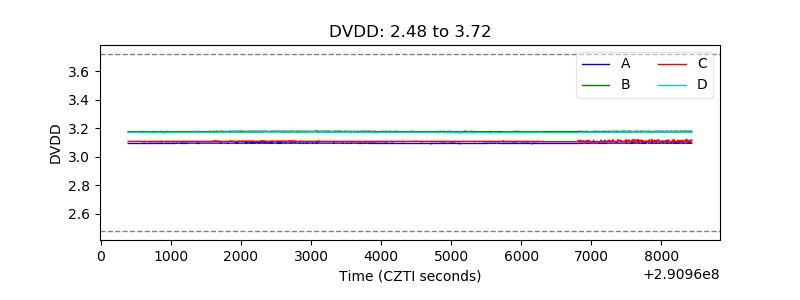 |
| Temperature 1 | 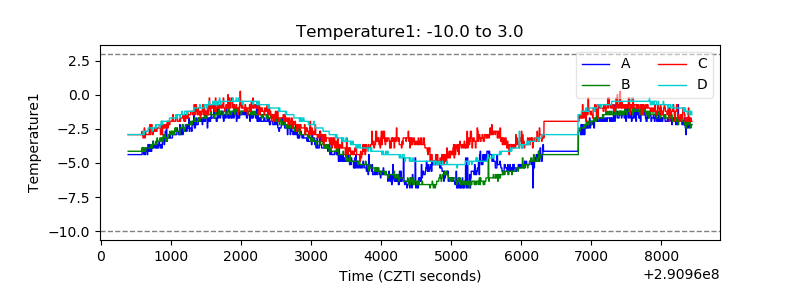 |
| Veto HV Monitor |  |
| Veto LLD | 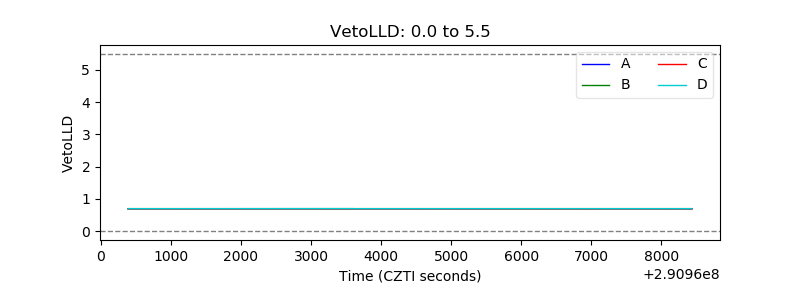 |
| Alpha Counter | 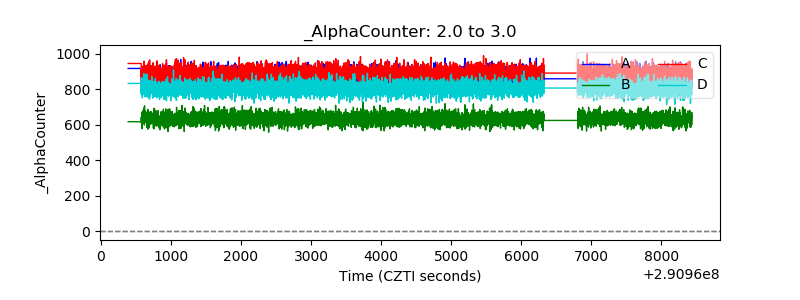 |
| _CPM_Rate | 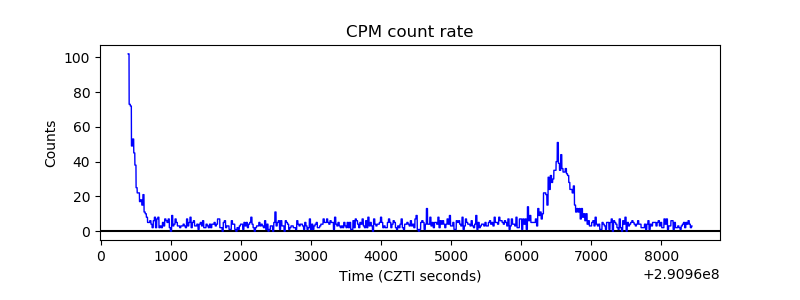 |
| CZT Counter | 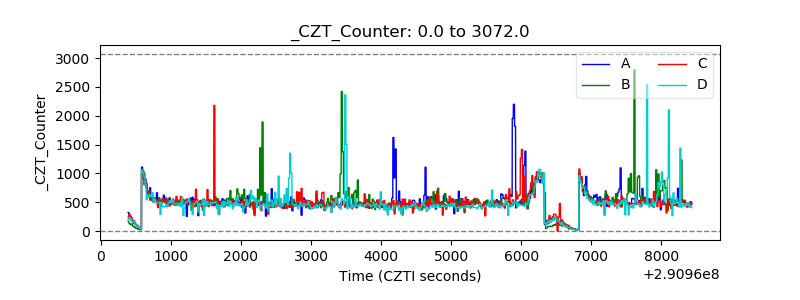 |
| +2.5 Volts monitor |  |
| +5 Volts monitor |  |
| _ROLL_ROT | 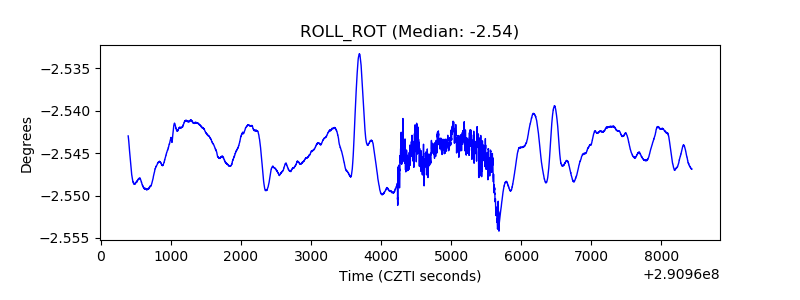 |
| _Roll_DEC | 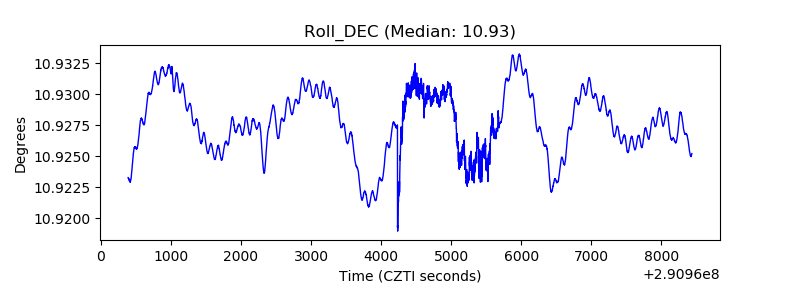 |
| _Roll_RA | 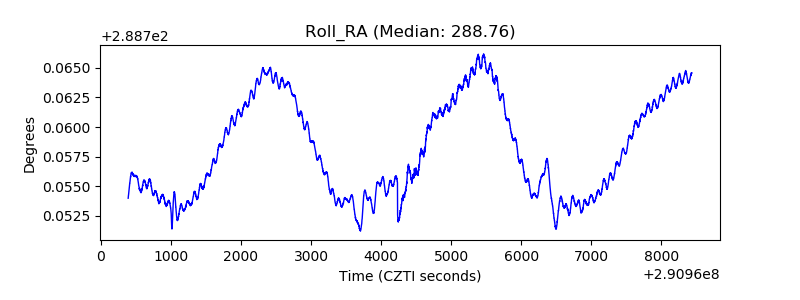 |
| Veto Counter | 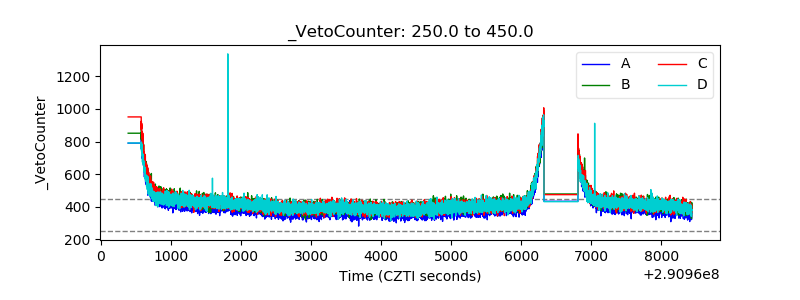 |