| Param | Original file | Final file |
|---|---|---|
| Filename | modeM0/AS1A05_173T01_9000002812_18821cztM0_level2.evt | modeM0/AS1A05_173T01_9000002812_18821cztM0_level2_quad_clean.evt |
| Size (bytes) | 353,917,440 | 69,658,560 |
| Size | 337.5 MB | 66.4 MB |
| Events in quadrant A | 2,815,758 | 447,376 |
| Events in quadrant B | 2,578,508 | 450,563 |
| Events in quadrant C | 2,591,683 | 434,267 |
| Events in quadrant D | 2,391,175 | 425,888 |
| Mode SS | |||
|---|---|---|---|
| Quadrant | BADHDUFLAG | Total packets | Discarded packets |
| A | 0 | 106 | 2 |
| B | 0 | 106 | 2 |
| C | 0 | 107 | 3 |
| D | 0 | 107 | 3 |
| Mode M9 | |||
|---|---|---|---|
| Quadrant | BADHDUFLAG | Total packets | Discarded packets |
| A | 0 | 2 | 0 |
| B | 0 | 3 | 1 |
| C | 0 | 4 | 2 |
| D | 0 | 3 | 1 |
| Mode M0 | |||
|---|---|---|---|
| Quadrant | BADHDUFLAG | Total packets | Discarded packets |
| A | 0 | 11808 | 349 |
| B | 0 | 11373 | 597 |
| C | 0 | 11063 | 333 |
| D | 0 | 10944 | 405 |
| Quadrant | Total seconds | Saturated seconds | Saturation percentage |
|---|---|---|---|
| A | 5006 | 86 | 1.717938% |
| B | 4991 | 122 | 2.444400% |
| C | 5007 | 147 | 2.935890% |
| D | 5005 | 73 | 1.458541% |
Noise dominated data is calculated using 1-second bins in cleaned event files. If a bin has >2000 counts, and if more than 50% of those come from <1% of pixels, then it is considered to be noise-dominated and hence unusable.
| Quadrant | # 1 sec bins | Bins with >0 counts | Bins with >2000 counts | High rate bins dominated by noise | Noise dominated (total time) | Noise dominated (detector-on time) | Marked lightcurve |
|---|---|---|---|---|---|---|---|
| A | 5325 | 5037 | 2 | 2 | 0.04% | 0.04% | 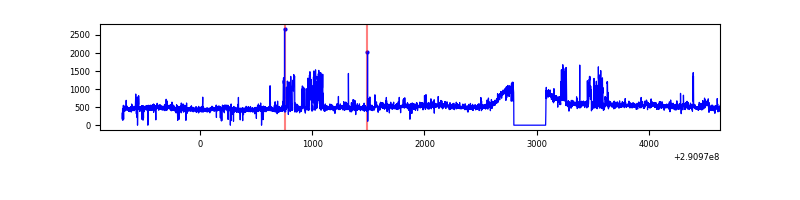 |
| B | 5323 | 5029 | 10 | 10 | 0.19% | 0.20% | 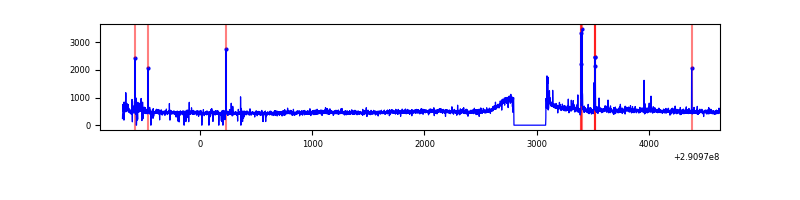 |
| C | 5322 | 5030 | 7 | 7 | 0.13% | 0.14% | 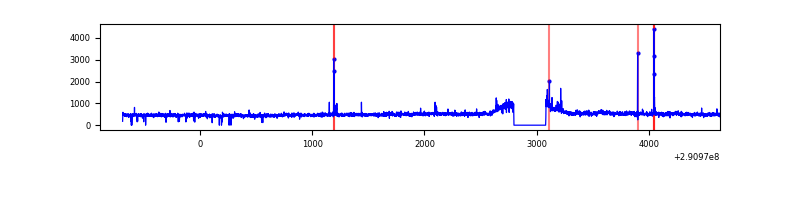 |
| D | 5524 | 5034 | 0 | 0 | 0.00% | 0.00% | 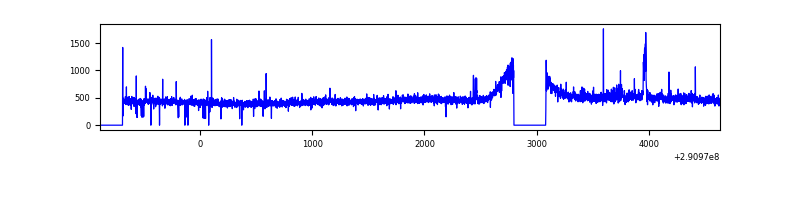 |
Top three noisy pixels from each quadrant. If the there are fewer than three noisy pixels in the level2.evt file, extra rows are filled as -1
| Pixel properties | Quadrant properties | ||||||
|---|---|---|---|---|---|---|---|
| Quadrant | DetID | PixID | Counts | Sigma | Mean | Median | Sigma |
| A | 8 | 144 | 354366 | 2748.27 | 630 | 618 | 128.7 |
| A | 9 | 143 | 26134 | 198.23 | 630 | 618 | 128.7 |
| A | 13 | 254 | 8553 | 61.65 | 630 | 618 | 128.7 |
| B | 6 | 36 | 43956 | 350.77 | 626 | 610 | 123.6 |
| B | 4 | 216 | 23556 | 185.69 | 626 | 610 | 123.6 |
| B | 7 | 220 | 17602 | 137.51 | 626 | 610 | 123.6 |
| C | 14 | 238 | 92271 | 640.52 | 602 | 607 | 143.1 |
| C | 3 | 233 | 84850 | 588.67 | 602 | 607 | 143.1 |
| C | 0 | 207 | 33055 | 226.74 | 602 | 607 | 143.1 |
| D | 12 | 225 | 25951 | 166.15 | 615 | 597 | 152.6 |
| D | 2 | 234 | 23609 | 150.8 | 615 | 597 | 152.6 |
| D | 15 | 0 | 19492 | 123.82 | 615 | 597 | 152.6 |
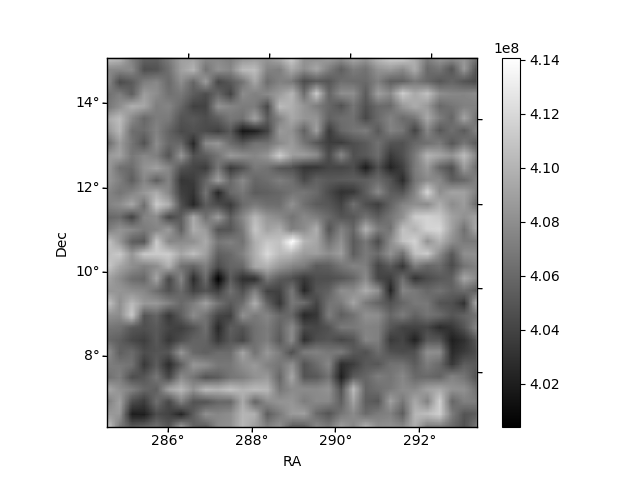
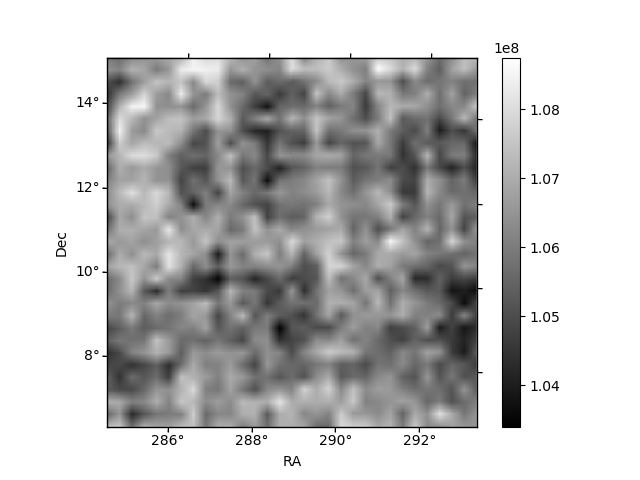
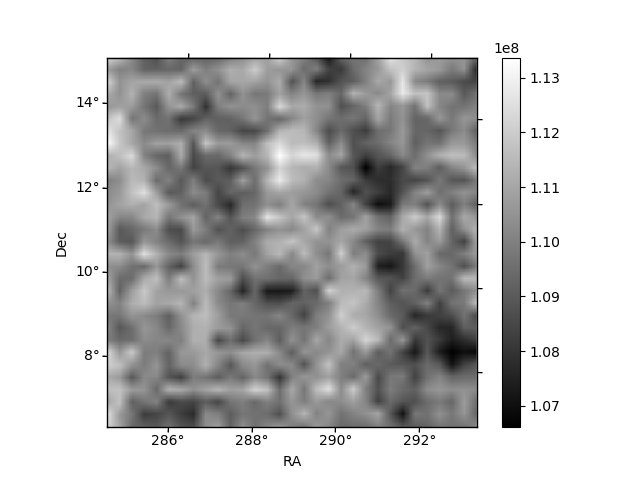
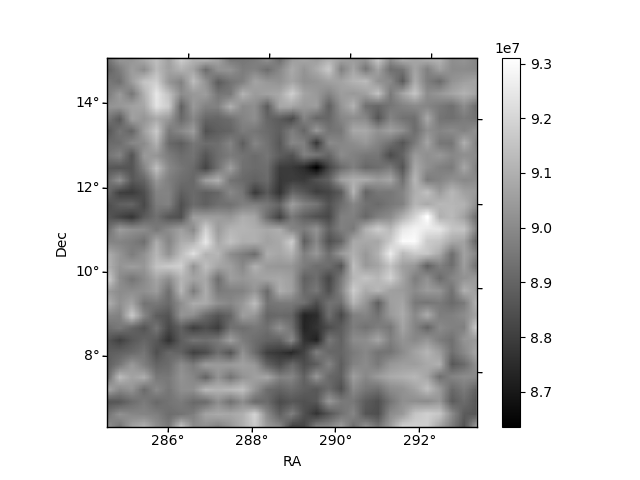
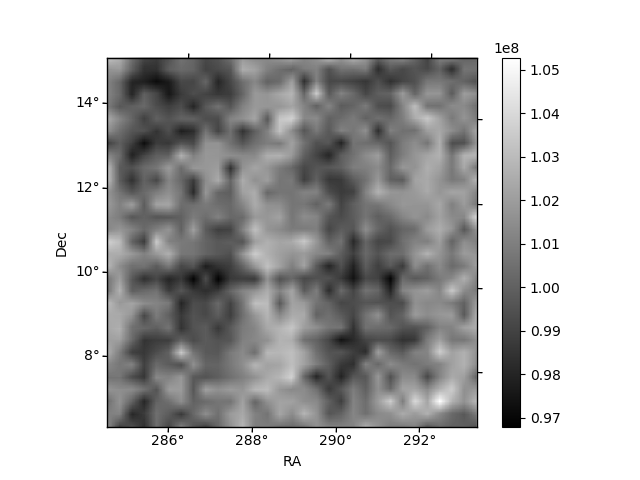
Histogram calculated using DETX and DETY for each event in the final _common_clean file
| Quadrant A | 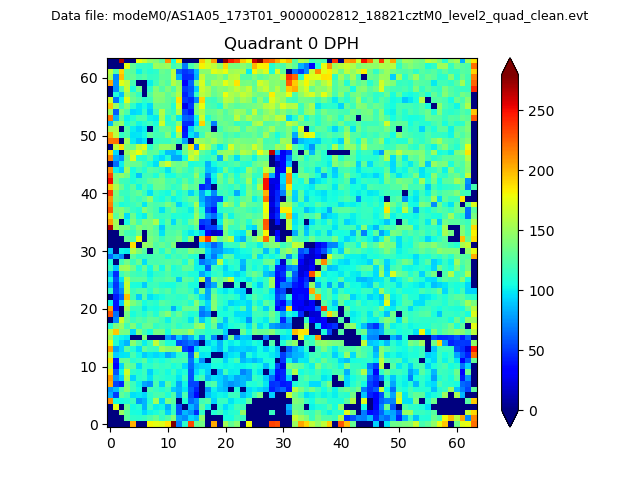 |
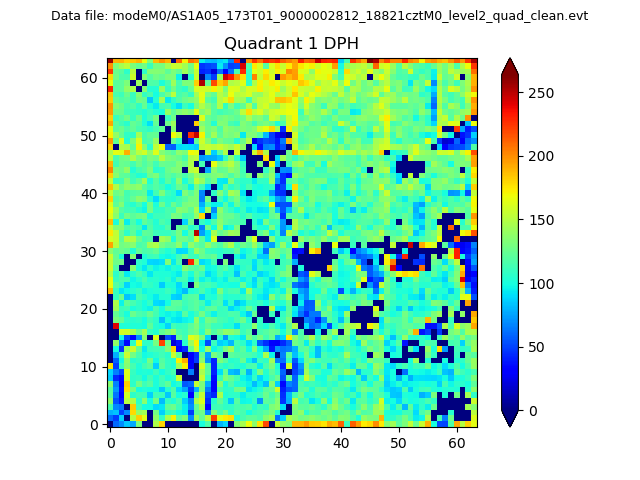 |
Quadrant B |
|---|---|---|---|
| Quadrant D |  |
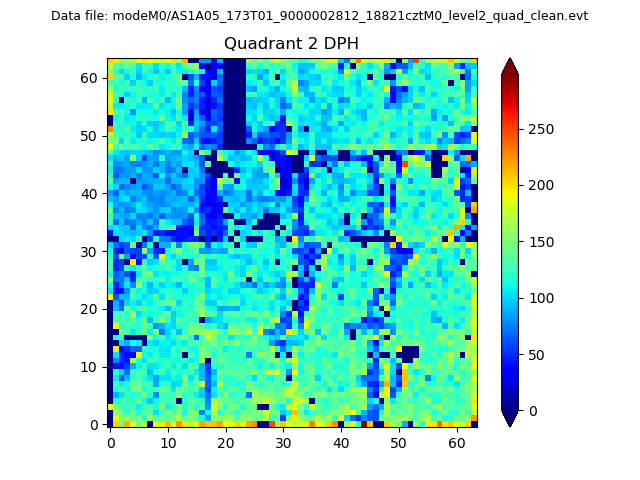 |
Quadrant C |
| Plot type | Count rate plots | Images |
|---|---|---|
| Comparison with Poisson distribution Blue bars denote a histogram of data divided into 1 sec bins. Red curve is a Poisson curve with rate = median count rate of data. |
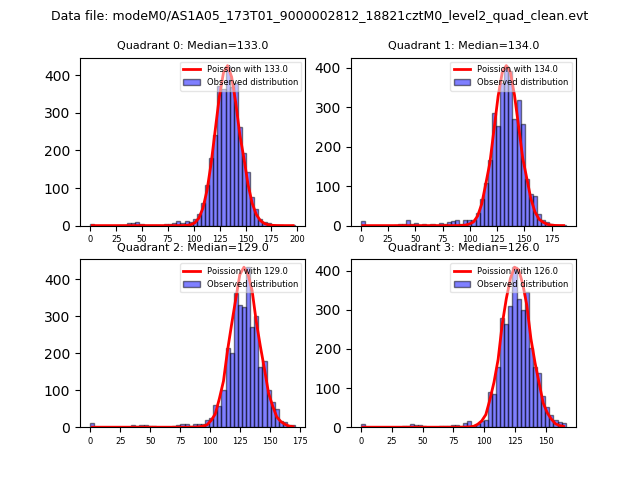 |
 |
| Quadrant-wise count rates Data is divided into 100 sec bins |
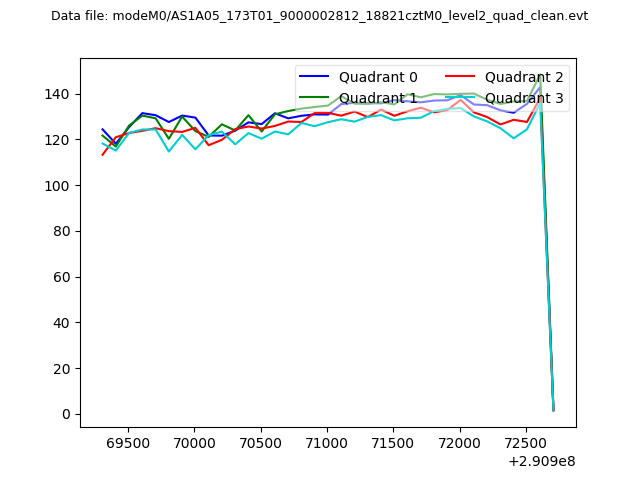 |
|
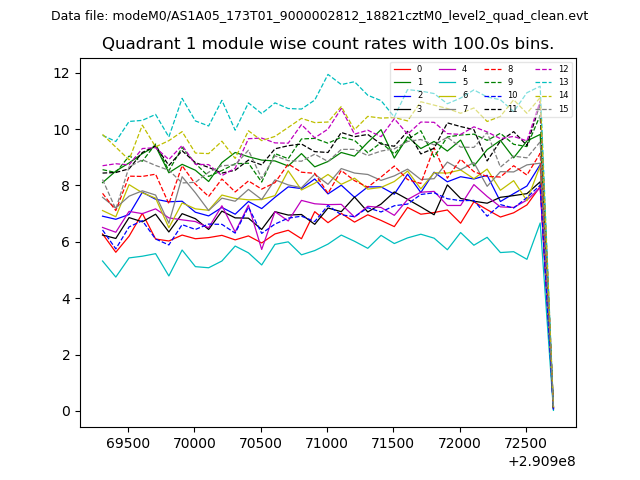
| Module-wise count rates for Quadrant A Data is divided into 100 sec bins |
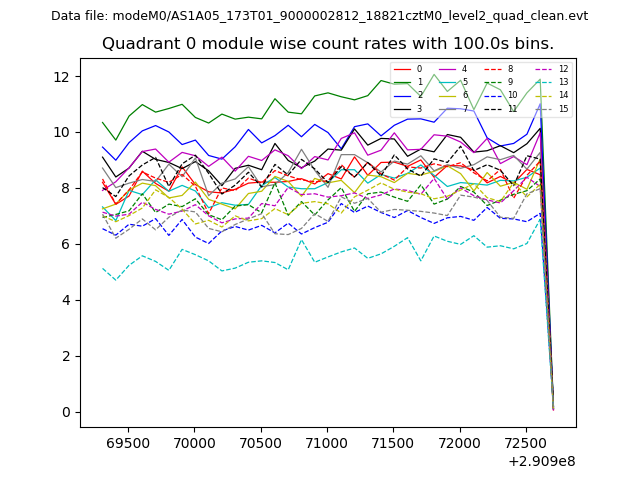 |
 |
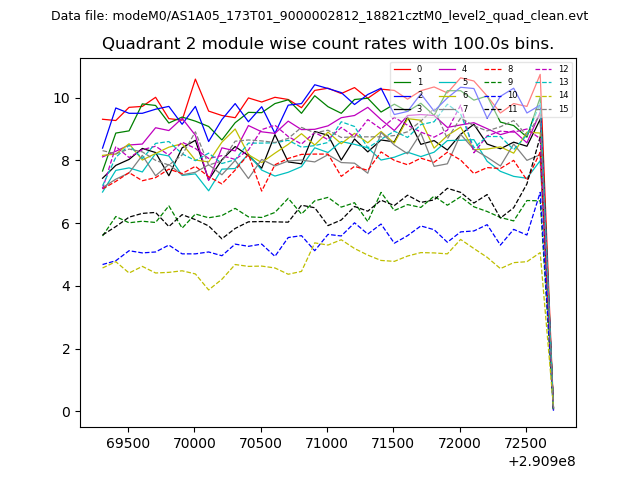
| Module-wise count rates for Quadrant B Data is divided into 100 sec bins |
 |
 |
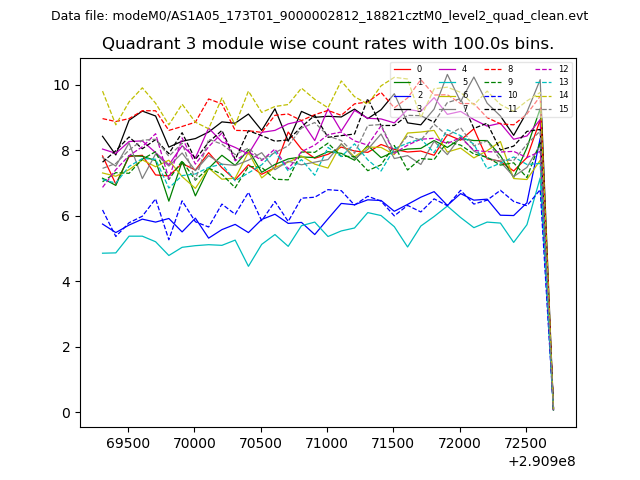
| Module-wise count rates for Quadrant C Data is divided into 100 sec bins |
 |
 |
| Module-wise count rates for Quadrant D Data is divided into 100 sec bins |
 |
 |
| Parameter | Plot |
|---|---|
| CZT HV Monitor | 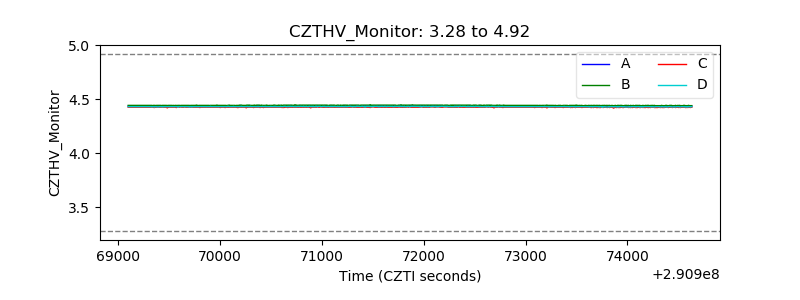 |
| D_VDD | 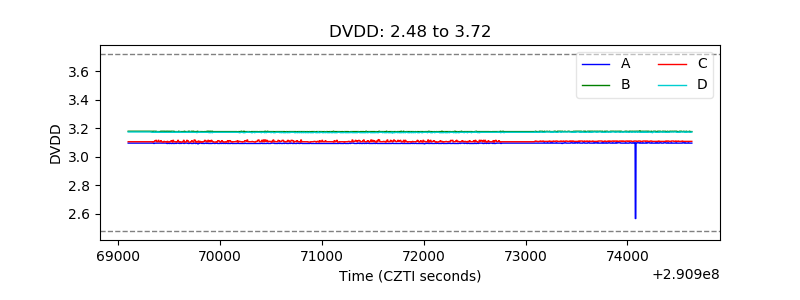 |
| Temperature 1 | 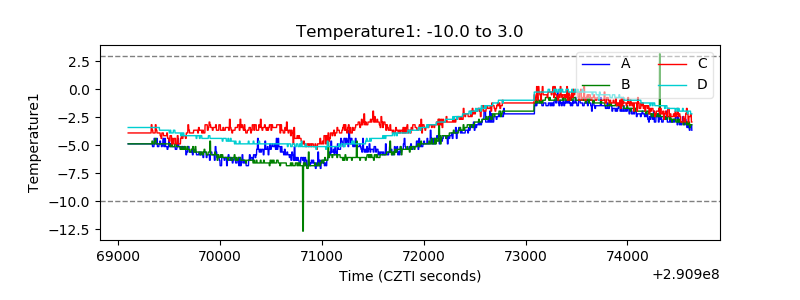 |
| Veto HV Monitor |  |
| Veto LLD | 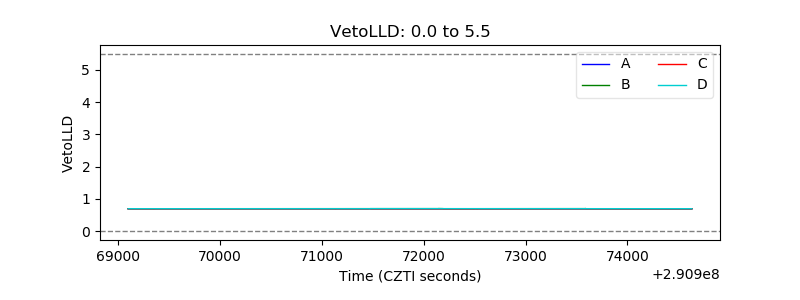 |
| Alpha Counter | 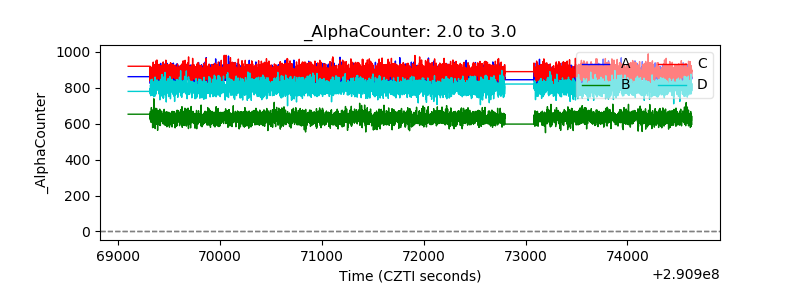 |
| _CPM_Rate | 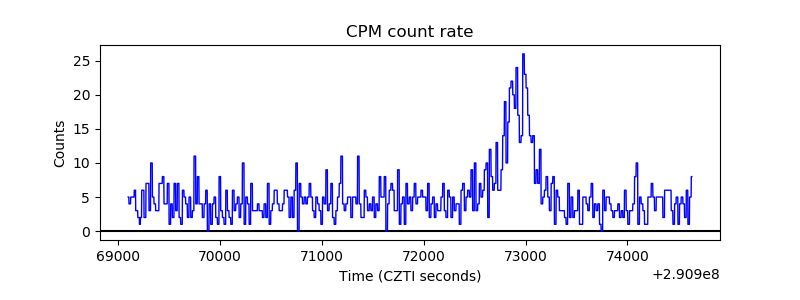 |
| CZT Counter | 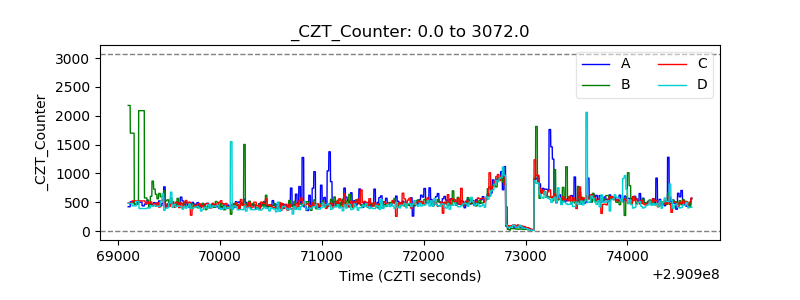 |
| +2.5 Volts monitor | 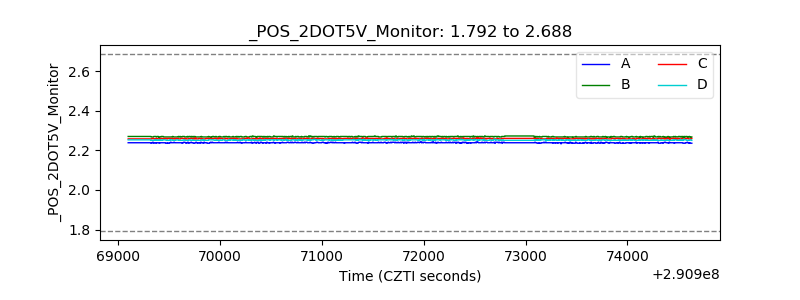 |
| +5 Volts monitor | 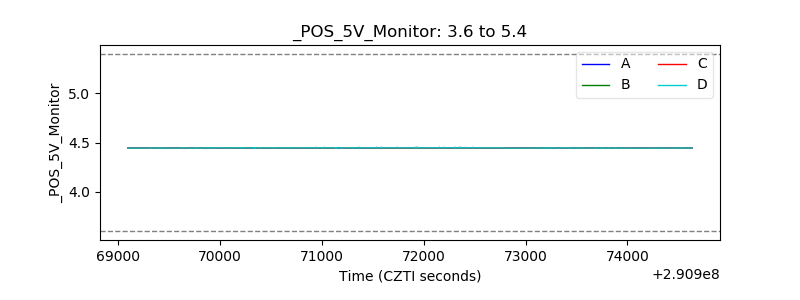 |
| _ROLL_ROT | 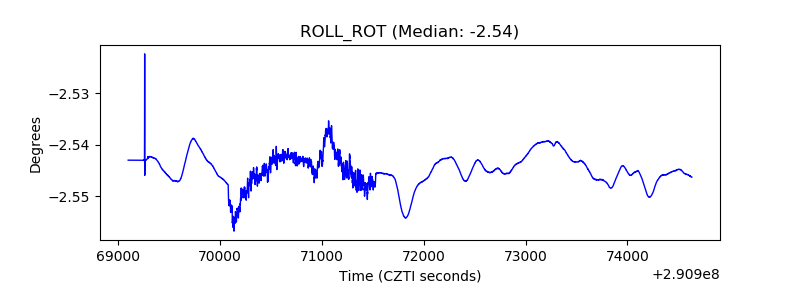 |
| _Roll_DEC | 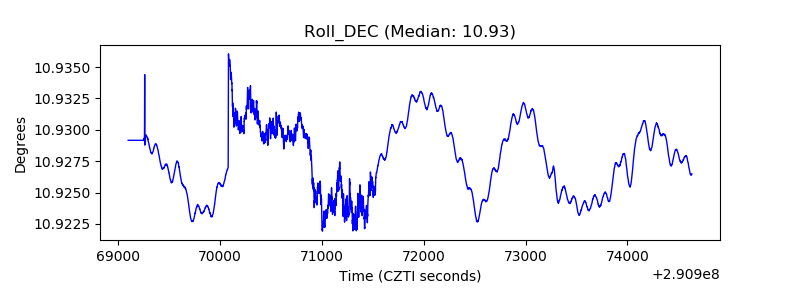 |
| _Roll_RA | 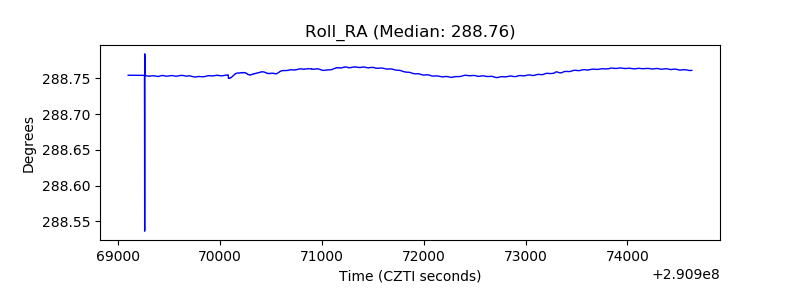 |
| Veto Counter | 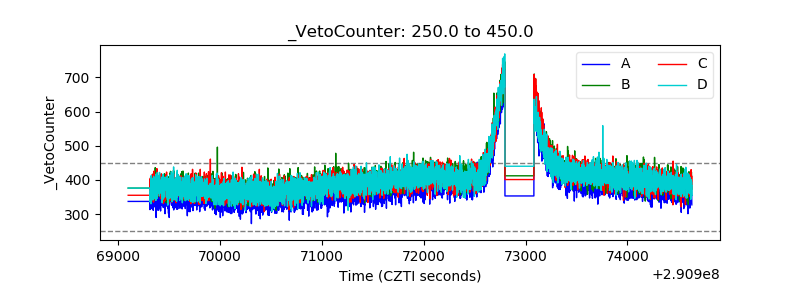 |