| Param | Original file | Final file |
|---|---|---|
| Filename | modeM0/AS1A05_173T01_9000002812_18822cztM0_level2.evt | modeM0/AS1A05_173T01_9000002812_18822cztM0_level2_quad_clean.evt |
| Size (bytes) | 547,793,280 | 79,148,160 |
| Size | 522.4 MB | 75.5 MB |
| Events in quadrant A | 3,696,589 | 482,245 |
| Events in quadrant B | 3,658,743 | 485,546 |
| Events in quadrant C | 3,607,083 | 468,291 |
| Events in quadrant D | 5,135,049 | 455,698 |
| Mode SS | |||
|---|---|---|---|
| Quadrant | BADHDUFLAG | Total packets | Discarded packets |
| A | 0 | 148 | 0 |
| B | 0 | 148 | 0 |
| C | 0 | 148 | 0 |
| D | 0 | 148 | 0 |
| Mode M9 | |||
|---|---|---|---|
| Quadrant | BADHDUFLAG | Total packets | Discarded packets |
| A | 0 | 3 | 0 |
| B | 0 | 3 | 0 |
| C | 0 | 3 | 0 |
| D | 0 | 3 | 0 |
| Mode M0 | |||
|---|---|---|---|
| Quadrant | BADHDUFLAG | Total packets | Discarded packets |
| A | 0 | 15385 | 1 |
| B | 0 | 15315 | 1 |
| C | 0 | 15138 | 1 |
| D | 0 | 20248 | 1 |
| Quadrant | Total seconds | Saturated seconds | Saturation percentage |
|---|---|---|---|
| A | 7249 | 68 | 0.938060% |
| B | 7248 | 85 | 1.172737% |
| C | 7248 | 128 | 1.766004% |
| D | 7248 | 836 | 11.534216% |
Noise dominated data is calculated using 1-second bins in cleaned event files. If a bin has >2000 counts, and if more than 50% of those come from <1% of pixels, then it is considered to be noise-dominated and hence unusable.
| Quadrant | # 1 sec bins | Bins with >0 counts | Bins with >2000 counts | High rate bins dominated by noise | Noise dominated (total time) | Noise dominated (detector-on time) | Marked lightcurve |
|---|---|---|---|---|---|---|---|
| A | 7584 | 7250 | 0 | 0 | 0.00% | 0.00% | 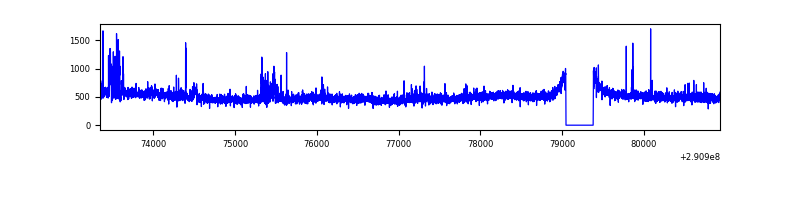 |
| B | 7583 | 7249 | 11 | 11 | 0.15% | 0.15% | 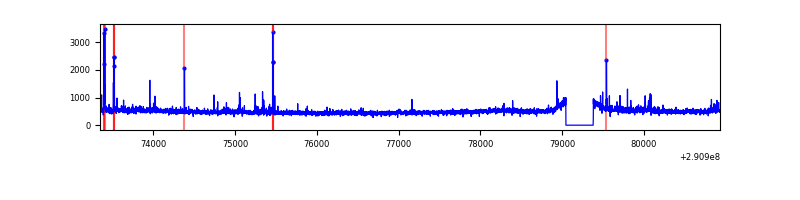 |
| C | 7583 | 7249 | 5 | 5 | 0.07% | 0.07% | 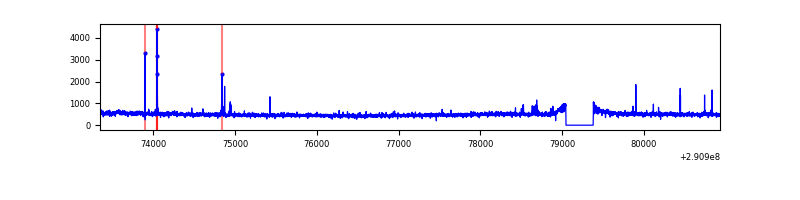 |
| D | 7583 | 7249 | 611 | 611 | 8.06% | 8.43% | 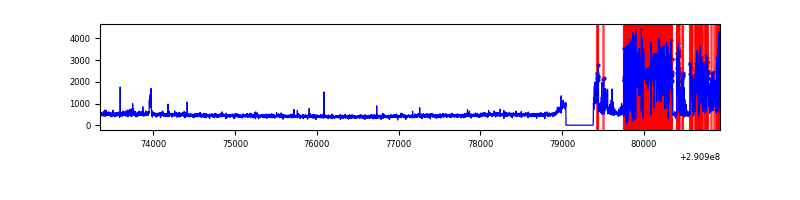 |
Top three noisy pixels from each quadrant. If the there are fewer than three noisy pixels in the level2.evt file, extra rows are filled as -1
| Pixel properties | Quadrant properties | ||||||
|---|---|---|---|---|---|---|---|
| Quadrant | DetID | PixID | Counts | Sigma | Mean | Median | Sigma |
| A | 8 | 144 | 215088 | 1174.66 | 896 | 877 | 182.4 |
| A | 8 | 205 | 14109 | 72.56 | 896 | 877 | 182.4 |
| A | 13 | 254 | 12324 | 62.77 | 896 | 877 | 182.4 |
| B | 4 | 216 | 51130 | 292.31 | 892 | 870 | 171.9 |
| B | 0 | 229 | 29186 | 164.69 | 892 | 870 | 171.9 |
| B | 6 | 36 | 28323 | 159.67 | 892 | 870 | 171.9 |
| C | 14 | 238 | 131511 | 646.46 | 855 | 863 | 202.1 |
| C | 3 | 233 | 78625 | 384.78 | 855 | 863 | 202.1 |
| C | 0 | 207 | 60087 | 293.05 | 855 | 863 | 202.1 |
| D | 12 | 110 | 900707 | 4465.28 | 817 | 793 | 201.5 |
| D | 1 | 52 | 536928 | 2660.25 | 817 | 793 | 201.5 |
| D | 7 | 38 | 495917 | 2456.75 | 817 | 793 | 201.5 |
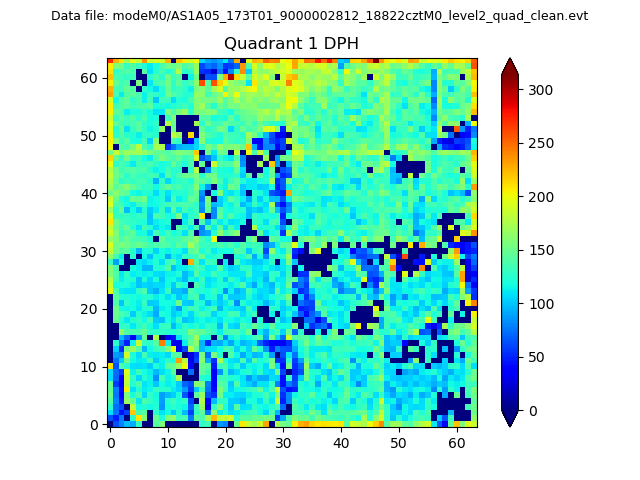
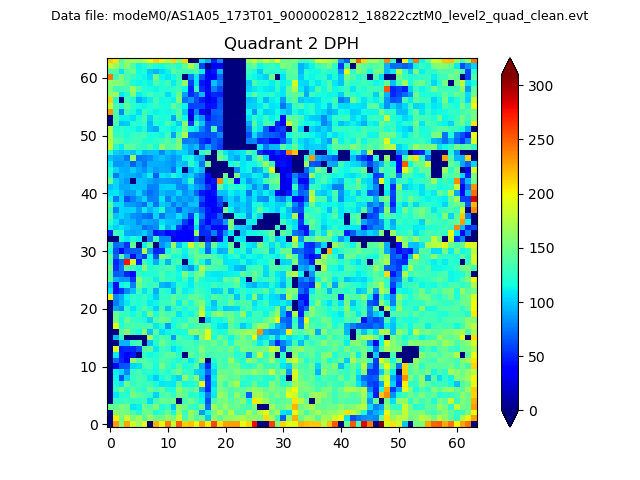
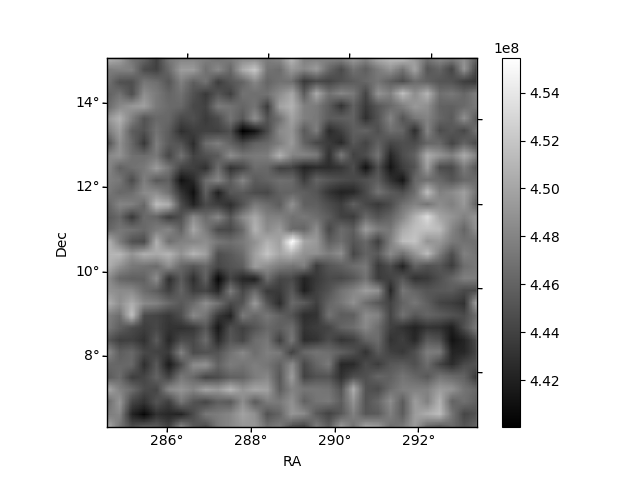
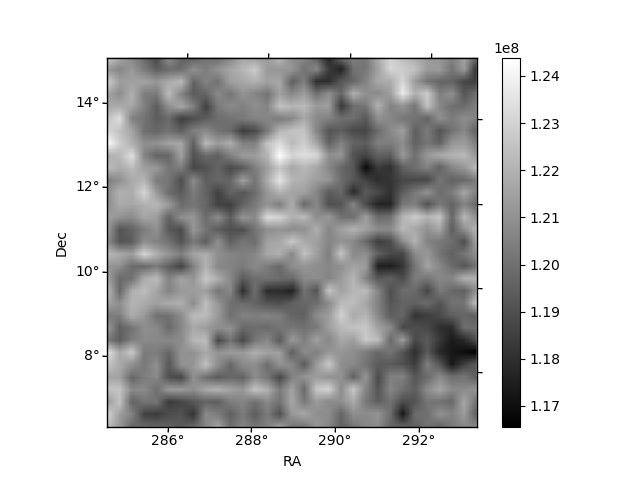
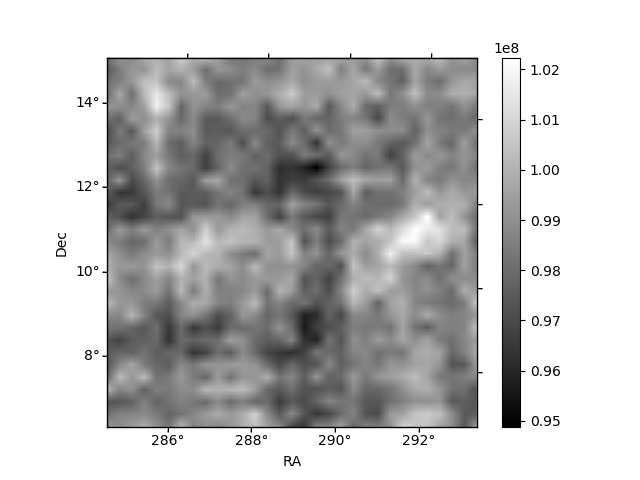
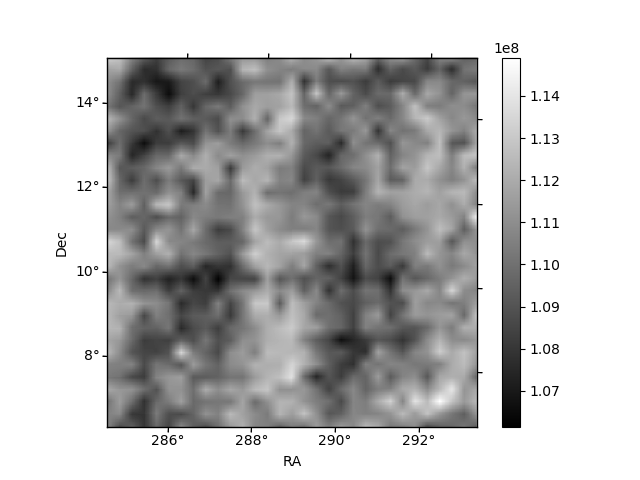
Histogram calculated using DETX and DETY for each event in the final _common_clean file
| Quadrant A |  |
 |
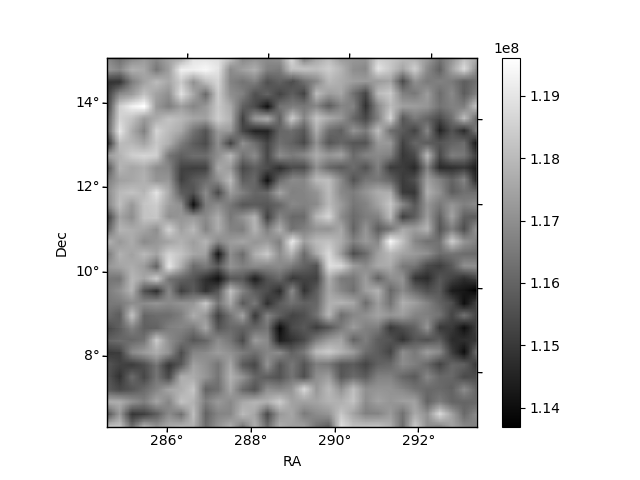
Quadrant B |
|---|---|---|---|
| Quadrant D | 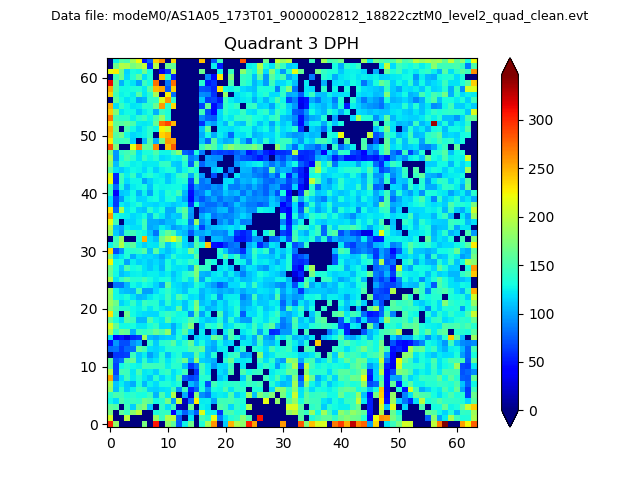 |
 |
Quadrant C |
| Plot type | Count rate plots | Images |
|---|---|---|
| Comparison with Poisson distribution Blue bars denote a histogram of data divided into 1 sec bins. Red curve is a Poisson curve with rate = median count rate of data. |
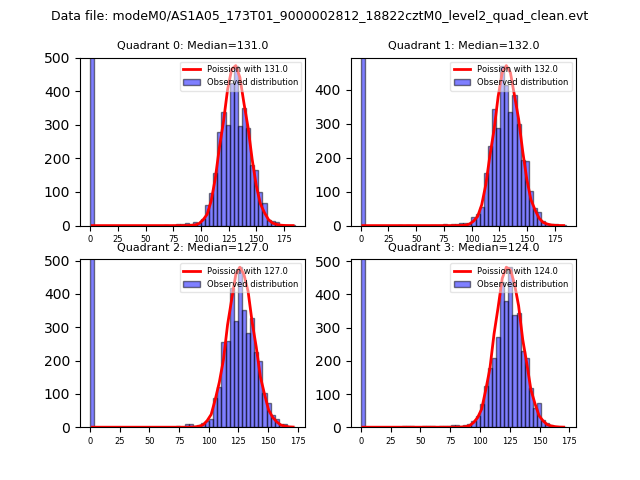 |
 |
| Quadrant-wise count rates Data is divided into 100 sec bins |
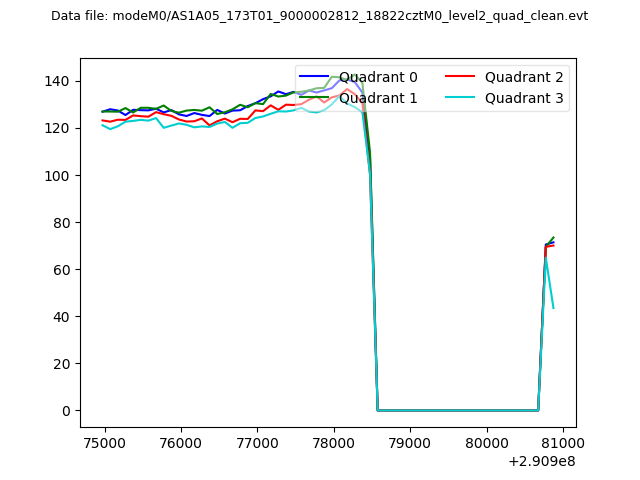 |
|
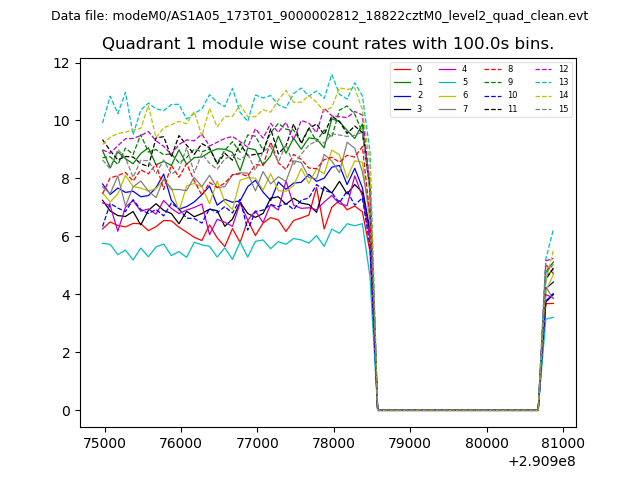
| Module-wise count rates for Quadrant A Data is divided into 100 sec bins |
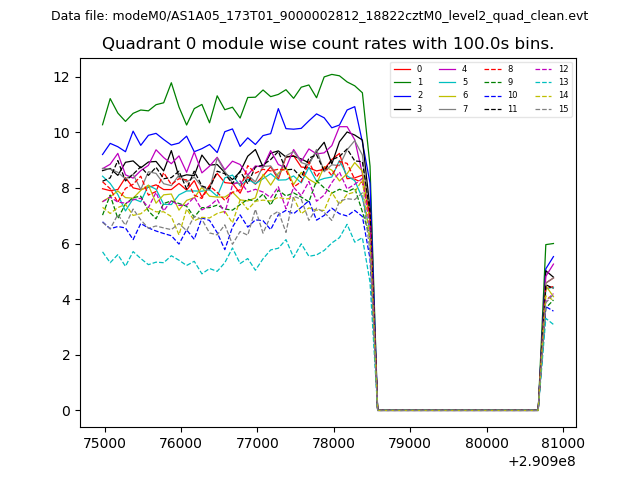 |
 |
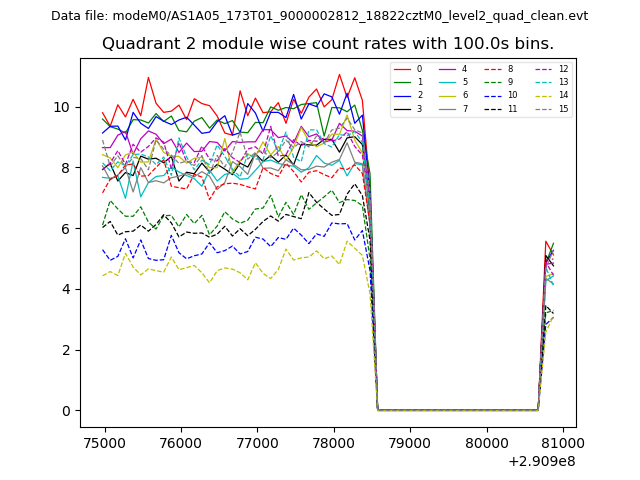
| Module-wise count rates for Quadrant B Data is divided into 100 sec bins |
 |
 |
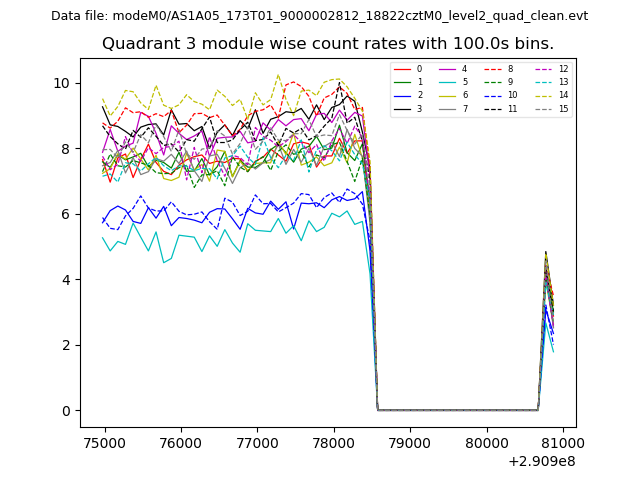
| Module-wise count rates for Quadrant C Data is divided into 100 sec bins |
 |
 |
| Module-wise count rates for Quadrant D Data is divided into 100 sec bins |
 |
 |
| Parameter | Plot |
|---|---|
| CZT HV Monitor | 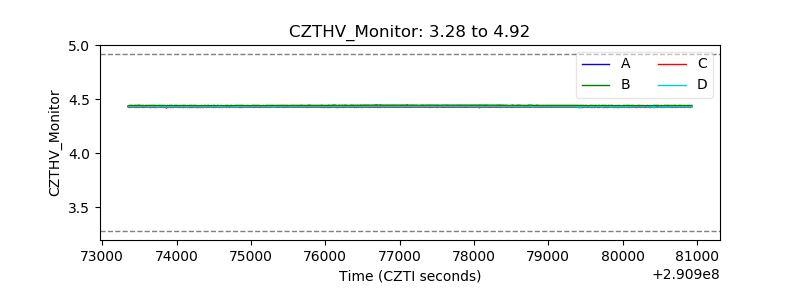 |
| D_VDD | 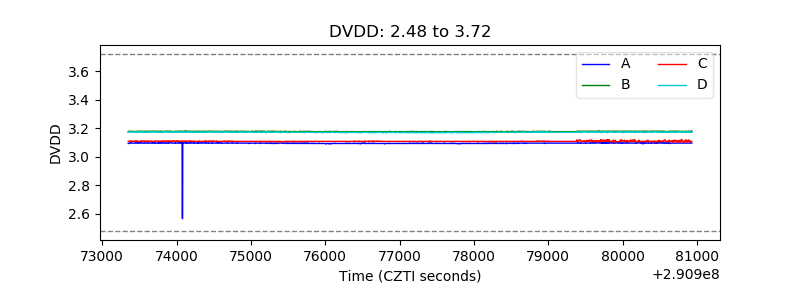 |
| Temperature 1 | 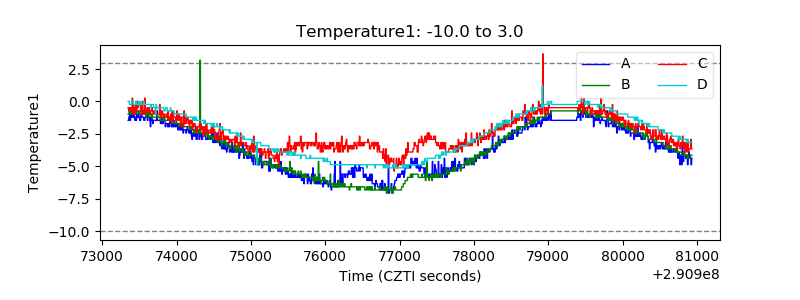 |
| Veto HV Monitor | 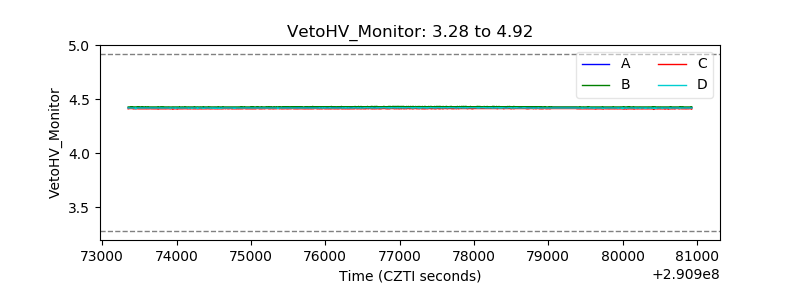 |
| Veto LLD | 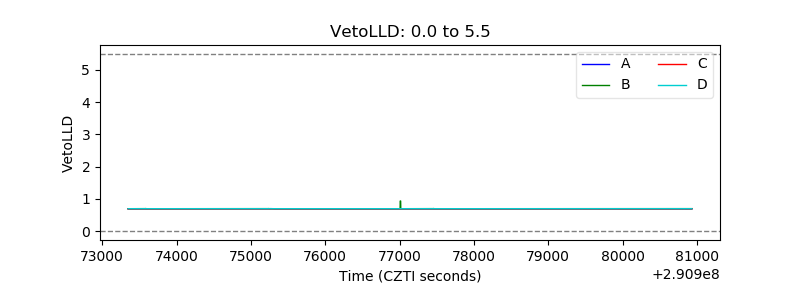 |
| Alpha Counter | 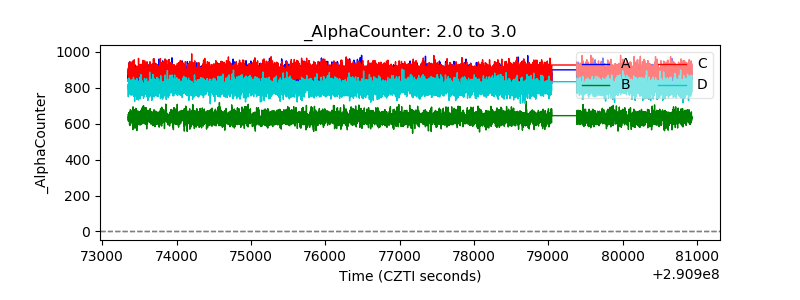 |
| _CPM_Rate | 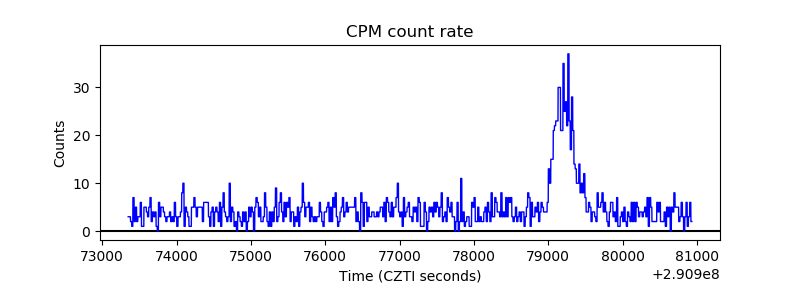 |
| CZT Counter | 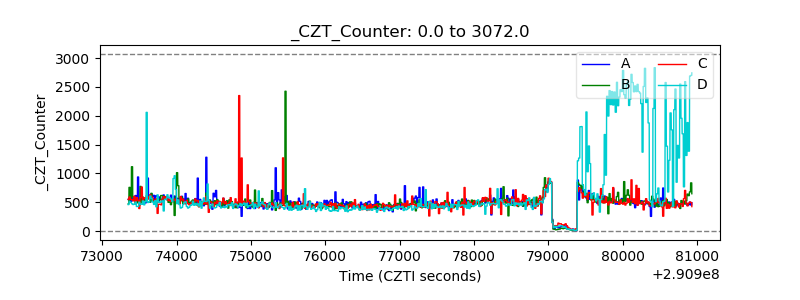 |
| +2.5 Volts monitor | 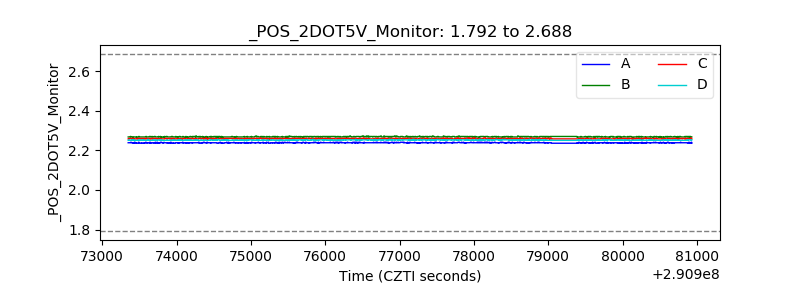 |
| +5 Volts monitor | 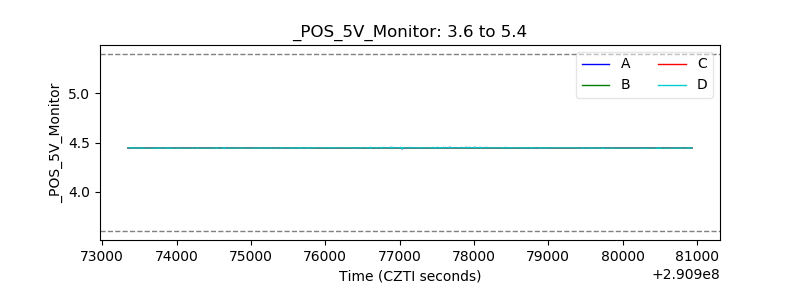 |
| _ROLL_ROT | 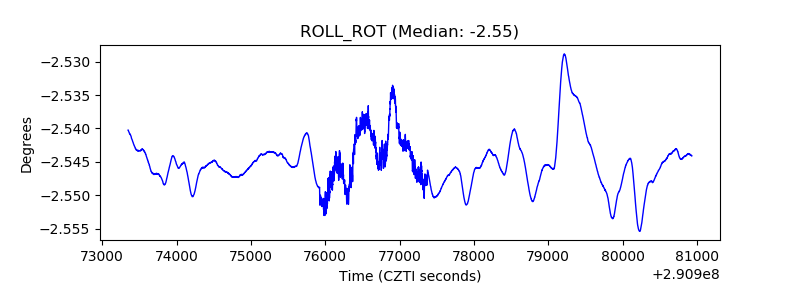 |
| _Roll_DEC | 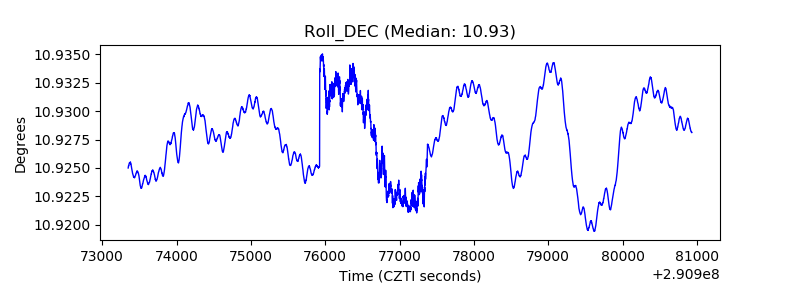 |
| _Roll_RA | 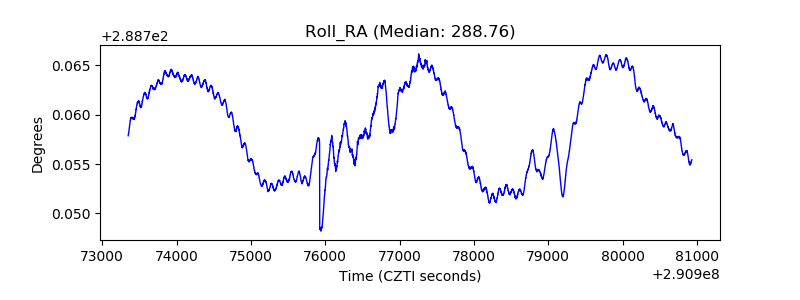 |
| Veto Counter | 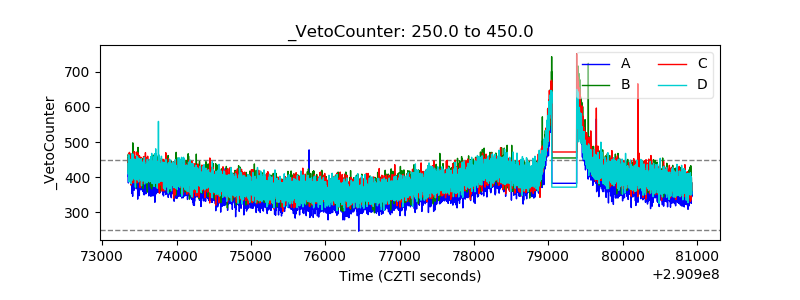 |