| Param | Original file | Final file |
|---|---|---|
| Filename | modeM0/AS1A05_173T01_9000002812_18825cztM0_level2.evt | modeM0/AS1A05_173T01_9000002812_18825cztM0_level2_quad_clean.evt |
| Size (bytes) | 1,334,304,000 | 209,401,920 |
| Size | 1.2 GB | 199.7 MB |
| Events in quadrant A | 7,465,098 | 1,365,108 |
| Events in quadrant B | 8,272,130 | 1,355,073 |
| Events in quadrant C | 7,559,191 | 1,322,883 |
| Events in quadrant D | 16,069,593 | 1,232,513 |
| Mode SS | |||
|---|---|---|---|
| Quadrant | BADHDUFLAG | Total packets | Discarded packets |
| A | 0 | 312 | 0 |
| B | 0 | 312 | 0 |
| C | 0 | 312 | 0 |
| D | 0 | 312 | 0 |
| Mode M9 | |||
|---|---|---|---|
| Quadrant | BADHDUFLAG | Total packets | Discarded packets |
| A | 0 | 12 | 0 |
| B | 0 | 12 | 0 |
| C | 0 | 12 | 0 |
| D | 0 | 12 | 0 |
| Mode M0 | |||
|---|---|---|---|
| Quadrant | BADHDUFLAG | Total packets | Discarded packets |
| A | 0 | 32280 | 2 |
| B | 0 | 34635 | 2 |
| C | 0 | 32427 | 2 |
| D | 0 | 58628 | 2 |
| Quadrant | Total seconds | Saturated seconds | Saturation percentage |
|---|---|---|---|
| A | 15456 | 99 | 0.640528% |
| B | 15456 | 430 | 2.782091% |
| C | 15456 | 203 | 1.313406% |
| D | 15457 | 3184 | 20.599081% |
Noise dominated data is calculated using 1-second bins in cleaned event files. If a bin has >2000 counts, and if more than 50% of those come from <1% of pixels, then it is considered to be noise-dominated and hence unusable.
| Quadrant | # 1 sec bins | Bins with >0 counts | Bins with >2000 counts | High rate bins dominated by noise | Noise dominated (total time) | Noise dominated (detector-on time) | Marked lightcurve |
|---|---|---|---|---|---|---|---|
| A | 16646 | 15458 | 10 | 10 | 0.06% | 0.06% | 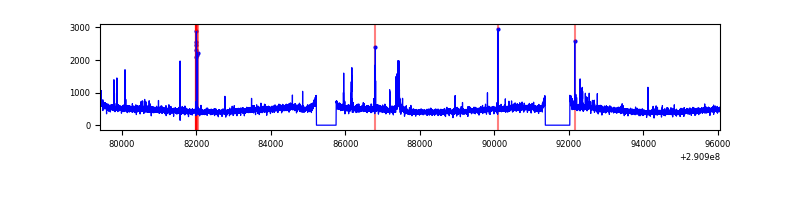 |
| B | 16646 | 15458 | 213 | 213 | 1.28% | 1.38% | 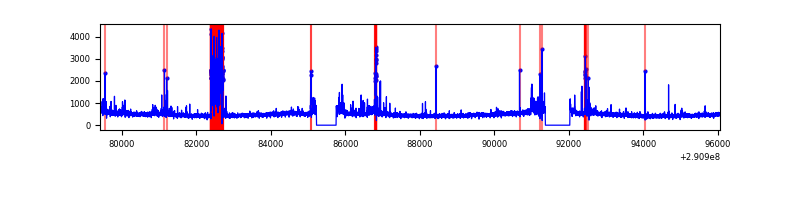 |
| C | 16646 | 15458 | 25 | 25 | 0.15% | 0.16% | 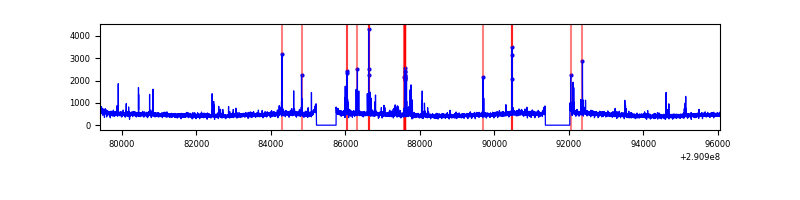 |
| D | 16647 | 15459 | 2855 | 2855 | 17.15% | 18.47% | 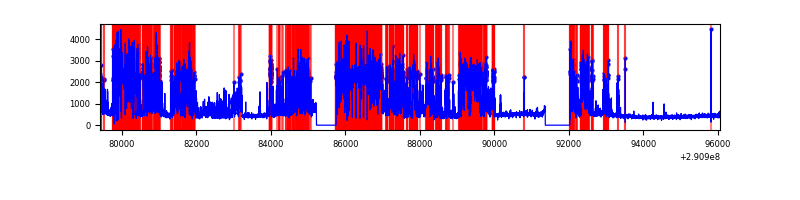 |
Top three noisy pixels from each quadrant. If the there are fewer than three noisy pixels in the level2.evt file, extra rows are filled as -1
| Pixel properties | Quadrant properties | ||||||
|---|---|---|---|---|---|---|---|
| Quadrant | DetID | PixID | Counts | Sigma | Mean | Median | Sigma |
| A | 15 | 174 | 182180 | 480.99 | 1852 | 1811 | 375.0 |
| A | 8 | 205 | 90728 | 237.12 | 1852 | 1811 | 375.0 |
| A | 8 | 144 | 29121 | 72.83 | 1852 | 1811 | 375.0 |
| B | 4 | 251 | 588389 | 1664.1 | 1837 | 1792 | 352.5 |
| B | 7 | 220 | 132405 | 370.53 | 1837 | 1792 | 352.5 |
| B | 6 | 36 | 120714 | 337.36 | 1837 | 1792 | 352.5 |
| C | 14 | 238 | 275298 | 654.32 | 1775 | 1789 | 418.0 |
| C | 9 | 54 | 171195 | 405.27 | 1775 | 1789 | 418.0 |
| C | 0 | 207 | 112798 | 265.57 | 1775 | 1789 | 418.0 |
| D | 12 | 110 | 6818678 | 17301.48 | 1612 | 1565 | 394.0 |
| D | 7 | 38 | 2451732 | 6218.4 | 1612 | 1565 | 394.0 |
| D | 1 | 52 | 543807 | 1376.18 | 1612 | 1565 | 394.0 |
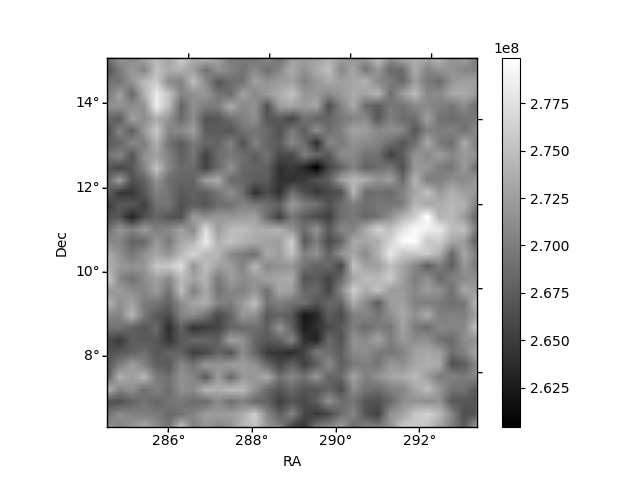
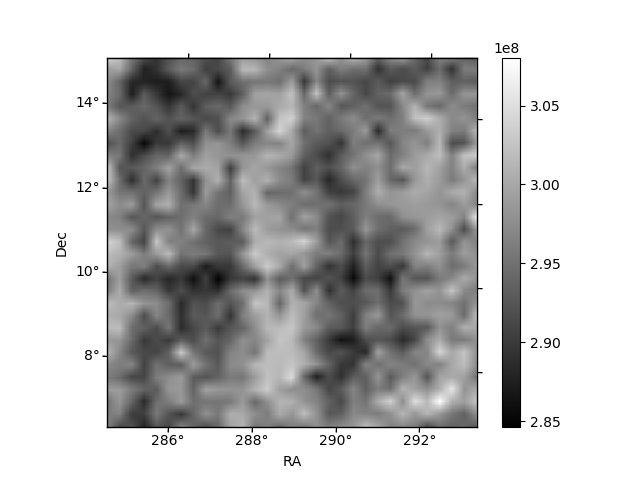
Histogram calculated using DETX and DETY for each event in the final _common_clean file
| Quadrant A |  |
 |
Quadrant B |
|---|---|---|---|
| Quadrant D |  |
 |
Quadrant C |
| Plot type | Count rate plots | Images |
|---|---|---|
| Comparison with Poisson distribution Blue bars denote a histogram of data divided into 1 sec bins. Red curve is a Poisson curve with rate = median count rate of data. |
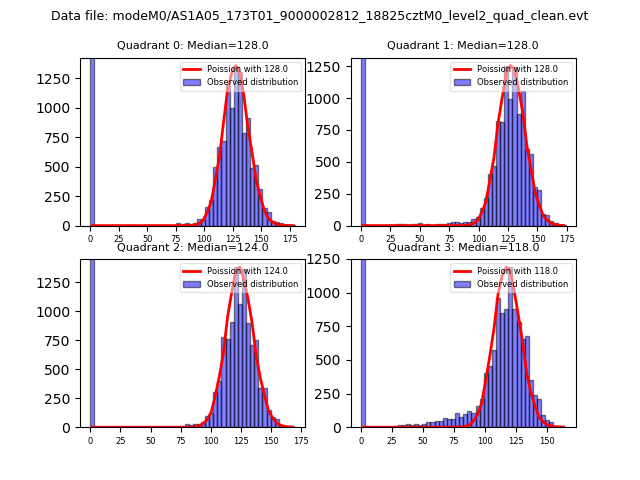 |
 |
| Quadrant-wise count rates Data is divided into 100 sec bins |
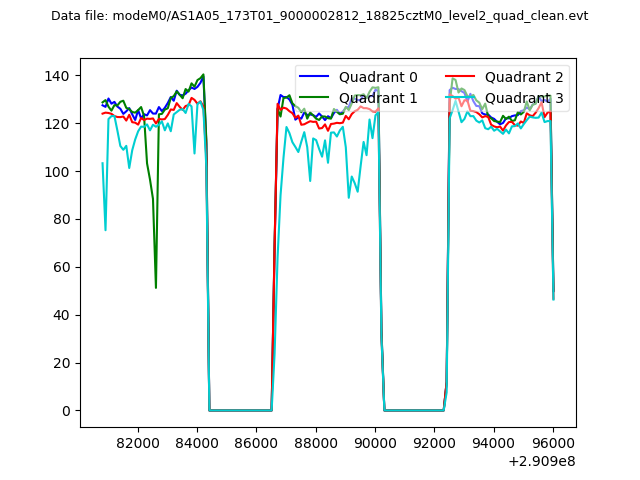 |
|
| Module-wise count rates for Quadrant A Data is divided into 100 sec bins |
 |
 |
| Module-wise count rates for Quadrant B Data is divided into 100 sec bins |
 |
 |
| Module-wise count rates for Quadrant C Data is divided into 100 sec bins |
 |
 |
| Module-wise count rates for Quadrant D Data is divided into 100 sec bins |
 |
 |
| Parameter | Plot |
|---|---|
| CZT HV Monitor |  |
| D_VDD | 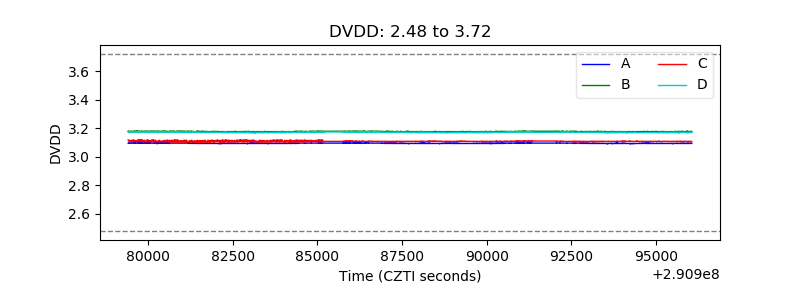 |
| Temperature 1 |  |
| Veto HV Monitor |  |
| Veto LLD |  |
| Alpha Counter | 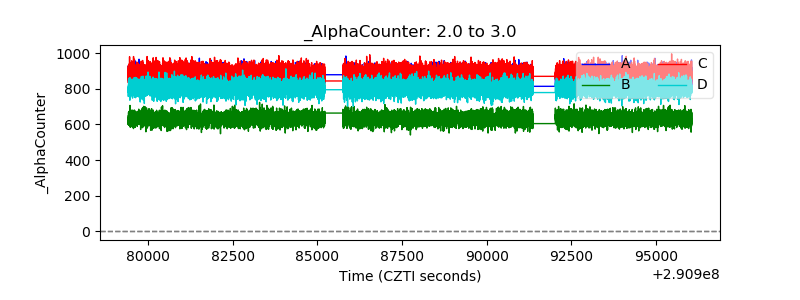 |
| _CPM_Rate | 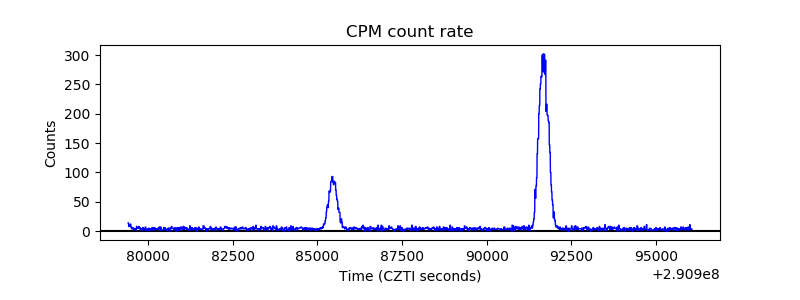 |
| CZT Counter |  |
| +2.5 Volts monitor |  |
| +5 Volts monitor |  |
| _ROLL_ROT |  |
| _Roll_DEC |  |
| _Roll_RA |  |
| Veto Counter |  |