| Param | Original file | Final file |
|---|---|---|
| Filename | modeM0/AS1A05_173T01_9000002812_18830cztM0_level2.evt | modeM0/AS1A05_173T01_9000002812_18830cztM0_level2_quad_clean.evt |
| Size (bytes) | 441,083,520 | 82,817,280 |
| Size | 420.7 MB | 79.0 MB |
| Events in quadrant A | 2,959,383 | 543,926 |
| Events in quadrant B | 3,120,501 | 553,183 |
| Events in quadrant C | 3,056,170 | 518,485 |
| Events in quadrant D | 3,835,511 | 494,222 |
| Mode SS | |||
|---|---|---|---|
| Quadrant | BADHDUFLAG | Total packets | Discarded packets |
| A | 0 | 116 | 0 |
| B | 0 | 116 | 0 |
| C | 0 | 116 | 0 |
| D | 0 | 116 | 0 |
| Mode M9 | |||
|---|---|---|---|
| Quadrant | BADHDUFLAG | Total packets | Discarded packets |
| A | 0 | 13 | 0 |
| B | 0 | 13 | 0 |
| C | 0 | 13 | 0 |
| D | 0 | 13 | 0 |
| Mode M0 | |||
|---|---|---|---|
| Quadrant | BADHDUFLAG | Total packets | Discarded packets |
| A | 0 | 12006 | 1 |
| B | 0 | 12607 | 1 |
| C | 0 | 12336 | 1 |
| D | 0 | 14953 | 1 |
| Quadrant | Total seconds | Saturated seconds | Saturation percentage |
|---|---|---|---|
| A | 5693 | 29 | 0.509398% |
| B | 5693 | 57 | 1.001230% |
| C | 5693 | 66 | 1.159318% |
| D | 5693 | 265 | 4.654839% |
Noise dominated data is calculated using 1-second bins in cleaned event files. If a bin has >2000 counts, and if more than 50% of those come from <1% of pixels, then it is considered to be noise-dominated and hence unusable.
| Quadrant | # 1 sec bins | Bins with >0 counts | Bins with >2000 counts | High rate bins dominated by noise | Noise dominated (total time) | Noise dominated (detector-on time) | Marked lightcurve |
|---|---|---|---|---|---|---|---|
| A | 6993 | 5694 | 1 | 1 | 0.01% | 0.02% | 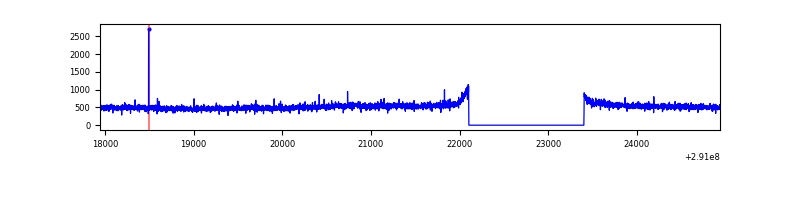 |
| B | 6993 | 5694 | 6 | 6 | 0.09% | 0.11% | 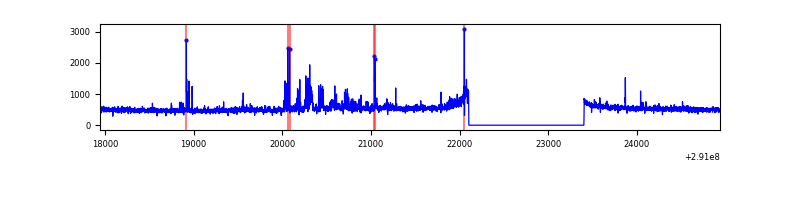 |
| C | 6993 | 5694 | 10 | 10 | 0.14% | 0.18% | 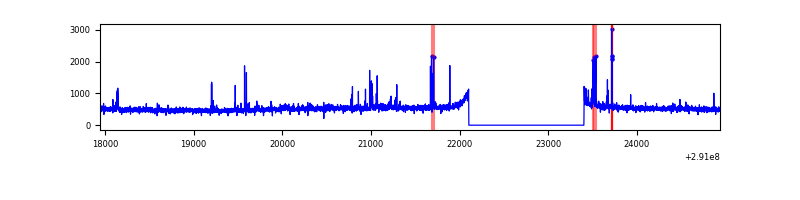 |
| D | 6993 | 5694 | 240 | 240 | 3.43% | 4.21% | 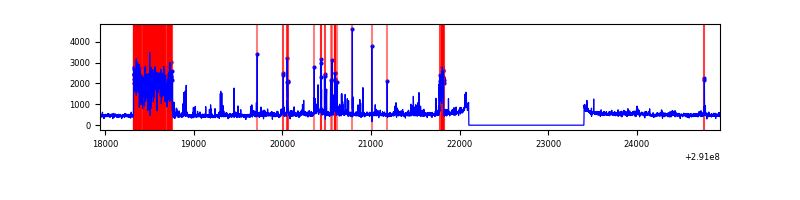 |
Top three noisy pixels from each quadrant. If the there are fewer than three noisy pixels in the level2.evt file, extra rows are filled as -1
| Pixel properties | Quadrant properties | ||||||
|---|---|---|---|---|---|---|---|
| Quadrant | DetID | PixID | Counts | Sigma | Mean | Median | Sigma |
| A | 8 | 205 | 46620 | 303.69 | 753 | 742 | 151.1 |
| A | 13 | 254 | 9223 | 56.14 | 753 | 742 | 151.1 |
| A | 0 | 226 | 6609 | 38.84 | 753 | 742 | 151.1 |
| B | 4 | 171 | 48136 | 338.45 | 747 | 731 | 140.1 |
| B | 4 | 216 | 40836 | 286.33 | 747 | 731 | 140.1 |
| B | 0 | 229 | 35077 | 245.21 | 747 | 731 | 140.1 |
| C | 14 | 238 | 111639 | 666.62 | 713 | 721 | 166.4 |
| C | 5 | 112 | 70579 | 419.85 | 713 | 721 | 166.4 |
| C | 3 | 233 | 50949 | 301.87 | 713 | 721 | 166.4 |
| D | 1 | 52 | 975777 | 5530.23 | 720 | 702 | 176.3 |
| D | 7 | 38 | 101230 | 570.15 | 720 | 702 | 176.3 |
| D | 2 | 234 | 22431 | 123.24 | 720 | 702 | 176.3 |
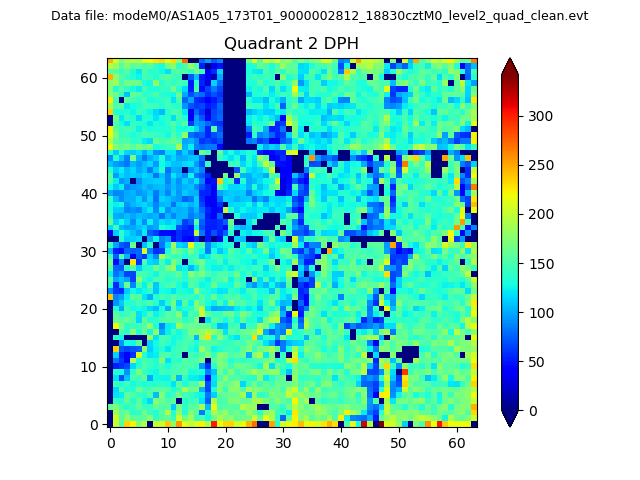
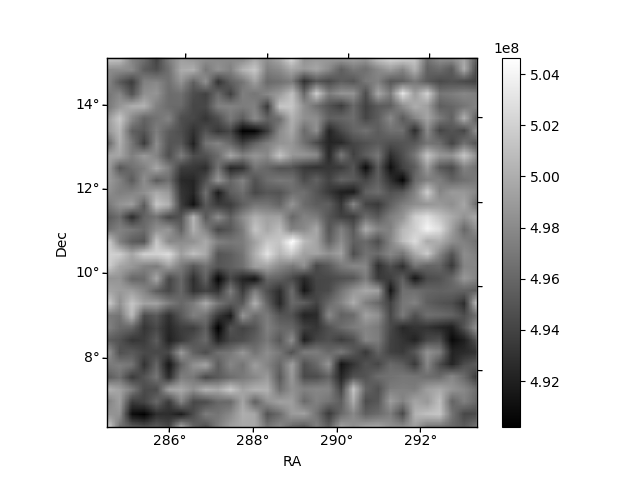
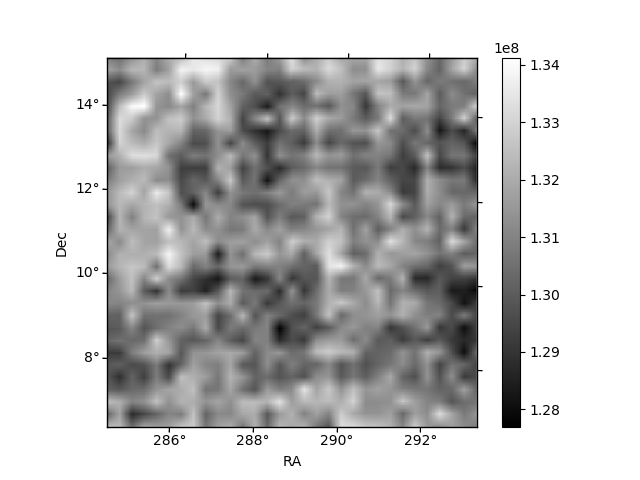
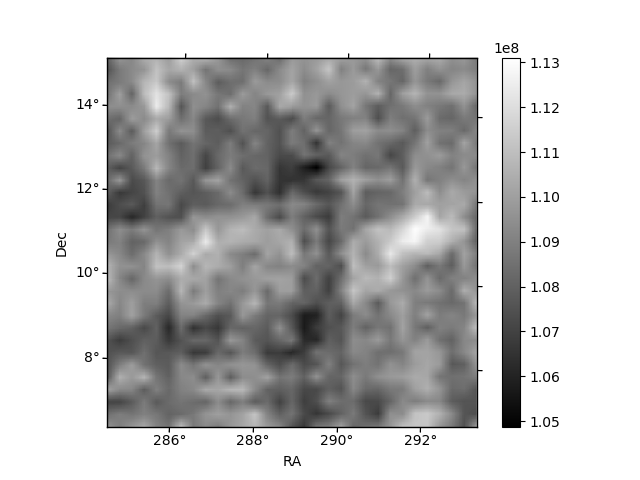
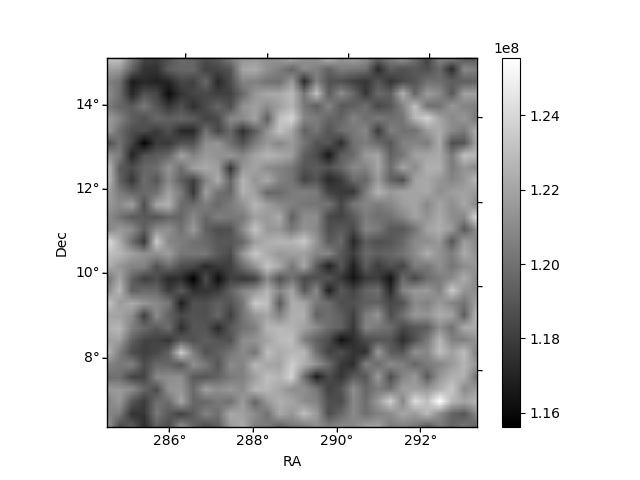
Histogram calculated using DETX and DETY for each event in the final _common_clean file
| Quadrant A | 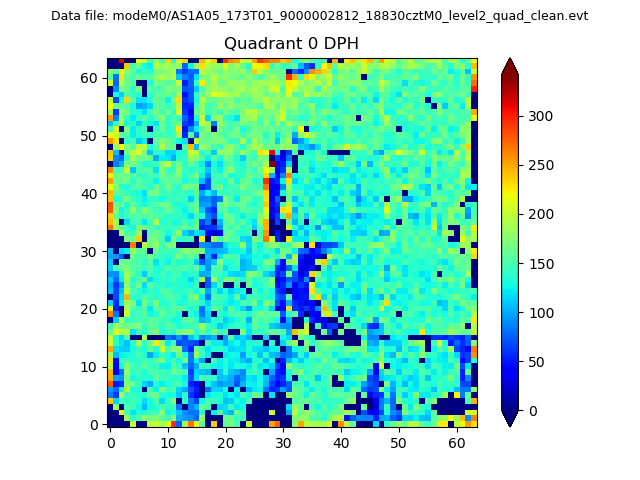 |
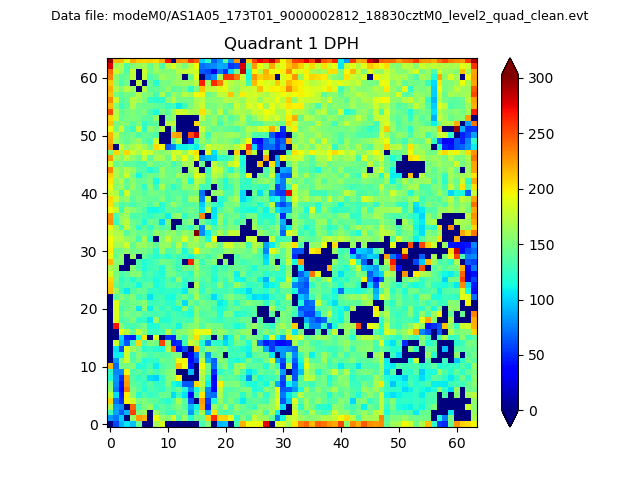 |
Quadrant B |
|---|---|---|---|
| Quadrant D | 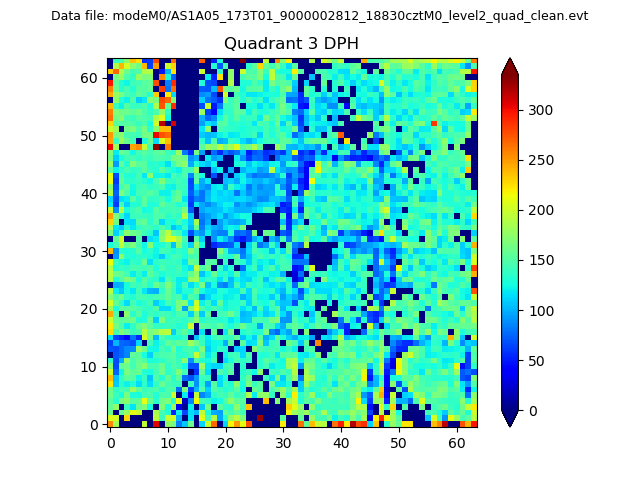 |
 |
Quadrant C |
| Plot type | Count rate plots | Images |
|---|---|---|
| Comparison with Poisson distribution Blue bars denote a histogram of data divided into 1 sec bins. Red curve is a Poisson curve with rate = median count rate of data. |
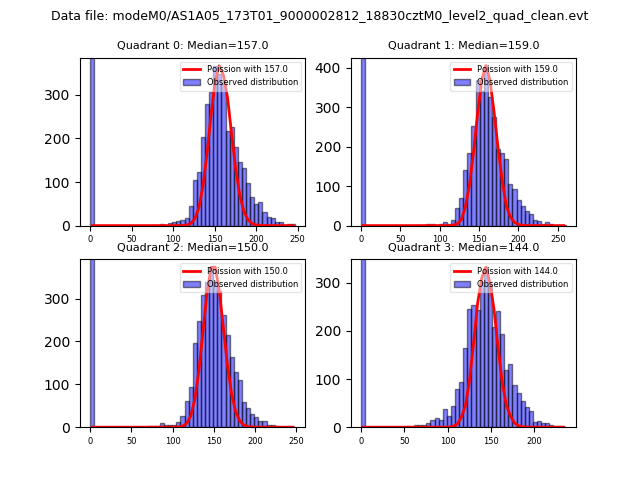 |
 |
| Quadrant-wise count rates Data is divided into 100 sec bins |
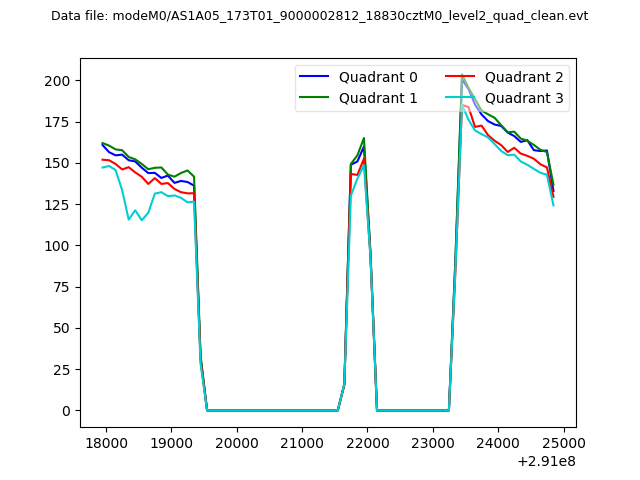 |
|
| Module-wise count rates for Quadrant A Data is divided into 100 sec bins |
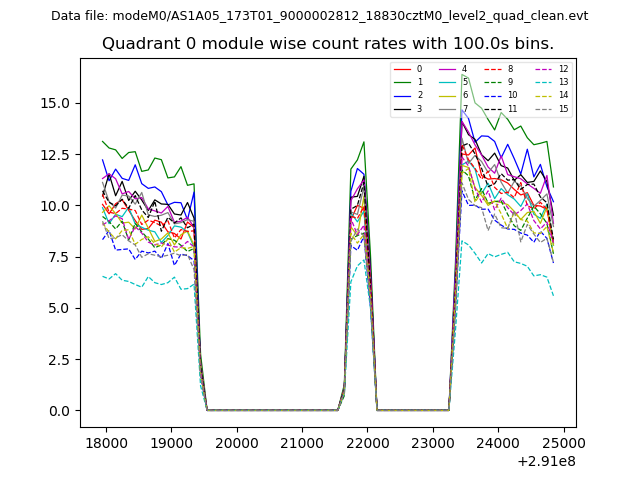 |
 |
| Module-wise count rates for Quadrant B Data is divided into 100 sec bins |
 |
 |
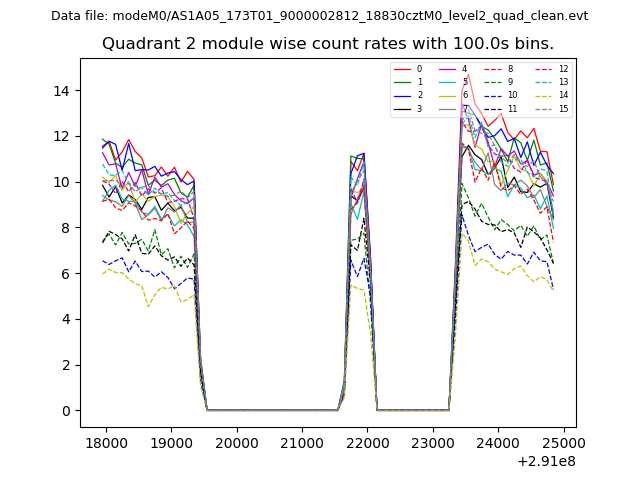
| Module-wise count rates for Quadrant C Data is divided into 100 sec bins |
 |
 |
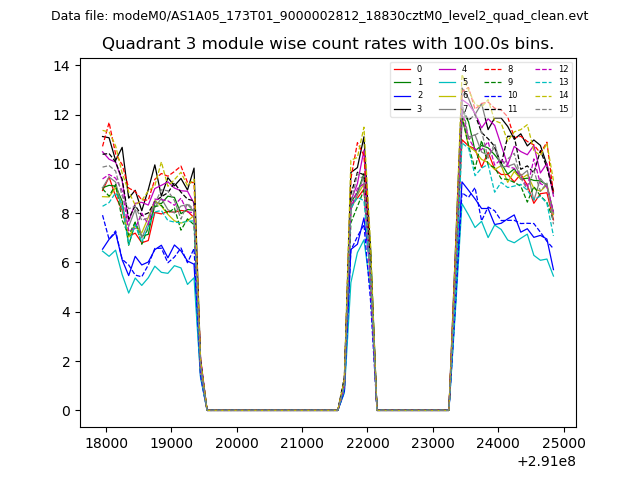
| Module-wise count rates for Quadrant D Data is divided into 100 sec bins |
 |
 |
| Parameter | Plot |
|---|---|
| CZT HV Monitor | 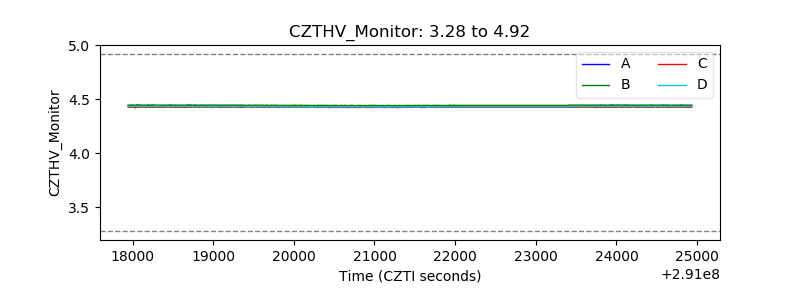 |
| D_VDD | 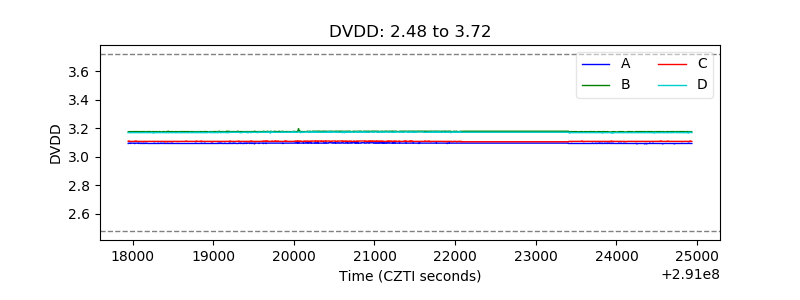 |
| Temperature 1 | 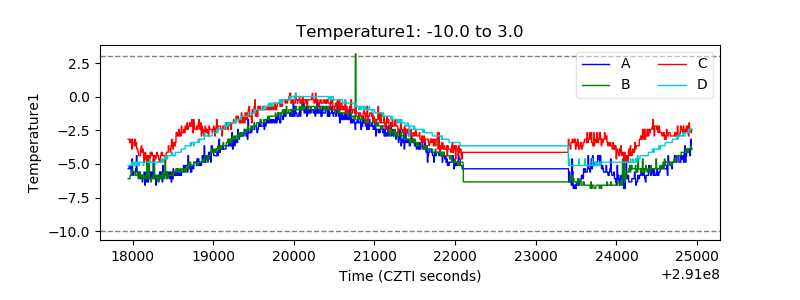 |
| Veto HV Monitor | 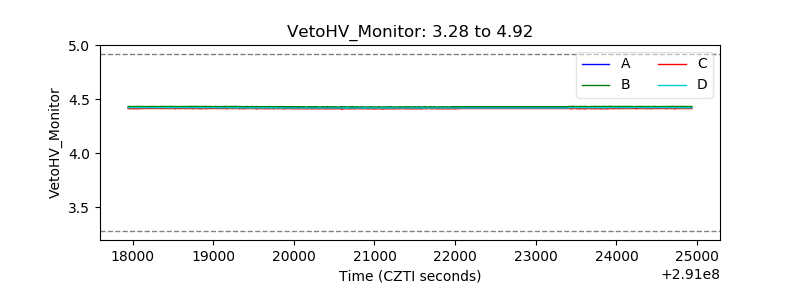 |
| Veto LLD | 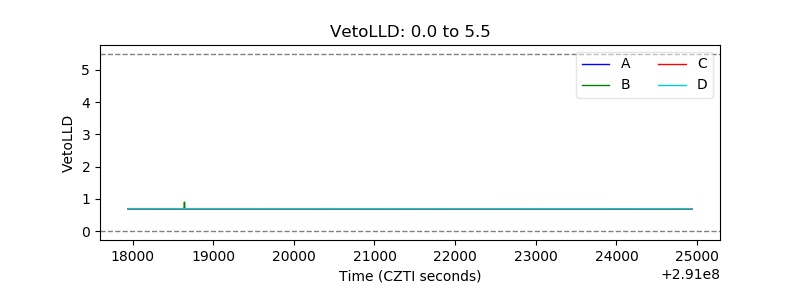 |
| Alpha Counter | 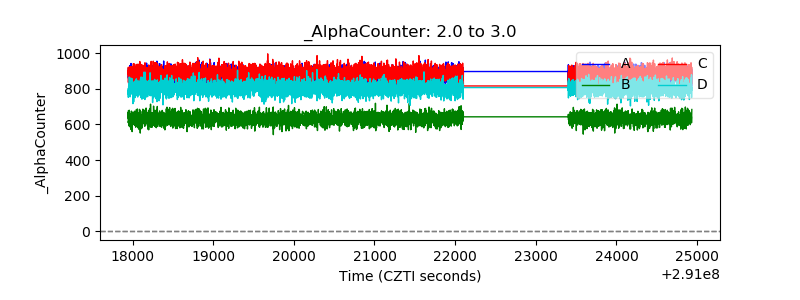 |
| _CPM_Rate | 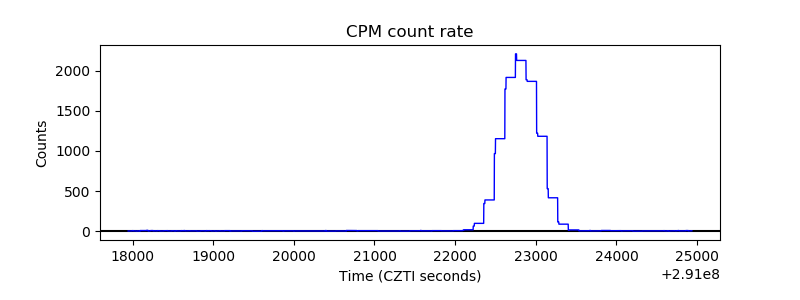 |
| CZT Counter | 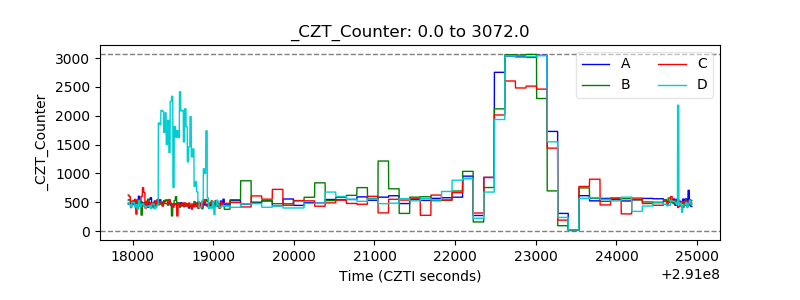 |
| +2.5 Volts monitor | 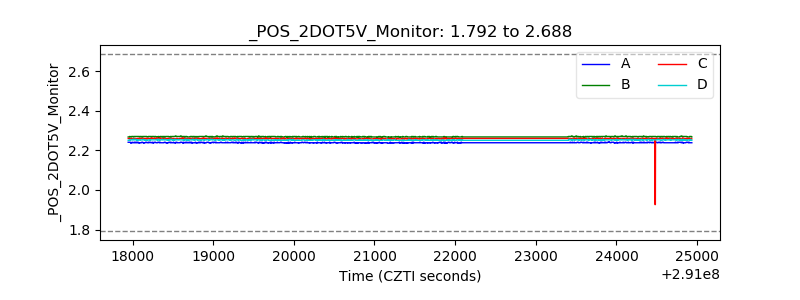 |
| +5 Volts monitor |  |
| _ROLL_ROT | 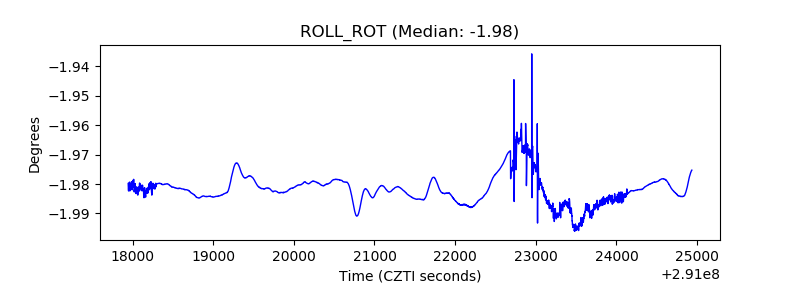 |
| _Roll_DEC | 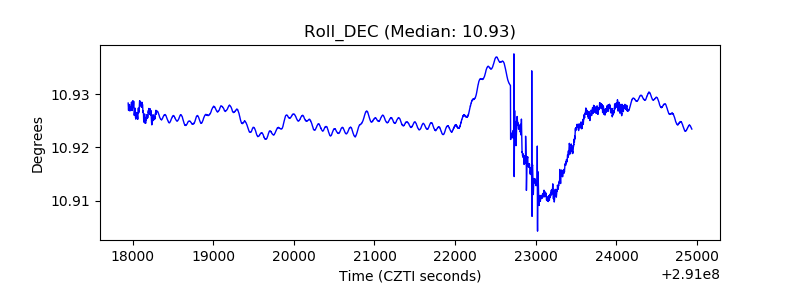 |
| _Roll_RA | 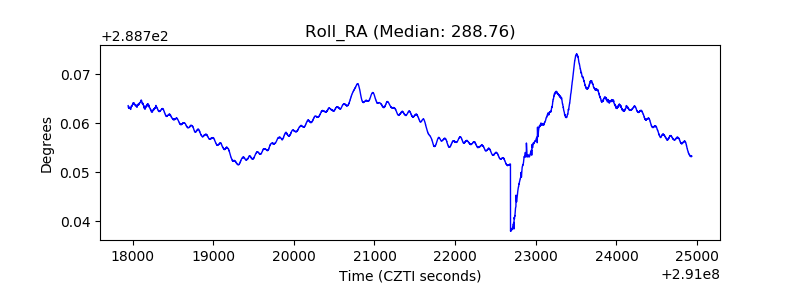 |
| Veto Counter | 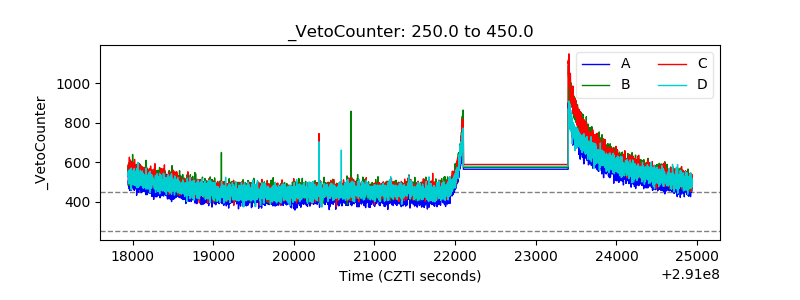 |