| Param | Original file | Final file |
|---|---|---|
| Filename | modeM0/AS1A05_173T01_9000002812_18831cztM0_level2.evt | modeM0/AS1A05_173T01_9000002812_18831cztM0_level2_quad_clean.evt |
| Size (bytes) | 448,153,920 | 87,765,120 |
| Size | 427.4 MB | 83.7 MB |
| Events in quadrant A | 3,107,420 | 579,435 |
| Events in quadrant B | 3,498,436 | 583,128 |
| Events in quadrant C | 3,148,317 | 549,199 |
| Events in quadrant D | 3,422,287 | 538,560 |
| Mode SS | |||
|---|---|---|---|
| Quadrant | BADHDUFLAG | Total packets | Discarded packets |
| A | 0 | 118 | 0 |
| B | 0 | 118 | 0 |
| C | 0 | 118 | 0 |
| D | 0 | 118 | 0 |
| Mode M9 | |||
|---|---|---|---|
| Quadrant | BADHDUFLAG | Total packets | Discarded packets |
| A | 0 | 13 | 0 |
| B | 0 | 13 | 0 |
| C | 0 | 13 | 0 |
| D | 0 | 13 | 0 |
| Mode M0 | |||
|---|---|---|---|
| Quadrant | BADHDUFLAG | Total packets | Discarded packets |
| A | 0 | 12392 | 1 |
| B | 0 | 13819 | 1 |
| C | 0 | 12600 | 1 |
| D | 0 | 13750 | 1 |
| Quadrant | Total seconds | Saturated seconds | Saturation percentage |
|---|---|---|---|
| A | 5834 | 40 | 0.685636% |
| B | 5834 | 121 | 2.074049% |
| C | 5833 | 88 | 1.508658% |
| D | 5833 | 79 | 1.354363% |
Noise dominated data is calculated using 1-second bins in cleaned event files. If a bin has >2000 counts, and if more than 50% of those come from <1% of pixels, then it is considered to be noise-dominated and hence unusable.
| Quadrant | # 1 sec bins | Bins with >0 counts | Bins with >2000 counts | High rate bins dominated by noise | Noise dominated (total time) | Noise dominated (detector-on time) | Marked lightcurve |
|---|---|---|---|---|---|---|---|
| A | 7149 | 5835 | 0 | 0 | 0.00% | 0.00% | 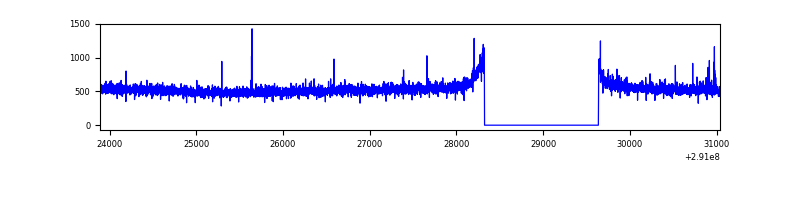 |
| B | 7149 | 5835 | 19 | 19 | 0.27% | 0.33% | 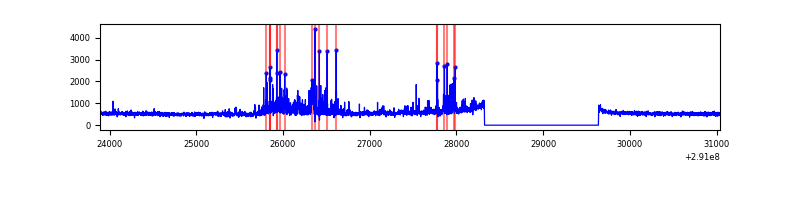 |
| C | 7148 | 5834 | 14 | 14 | 0.20% | 0.24% | 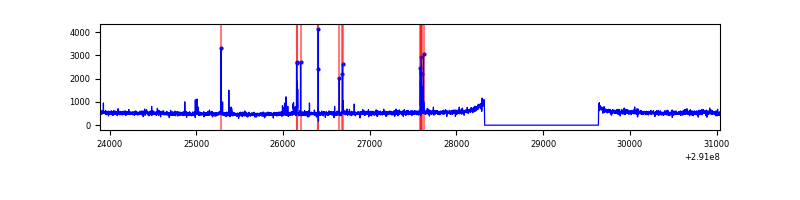 |
| D | 7148 | 5834 | 50 | 50 | 0.70% | 0.86% | 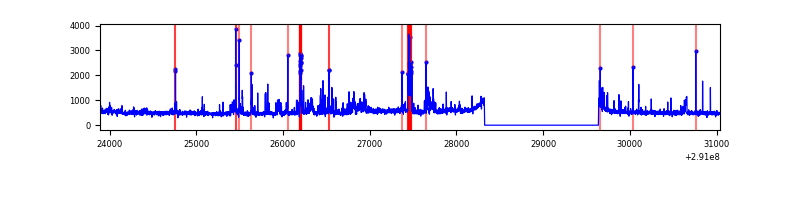 |
Top three noisy pixels from each quadrant. If the there are fewer than three noisy pixels in the level2.evt file, extra rows are filled as -1
| Pixel properties | Quadrant properties | ||||||
|---|---|---|---|---|---|---|---|
| Quadrant | DetID | PixID | Counts | Sigma | Mean | Median | Sigma |
| A | 8 | 205 | 30683 | 188.58 | 792 | 779 | 158.6 |
| A | 4 | 2 | 20784 | 126.15 | 792 | 779 | 158.6 |
| A | 13 | 254 | 9033 | 52.05 | 792 | 779 | 158.6 |
| B | 7 | 220 | 215538 | 1445.52 | 780 | 764 | 148.6 |
| B | 6 | 36 | 79001 | 526.57 | 780 | 764 | 148.6 |
| B | 4 | 216 | 73038 | 486.43 | 780 | 764 | 148.6 |
| C | 14 | 238 | 117279 | 668.87 | 745 | 753 | 174.2 |
| C | 0 | 207 | 82957 | 471.86 | 745 | 753 | 174.2 |
| C | 9 | 54 | 26282 | 146.54 | 745 | 753 | 174.2 |
| D | 7 | 38 | 240491 | 1300.12 | 760 | 742 | 184.4 |
| D | 1 | 52 | 143676 | 775.11 | 760 | 742 | 184.4 |
| D | 12 | 233 | 78550 | 421.94 | 760 | 742 | 184.4 |
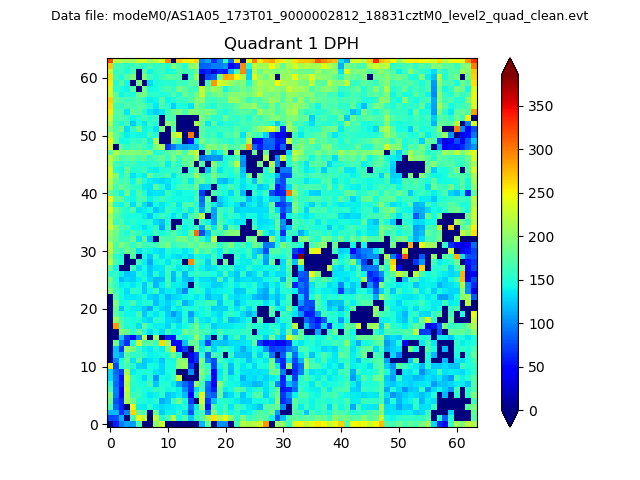
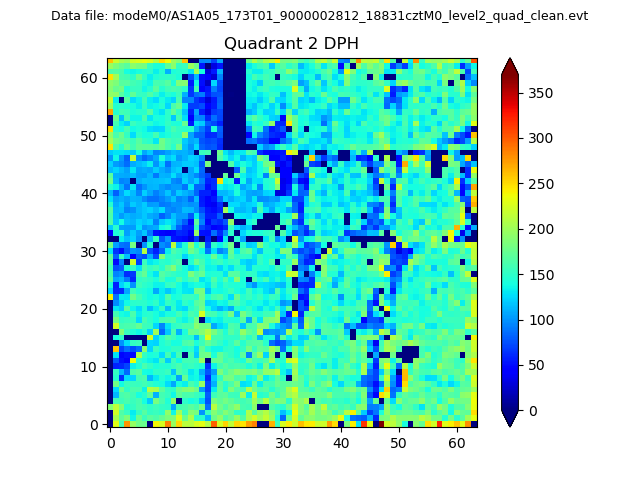
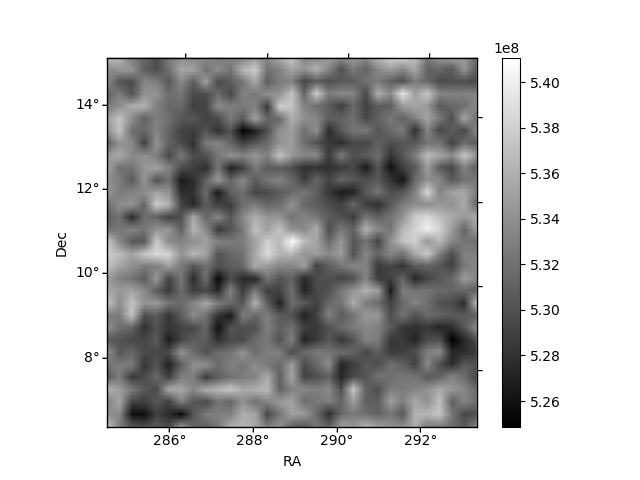
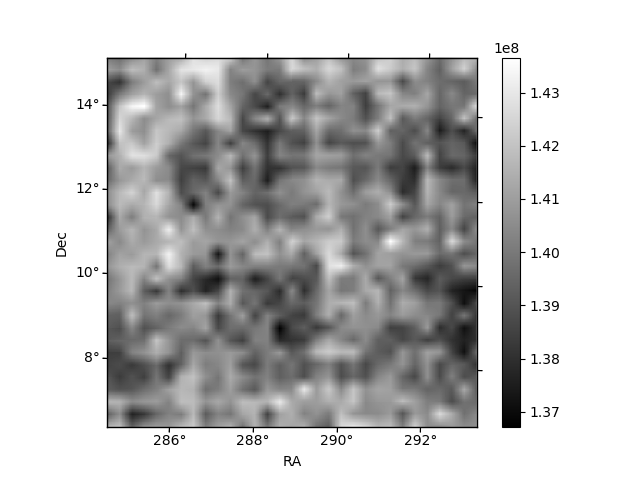
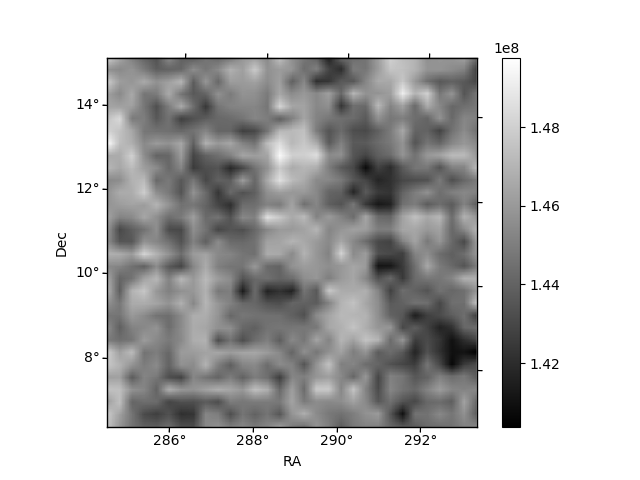
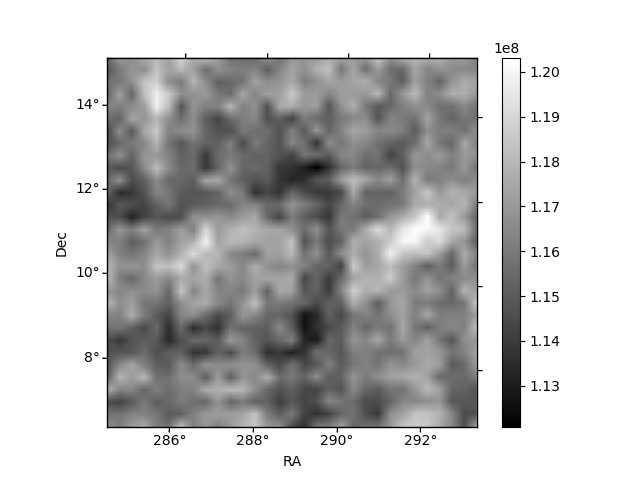
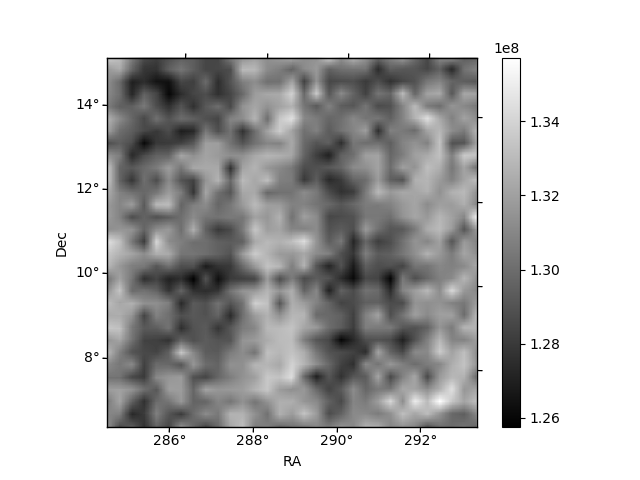
Histogram calculated using DETX and DETY for each event in the final _common_clean file
| Quadrant A |  |
 |
Quadrant B |
|---|---|---|---|
| Quadrant D | 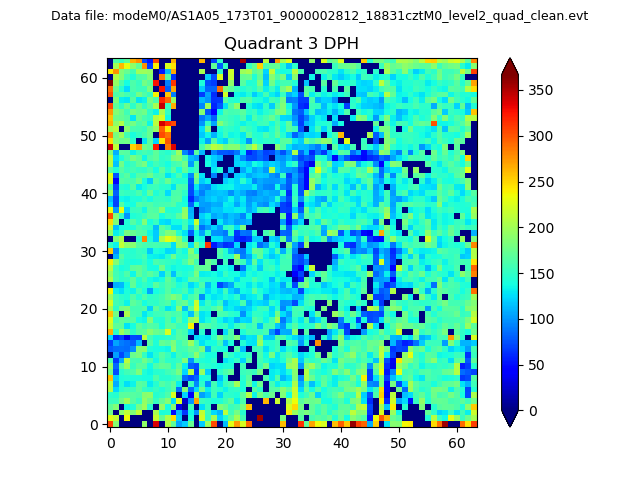 |
 |
Quadrant C |
| Plot type | Count rate plots | Images |
|---|---|---|
| Comparison with Poisson distribution Blue bars denote a histogram of data divided into 1 sec bins. Red curve is a Poisson curve with rate = median count rate of data. |
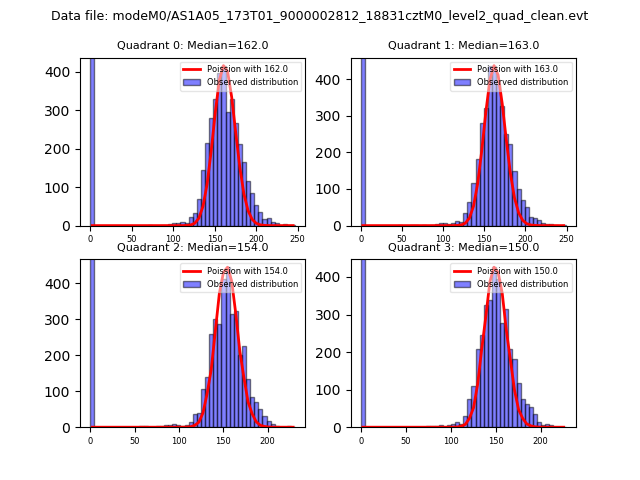 |
 |
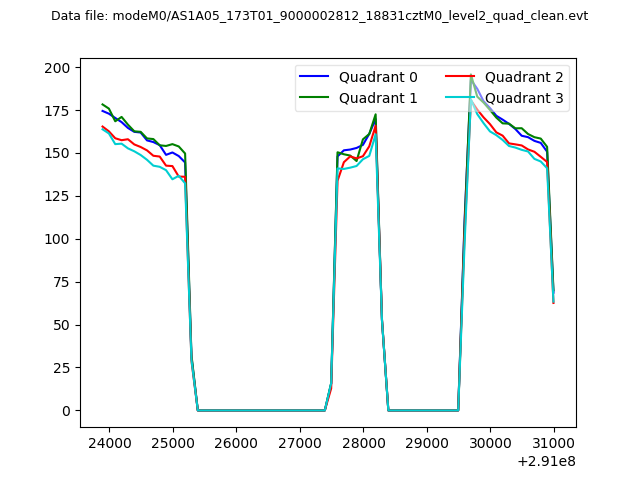
| Quadrant-wise count rates Data is divided into 100 sec bins |
 |
|
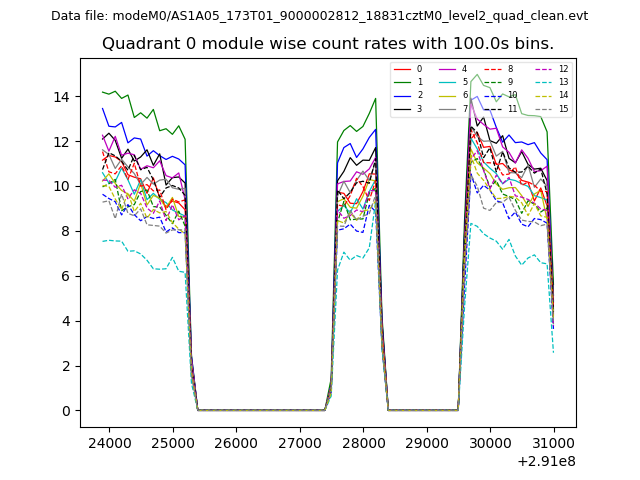
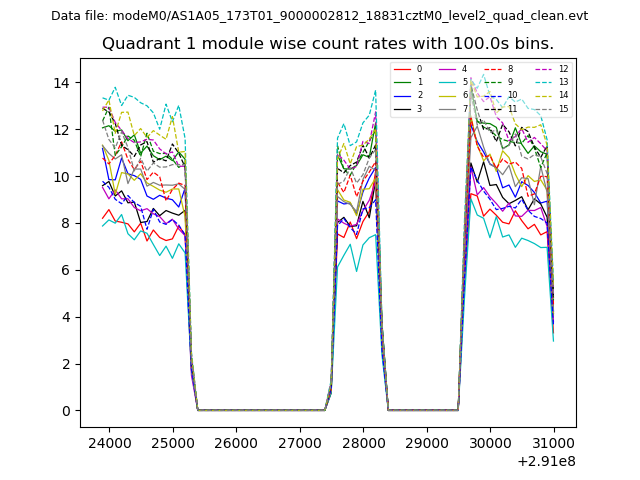
| Module-wise count rates for Quadrant A Data is divided into 100 sec bins |
 |
 |
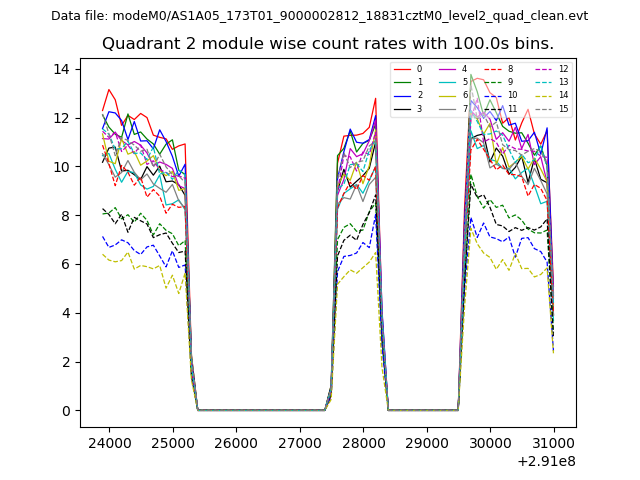
| Module-wise count rates for Quadrant B Data is divided into 100 sec bins |
 |
 |
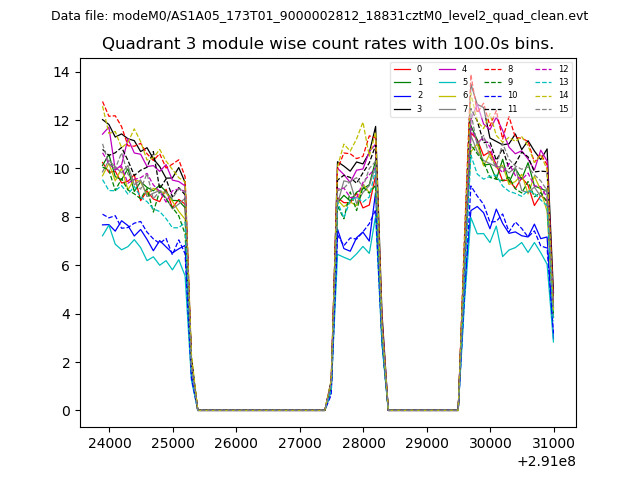
| Module-wise count rates for Quadrant C Data is divided into 100 sec bins |
 |
 |
| Module-wise count rates for Quadrant D Data is divided into 100 sec bins |
 |
 |
| Parameter | Plot |
|---|---|
| CZT HV Monitor | 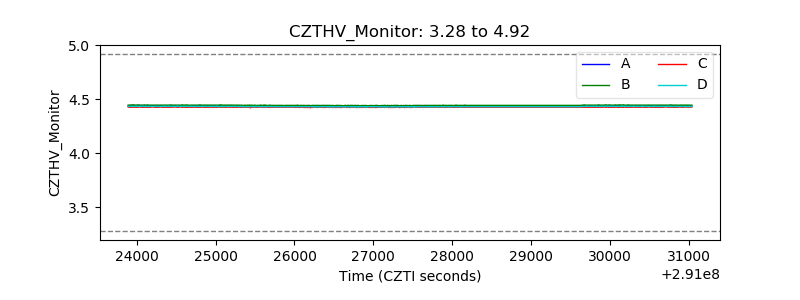 |
| D_VDD | 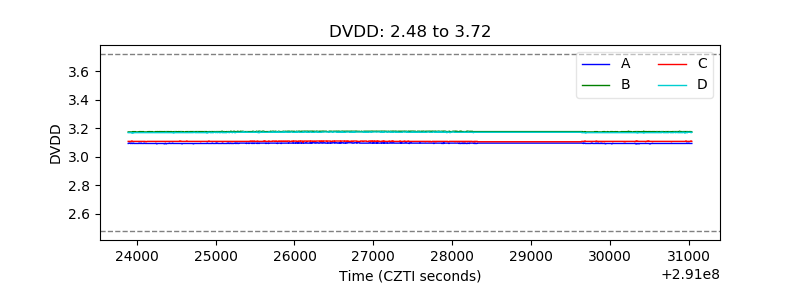 |
| Temperature 1 | 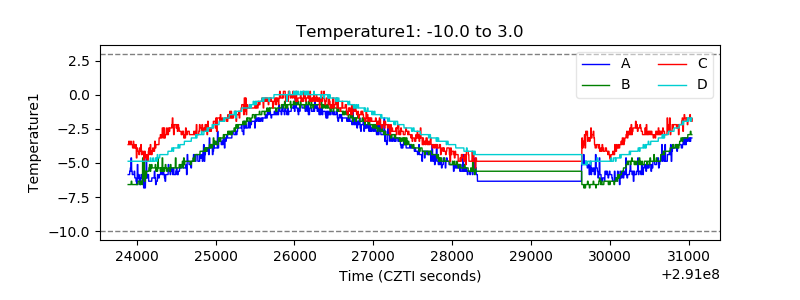 |
| Veto HV Monitor |  |
| Veto LLD | 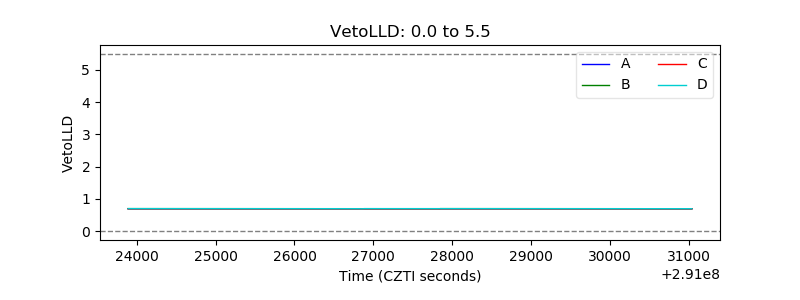 |
| Alpha Counter | 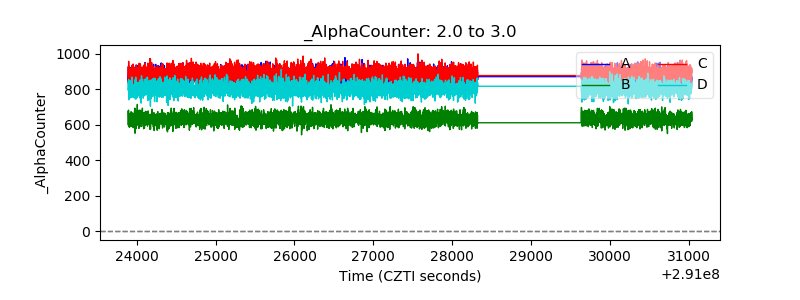 |
| _CPM_Rate |  |
| CZT Counter | 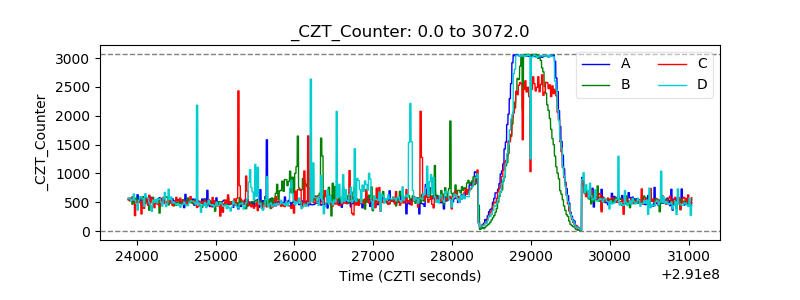 |
| +2.5 Volts monitor |  |
| +5 Volts monitor |  |
| _ROLL_ROT | 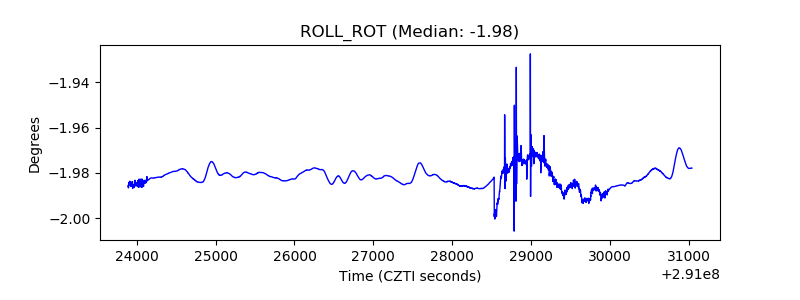 |
| _Roll_DEC |  |
| _Roll_RA | 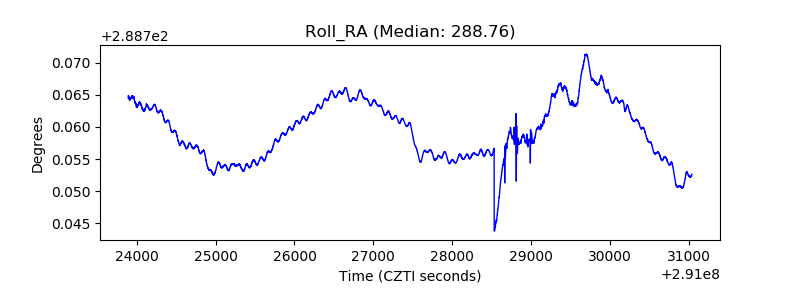 |
| Veto Counter | 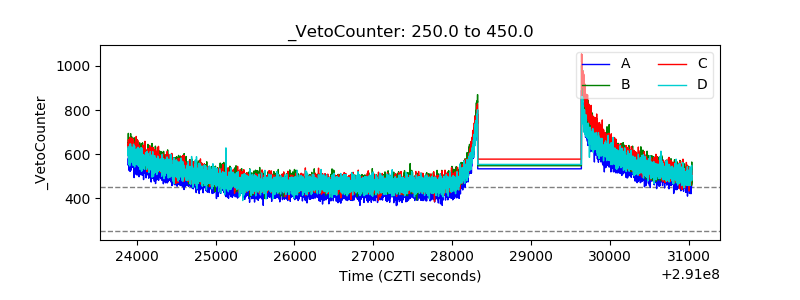 |