| Param | Original file | Final file |
|---|---|---|
| Filename | modeM0/AS1A05_173T01_9000002812_18832cztM0_level2.evt | modeM0/AS1A05_173T01_9000002812_18832cztM0_level2_quad_clean.evt |
| Size (bytes) | 480,833,280 | 86,397,120 |
| Size | 458.6 MB | 82.4 MB |
| Events in quadrant A | 3,245,835 | 562,590 |
| Events in quadrant B | 3,468,026 | 567,487 |
| Events in quadrant C | 3,273,776 | 538,338 |
| Events in quadrant D | 4,164,469 | 526,165 |
| Mode SS | |||
|---|---|---|---|
| Quadrant | BADHDUFLAG | Total packets | Discarded packets |
| A | 0 | 124 | 0 |
| B | 0 | 124 | 0 |
| C | 0 | 124 | 0 |
| D | 0 | 124 | 0 |
| Mode M9 | |||
|---|---|---|---|
| Quadrant | BADHDUFLAG | Total packets | Discarded packets |
| A | 0 | 12 | 0 |
| B | 0 | 12 | 0 |
| C | 0 | 12 | 0 |
| D | 0 | 12 | 0 |
| Mode M0 | |||
|---|---|---|---|
| Quadrant | BADHDUFLAG | Total packets | Discarded packets |
| A | 0 | 12943 | 1 |
| B | 0 | 13735 | 1 |
| C | 0 | 13008 | 1 |
| D | 0 | 16069 | 1 |
| Quadrant | Total seconds | Saturated seconds | Saturation percentage |
|---|---|---|---|
| A | 6035 | 102 | 1.690141% |
| B | 6036 | 124 | 2.054341% |
| C | 6036 | 93 | 1.540755% |
| D | 6036 | 361 | 5.980782% |
Noise dominated data is calculated using 1-second bins in cleaned event files. If a bin has >2000 counts, and if more than 50% of those come from <1% of pixels, then it is considered to be noise-dominated and hence unusable.
| Quadrant | # 1 sec bins | Bins with >0 counts | Bins with >2000 counts | High rate bins dominated by noise | Noise dominated (total time) | Noise dominated (detector-on time) | Marked lightcurve |
|---|---|---|---|---|---|---|---|
| A | 7300 | 6036 | 19 | 19 | 0.26% | 0.31% | 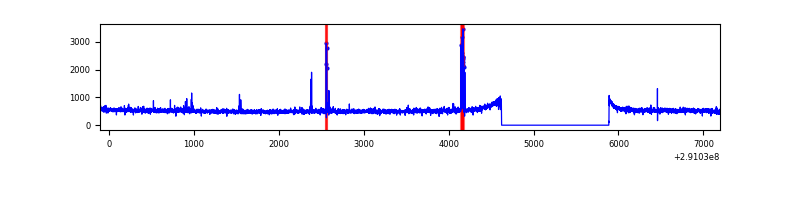 |
| B | 7301 | 6037 | 32 | 32 | 0.44% | 0.53% | 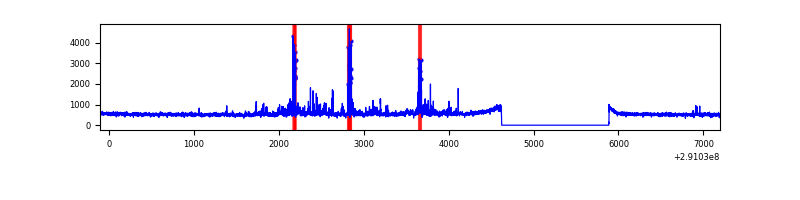 |
| C | 7301 | 6037 | 16 | 16 | 0.22% | 0.27% | 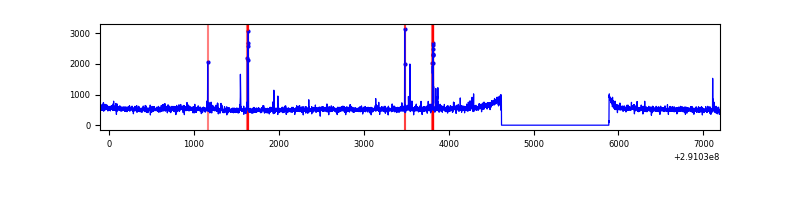 |
| D | 7301 | 6037 | 257 | 257 | 3.52% | 4.26% | 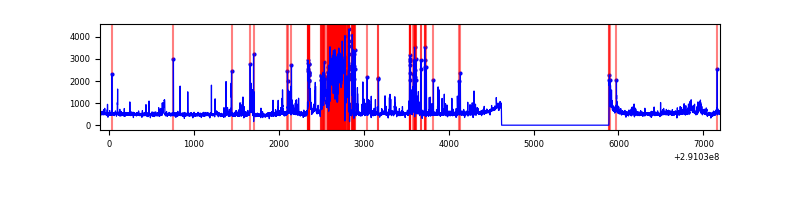 |
Top three noisy pixels from each quadrant. If the there are fewer than three noisy pixels in the level2.evt file, extra rows are filled as -1
| Pixel properties | Quadrant properties | ||||||
|---|---|---|---|---|---|---|---|
| Quadrant | DetID | PixID | Counts | Sigma | Mean | Median | Sigma |
| A | 5 | 98 | 51572 | 310.83 | 812 | 798 | 163.4 |
| A | 15 | 174 | 26663 | 158.34 | 812 | 798 | 163.4 |
| A | 8 | 205 | 18168 | 106.34 | 812 | 798 | 163.4 |
| B | 7 | 220 | 102940 | 681.44 | 798 | 782 | 149.9 |
| B | 15 | 36 | 54885 | 360.89 | 798 | 782 | 149.9 |
| B | 0 | 197 | 48568 | 318.75 | 798 | 782 | 149.9 |
| C | 14 | 238 | 120211 | 667.94 | 767 | 773 | 178.8 |
| C | 9 | 54 | 97189 | 539.2 | 767 | 773 | 178.8 |
| C | 3 | 233 | 39646 | 217.39 | 767 | 773 | 178.8 |
| D | 7 | 38 | 797905 | 4241.64 | 770 | 752 | 187.9 |
| D | 1 | 52 | 325040 | 1725.53 | 770 | 752 | 187.9 |
| D | 7 | 238 | 64917 | 341.42 | 770 | 752 | 187.9 |
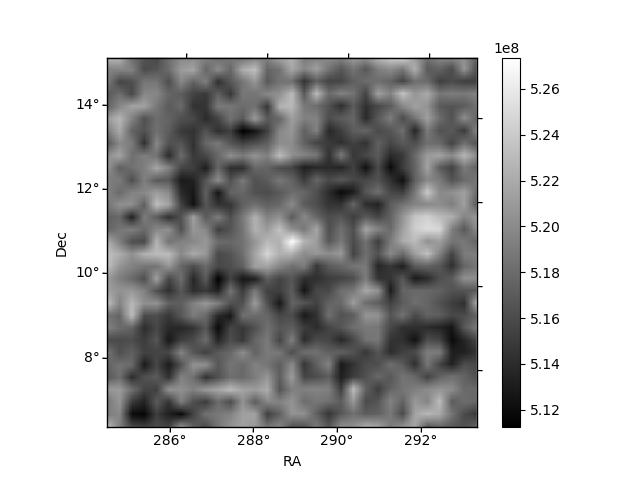
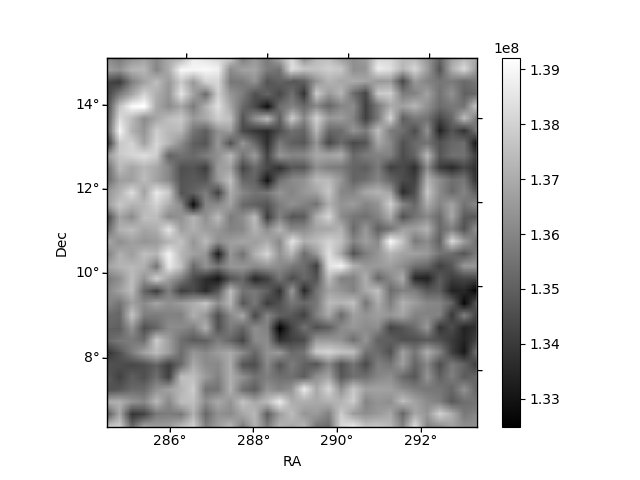
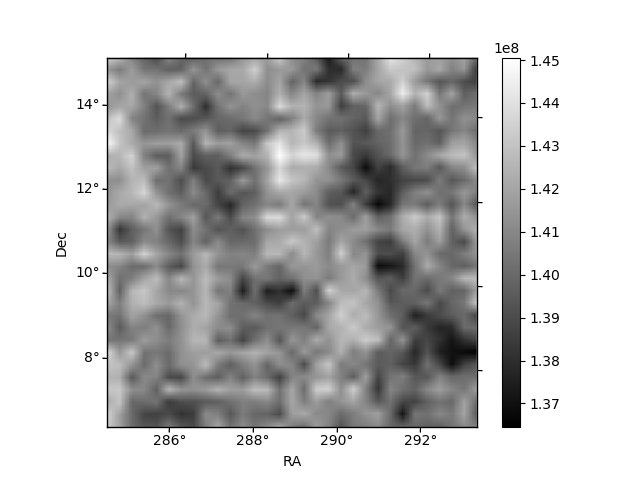
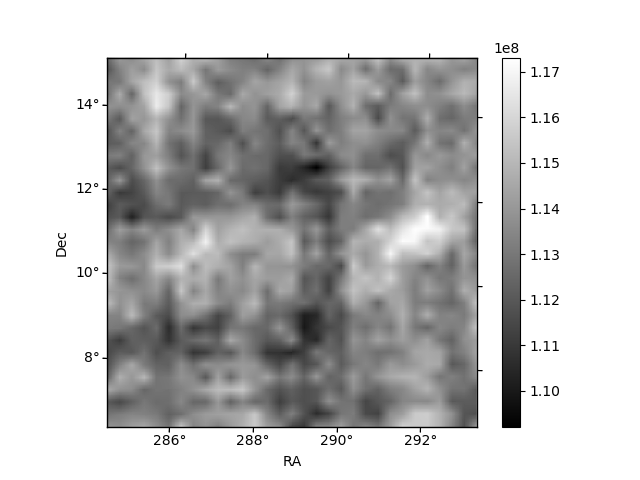
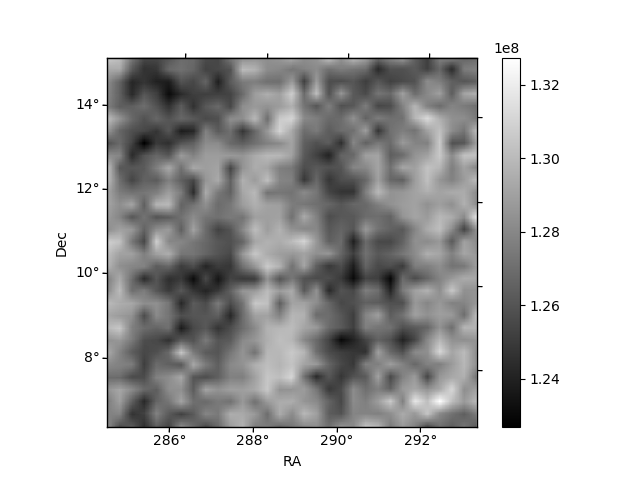
Histogram calculated using DETX and DETY for each event in the final _common_clean file
| Quadrant A | 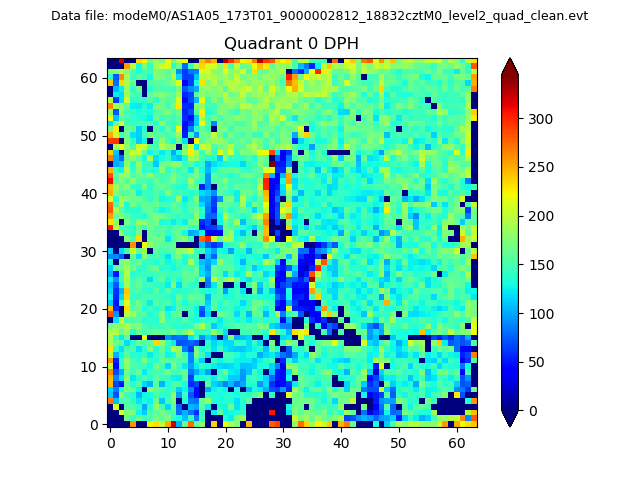 |
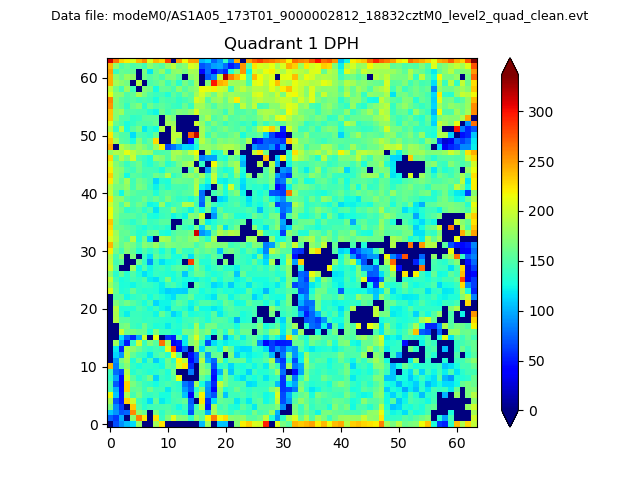 |
Quadrant B |
|---|---|---|---|
| Quadrant D | 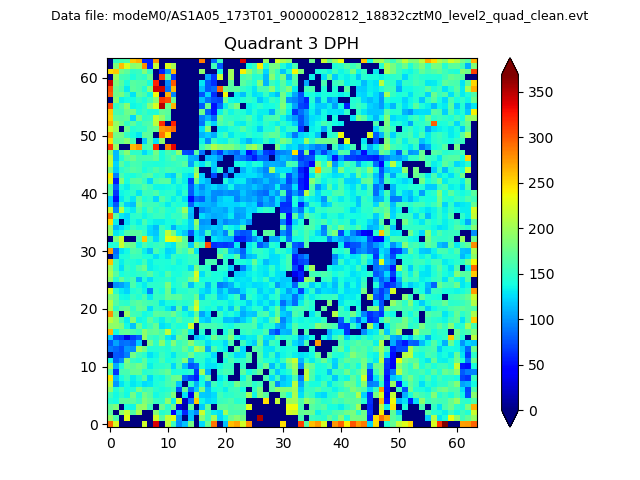 |
 |
Quadrant C |
| Plot type | Count rate plots | Images |
|---|---|---|
| Comparison with Poisson distribution Blue bars denote a histogram of data divided into 1 sec bins. Red curve is a Poisson curve with rate = median count rate of data. |
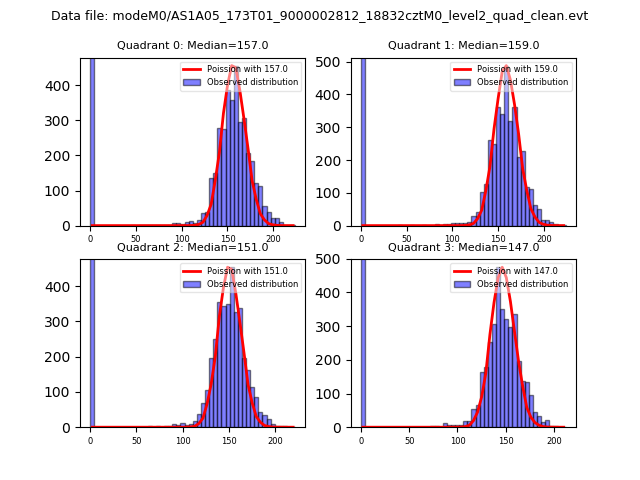 |
 |
| Quadrant-wise count rates Data is divided into 100 sec bins |
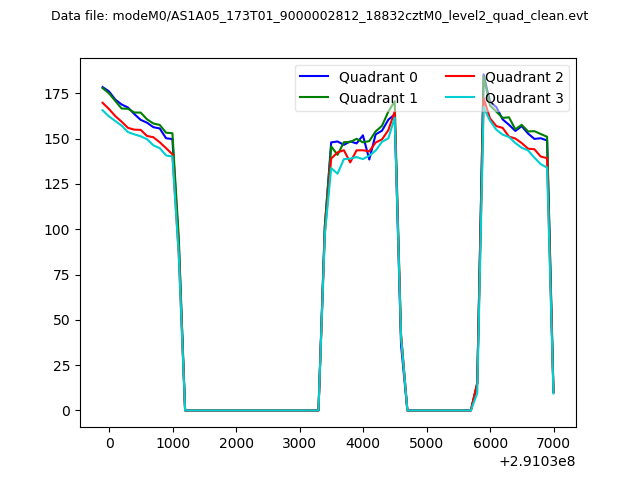 |
|
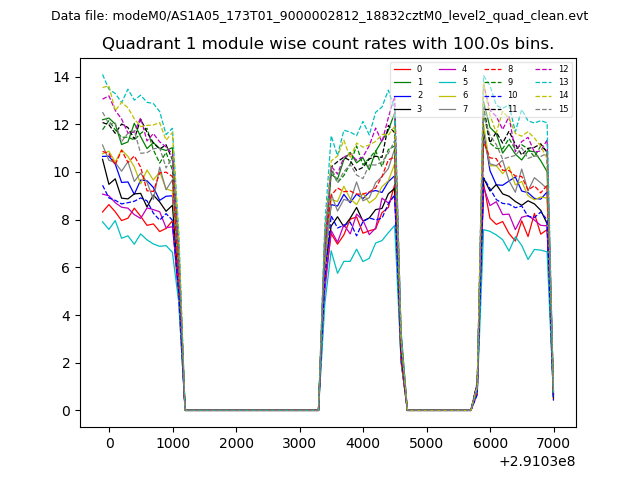
| Module-wise count rates for Quadrant A Data is divided into 100 sec bins |
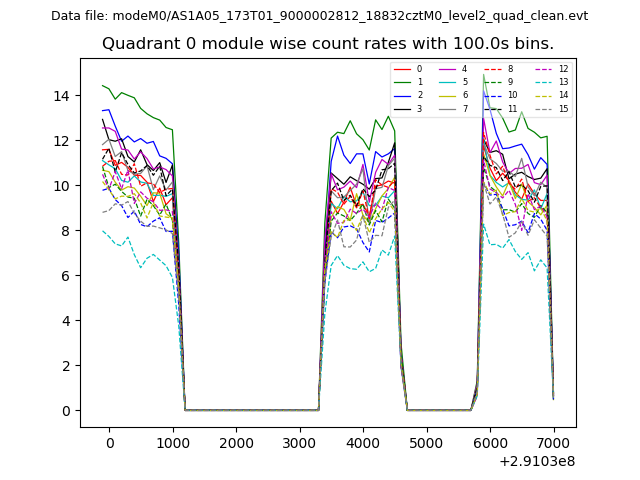 |
 |
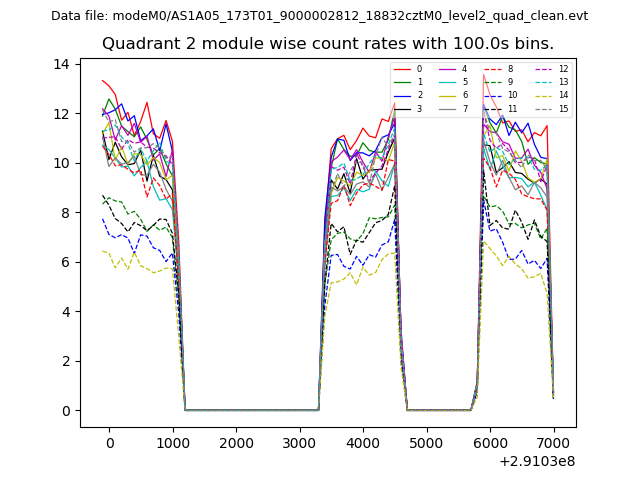
| Module-wise count rates for Quadrant B Data is divided into 100 sec bins |
 |
 |
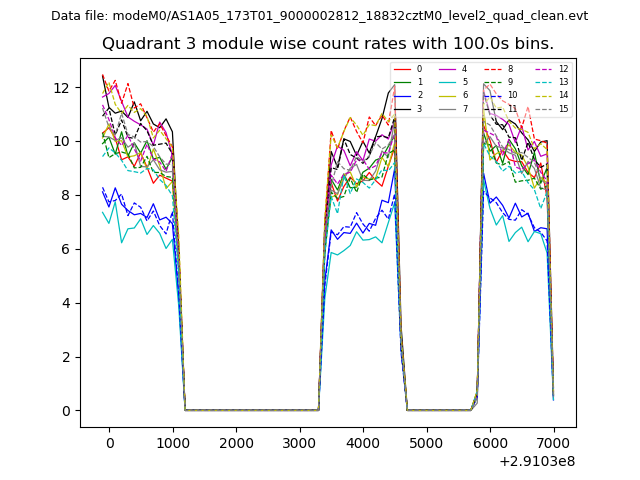
| Module-wise count rates for Quadrant C Data is divided into 100 sec bins |
 |
 |
| Module-wise count rates for Quadrant D Data is divided into 100 sec bins |
 |
 |
| Parameter | Plot |
|---|---|
| CZT HV Monitor | 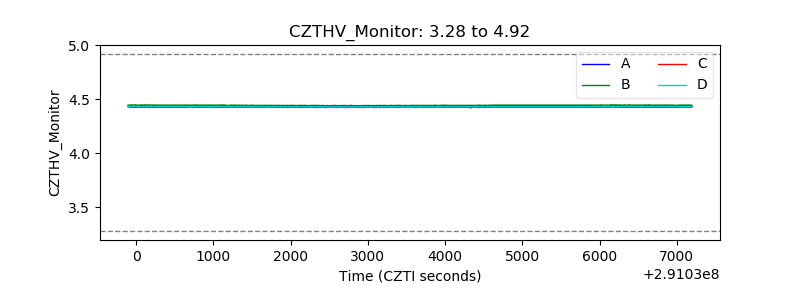 |
| D_VDD | 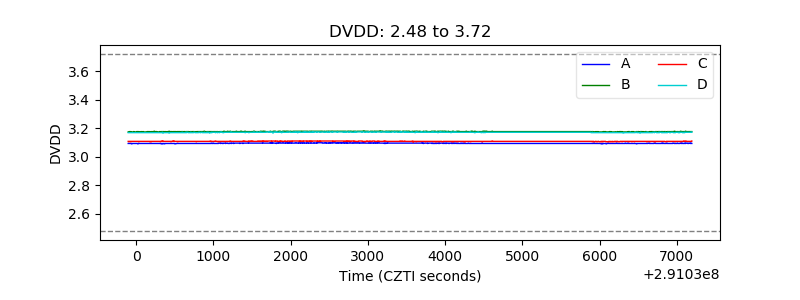 |
| Temperature 1 | 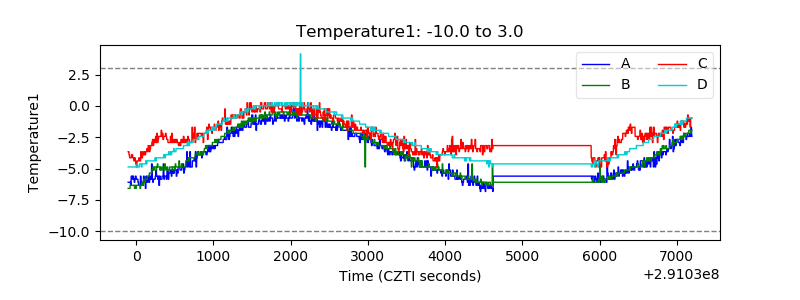 |
| Veto HV Monitor | 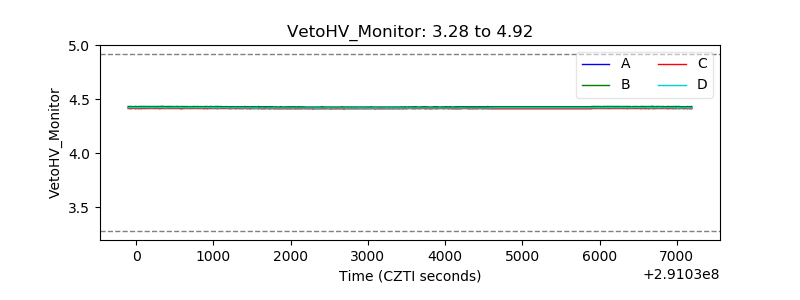 |
| Veto LLD | 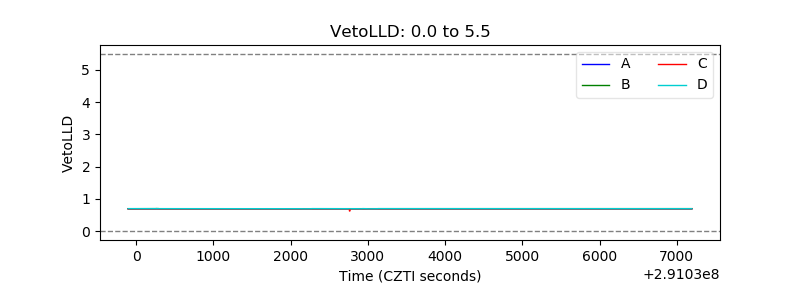 |
| Alpha Counter | 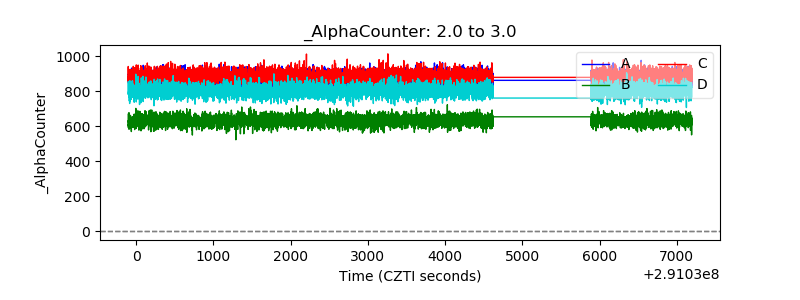 |
| _CPM_Rate | 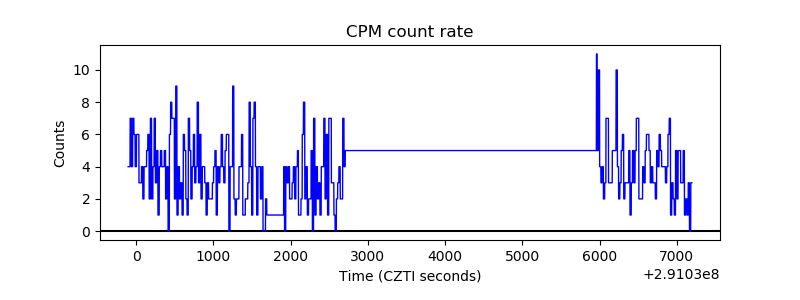 |
| CZT Counter | 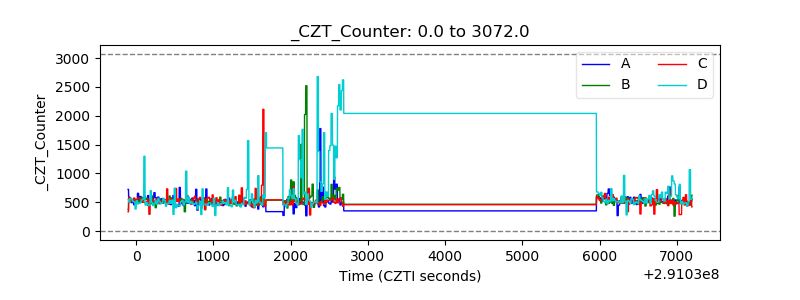 |
| +2.5 Volts monitor | 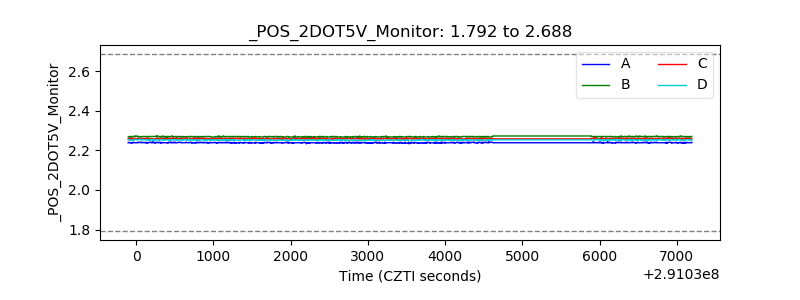 |
| +5 Volts monitor | 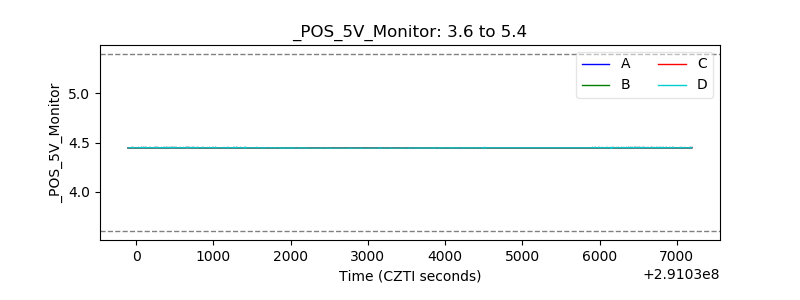 |
| _ROLL_ROT | 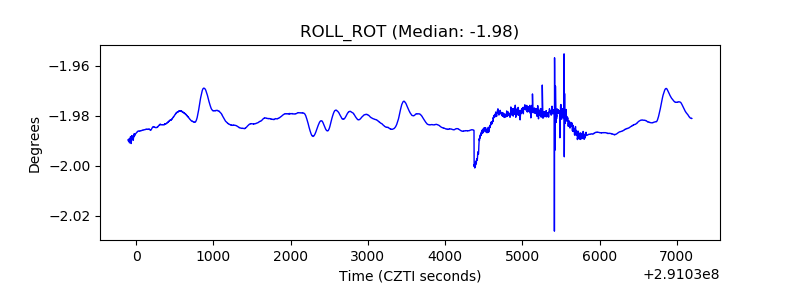 |
| _Roll_DEC |  |
| _Roll_RA | 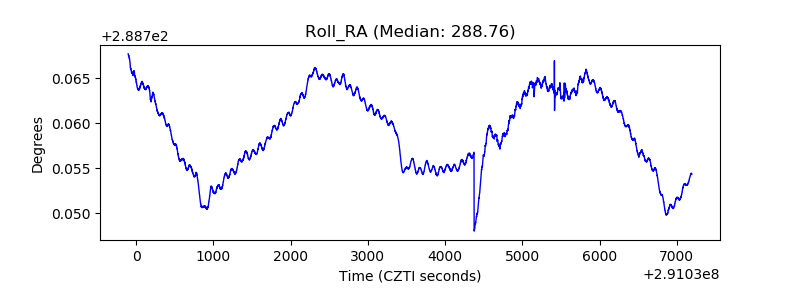 |
| Veto Counter | 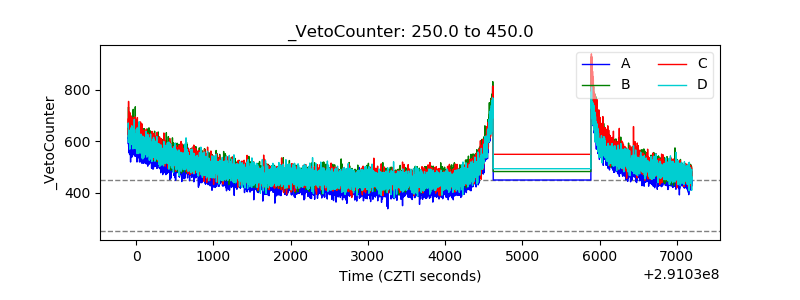 |