| Param | Original file | Final file |
|---|---|---|
| Filename | modeM0/AS1A05_173T01_9000002812_18833cztM0_level2.evt | modeM0/AS1A05_173T01_9000002812_18833cztM0_level2_quad_clean.evt |
| Size (bytes) | 528,595,200 | 82,846,080 |
| Size | 504.1 MB | 79.0 MB |
| Events in quadrant A | 3,339,396 | 529,986 |
| Events in quadrant B | 3,433,644 | 535,453 |
| Events in quadrant C | 3,296,019 | 508,105 |
| Events in quadrant D | 5,501,360 | 484,260 |
| Mode SS | |||
|---|---|---|---|
| Quadrant | BADHDUFLAG | Total packets | Discarded packets |
| A | 0 | 130 | 0 |
| B | 0 | 130 | 0 |
| C | 0 | 130 | 0 |
| D | 0 | 130 | 0 |
| Mode M9 | |||
|---|---|---|---|
| Quadrant | BADHDUFLAG | Total packets | Discarded packets |
| A | 0 | 11 | 0 |
| B | 0 | 11 | 0 |
| C | 0 | 11 | 0 |
| D | 0 | 11 | 0 |
| Mode M0 | |||
|---|---|---|---|
| Quadrant | BADHDUFLAG | Total packets | Discarded packets |
| A | 0 | 13534 | 1 |
| B | 0 | 13807 | 1 |
| C | 0 | 13429 | 1 |
| D | 0 | 20566 | 1 |
| Quadrant | Total seconds | Saturated seconds | Saturation percentage |
|---|---|---|---|
| A | 6467 | 100 | 1.546312% |
| B | 6468 | 87 | 1.345083% |
| C | 6468 | 87 | 1.345083% |
| D | 6468 | 483 | 7.467532% |
Noise dominated data is calculated using 1-second bins in cleaned event files. If a bin has >2000 counts, and if more than 50% of those come from <1% of pixels, then it is considered to be noise-dominated and hence unusable.
| Quadrant | # 1 sec bins | Bins with >0 counts | Bins with >2000 counts | High rate bins dominated by noise | Noise dominated (total time) | Noise dominated (detector-on time) | Marked lightcurve |
|---|---|---|---|---|---|---|---|
| A | 7527 | 6469 | 3 | 3 | 0.04% | 0.05% | 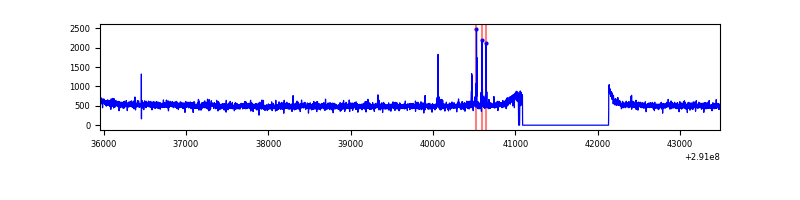 |
| B | 7528 | 6470 | 2 | 2 | 0.03% | 0.03% | 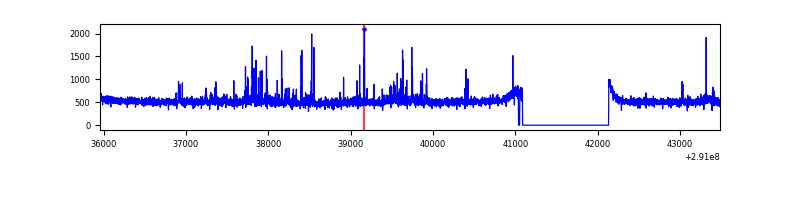 |
| C | 7528 | 6470 | 1 | 1 | 0.01% | 0.02% | 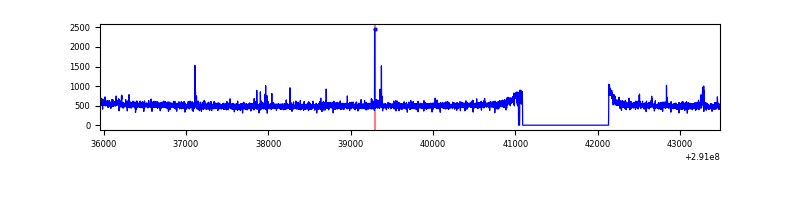 |
| D | 7528 | 6470 | 390 | 390 | 5.18% | 6.03% | 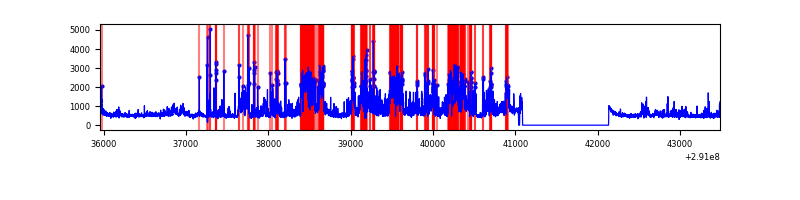 |
Top three noisy pixels from each quadrant. If the there are fewer than three noisy pixels in the level2.evt file, extra rows are filled as -1
| Pixel properties | Quadrant properties | ||||||
|---|---|---|---|---|---|---|---|
| Quadrant | DetID | PixID | Counts | Sigma | Mean | Median | Sigma |
| A | 4 | 2 | 38745 | 221.34 | 847 | 831 | 171.3 |
| A | 8 | 205 | 14394 | 79.18 | 847 | 831 | 171.3 |
| A | 13 | 254 | 11025 | 59.51 | 847 | 831 | 171.3 |
| B | 7 | 220 | 45197 | 278.27 | 836 | 817 | 159.5 |
| B | 0 | 229 | 29770 | 181.54 | 836 | 817 | 159.5 |
| B | 4 | 216 | 29393 | 179.18 | 836 | 817 | 159.5 |
| C | 14 | 238 | 124733 | 662.15 | 799 | 805 | 187.2 |
| C | 0 | 207 | 25998 | 134.61 | 799 | 805 | 187.2 |
| C | 5 | 112 | 15948 | 80.91 | 799 | 805 | 187.2 |
| D | 7 | 238 | 1659010 | 8485.47 | 803 | 781 | 195.4 |
| D | 7 | 38 | 493304 | 2520.33 | 803 | 781 | 195.4 |
| D | 1 | 52 | 267434 | 1364.51 | 803 | 781 | 195.4 |
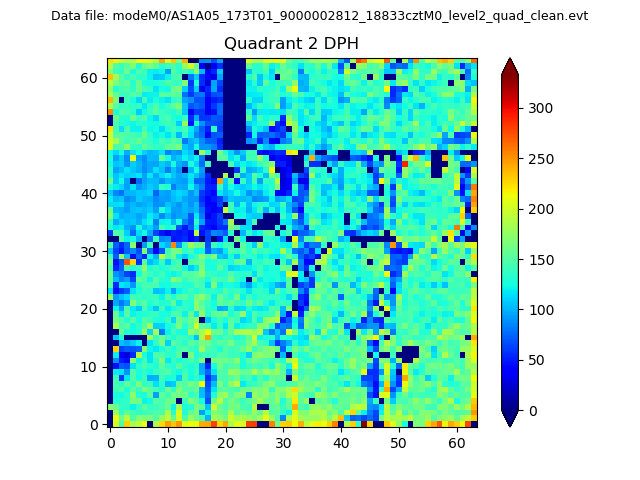
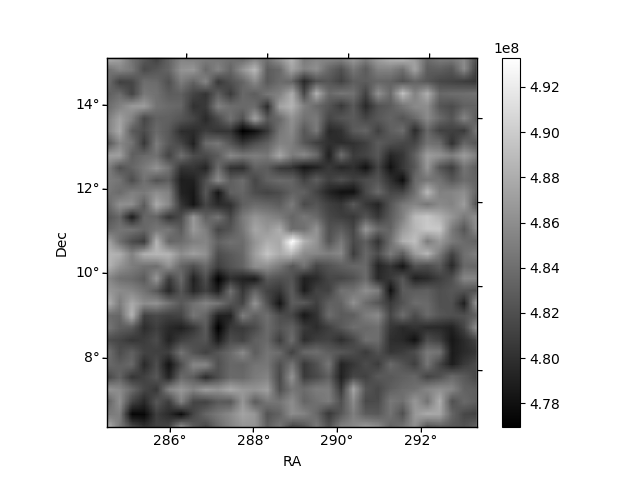
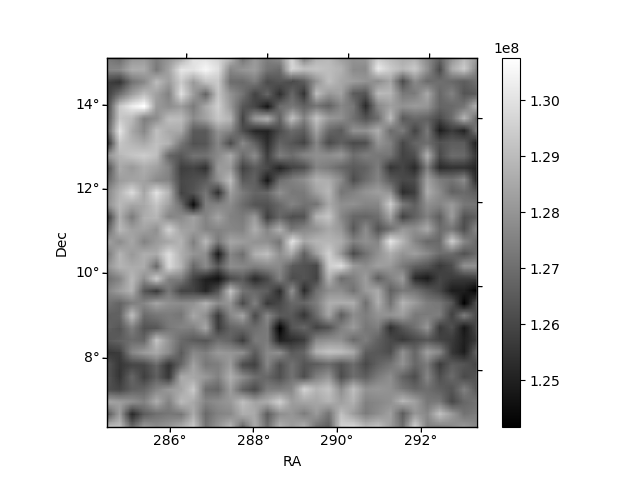
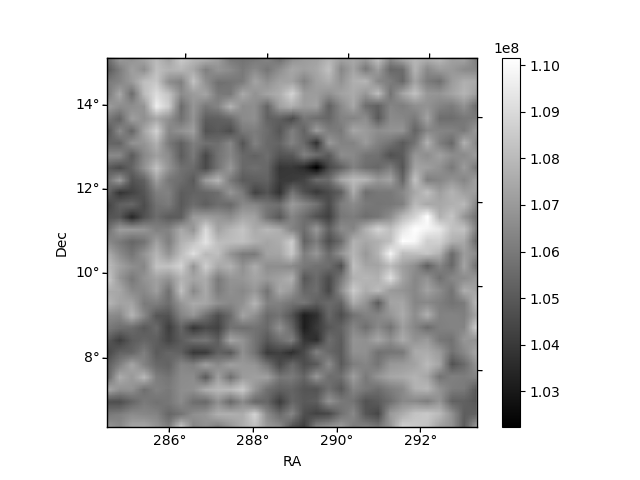
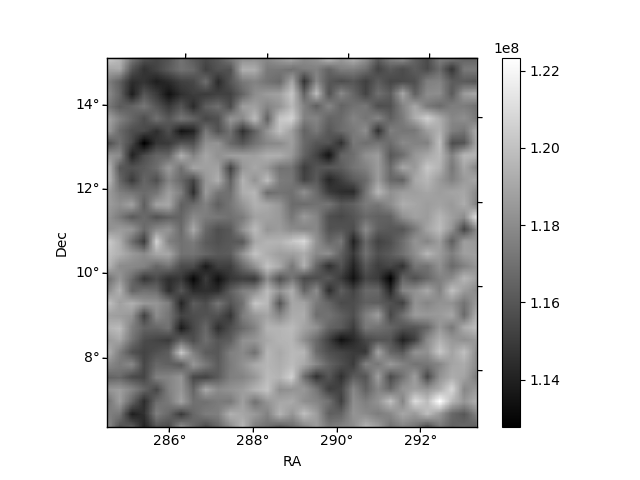
Histogram calculated using DETX and DETY for each event in the final _common_clean file
| Quadrant A | 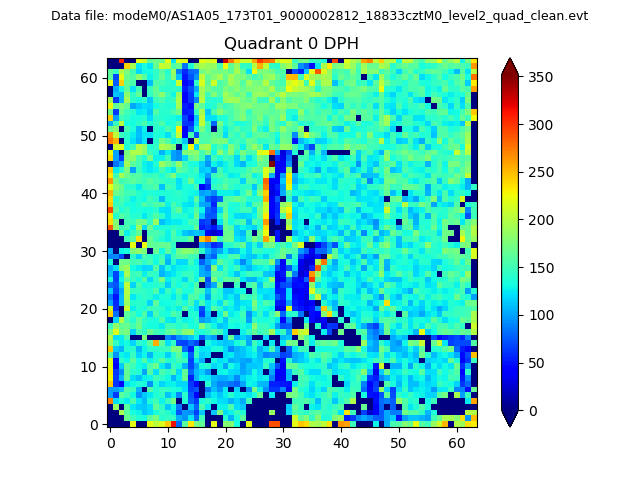 |
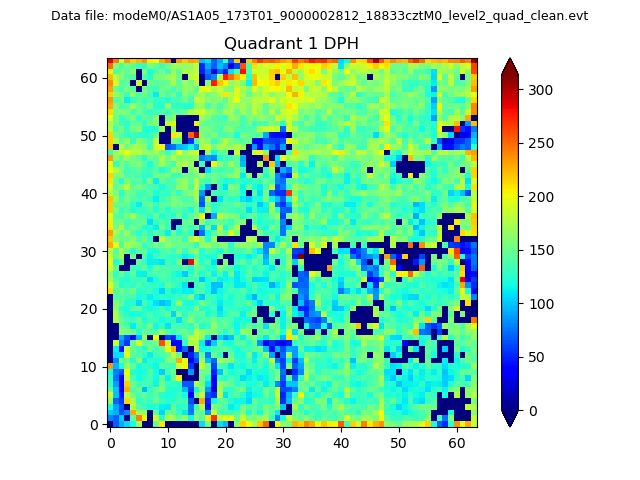 |
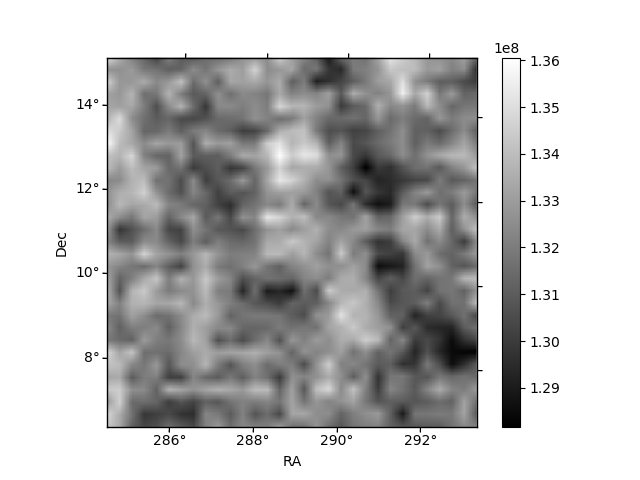
Quadrant B |
|---|---|---|---|
| Quadrant D | 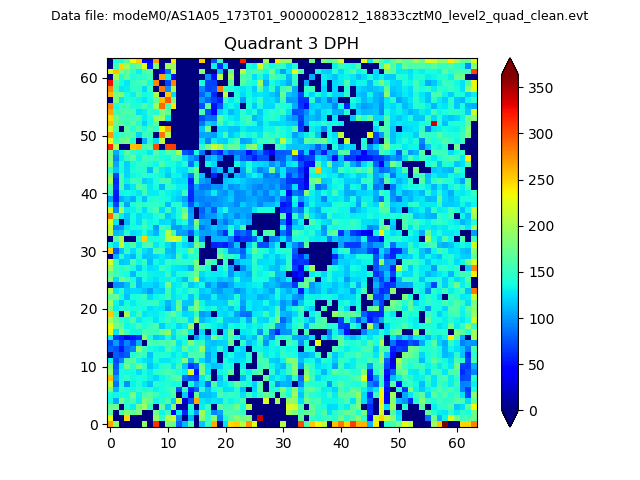 |
 |
Quadrant C |
| Plot type | Count rate plots | Images |
|---|---|---|
| Comparison with Poisson distribution Blue bars denote a histogram of data divided into 1 sec bins. Red curve is a Poisson curve with rate = median count rate of data. |
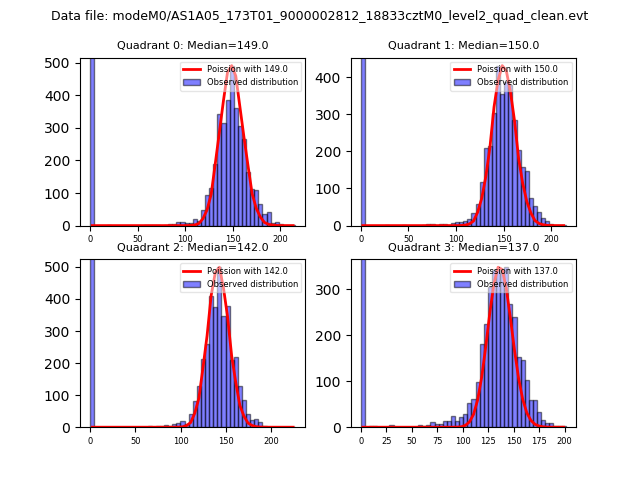 |
 |
| Quadrant-wise count rates Data is divided into 100 sec bins |
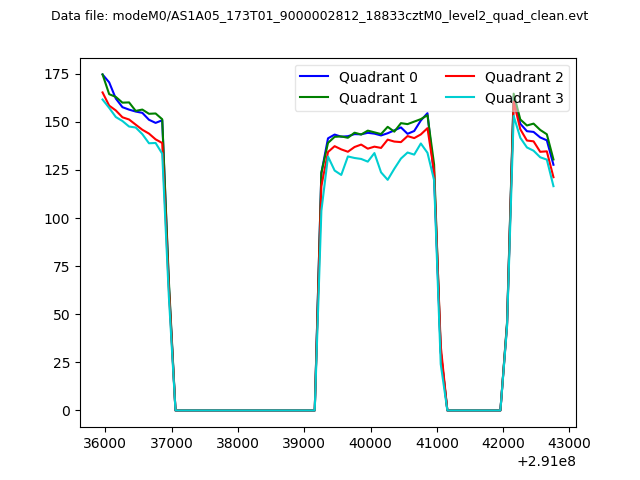 |
|
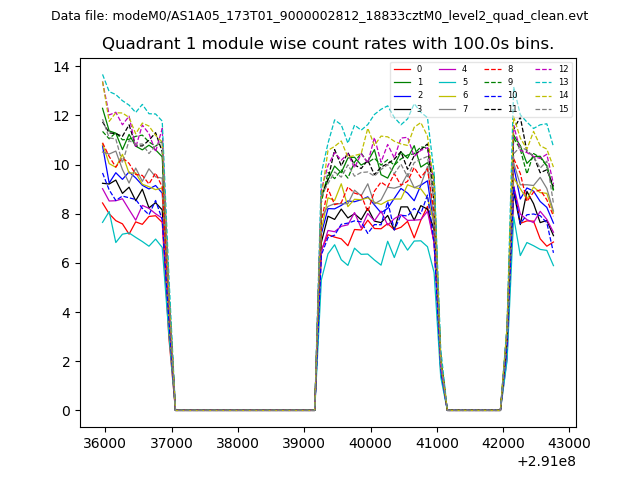
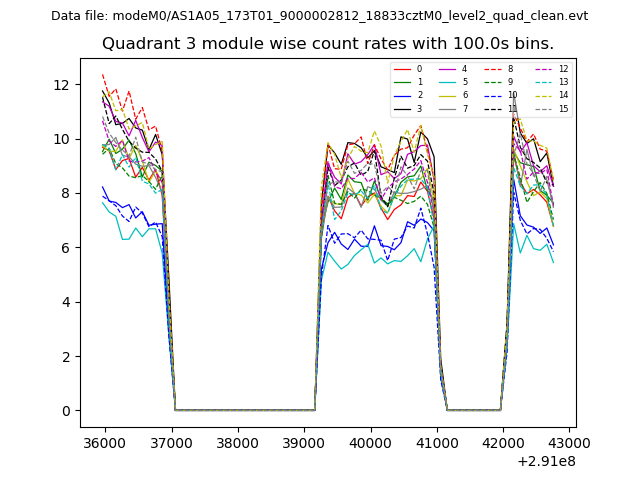
| Module-wise count rates for Quadrant A Data is divided into 100 sec bins |
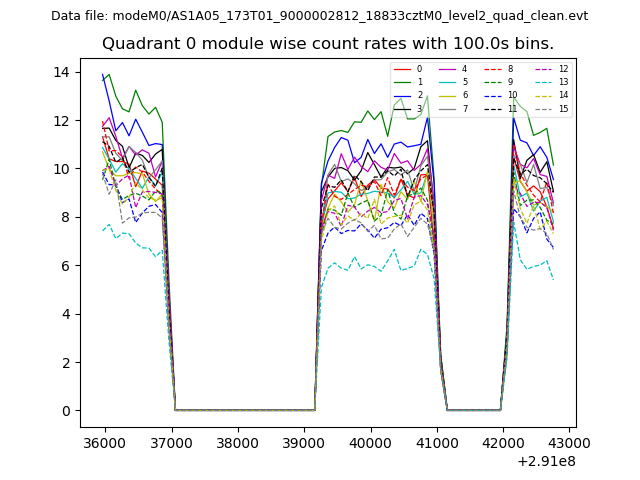 |
 |
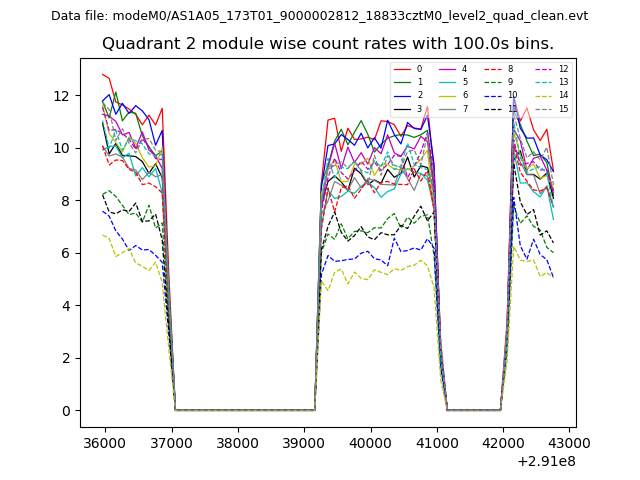
| Module-wise count rates for Quadrant B Data is divided into 100 sec bins |
 |
 |
| Module-wise count rates for Quadrant C Data is divided into 100 sec bins |
 |
 |
| Module-wise count rates for Quadrant D Data is divided into 100 sec bins |
 |
 |
| Parameter | Plot |
|---|---|
| CZT HV Monitor | 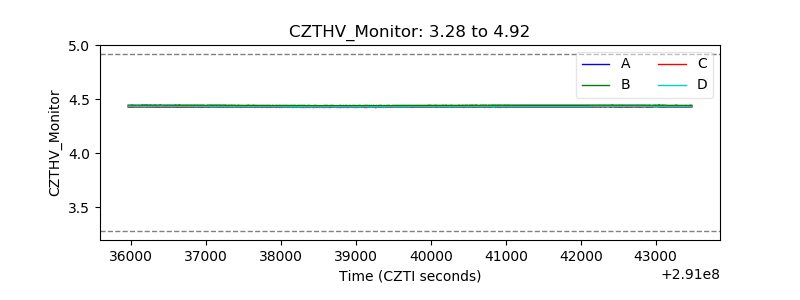 |
| D_VDD | 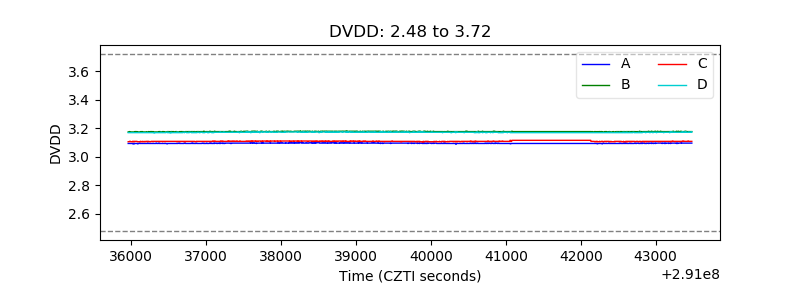 |
| Temperature 1 |  |
| Veto HV Monitor | 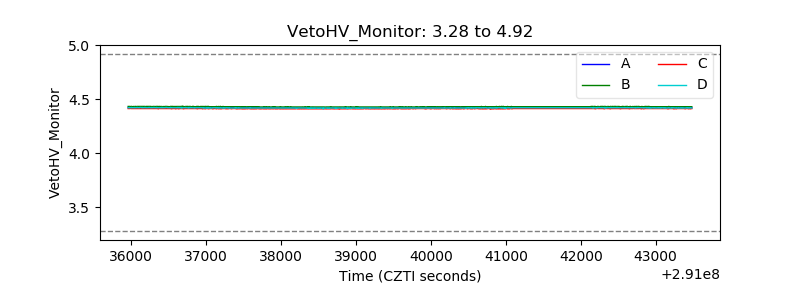 |
| Veto LLD | 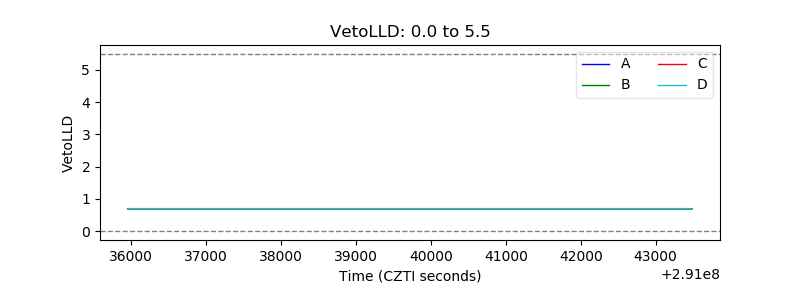 |
| Alpha Counter | 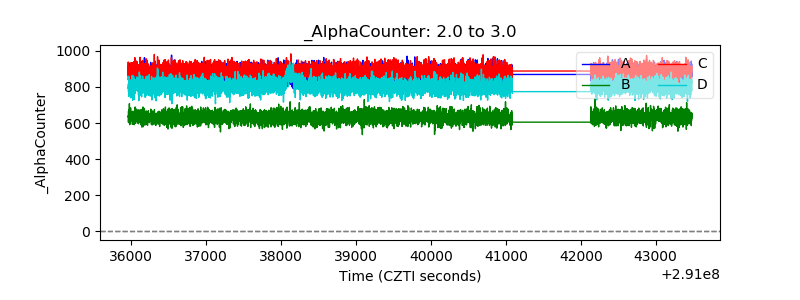 |
| _CPM_Rate | 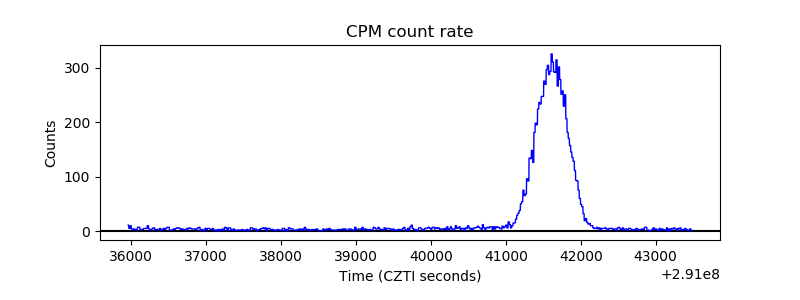 |
| CZT Counter | 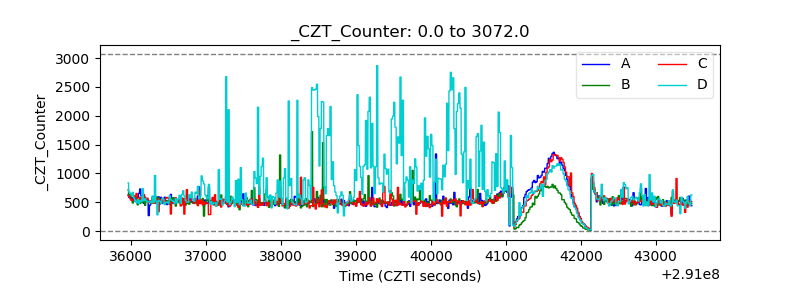 |
| +2.5 Volts monitor |  |
| +5 Volts monitor | 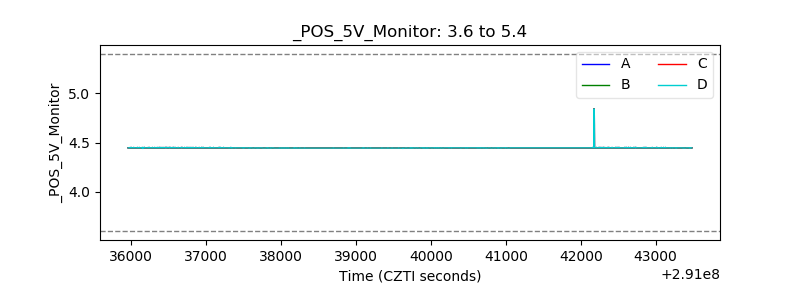 |
| _ROLL_ROT | 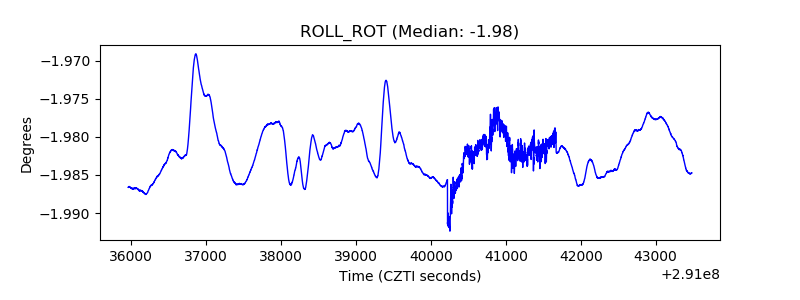 |
| _Roll_DEC | 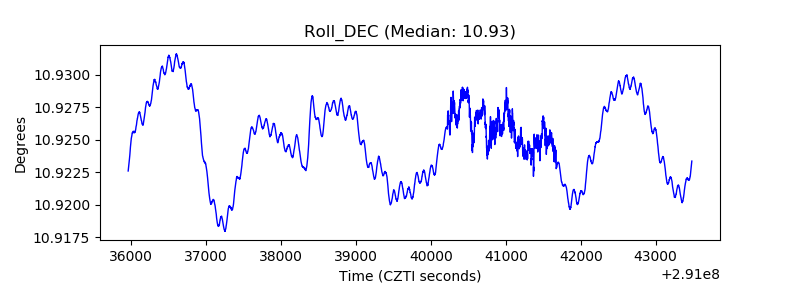 |
| _Roll_RA | 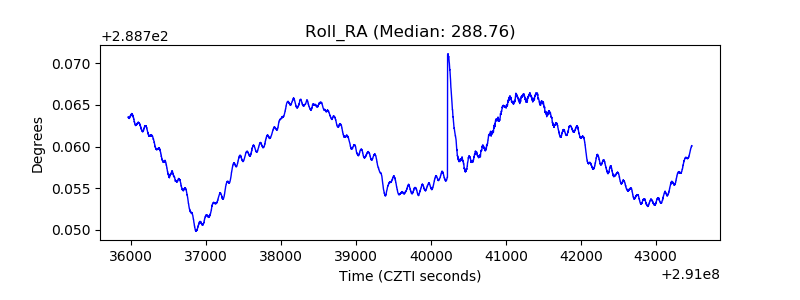 |
| Veto Counter | 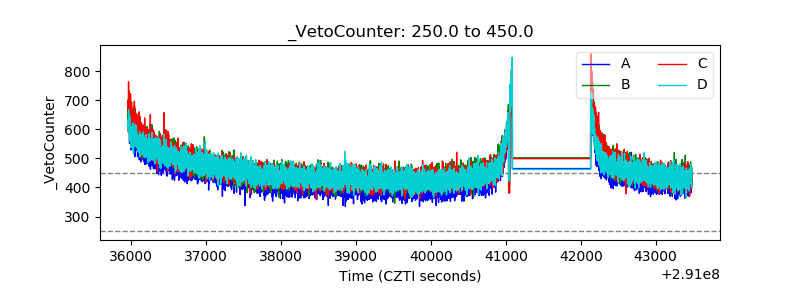 |