| Param | Original file | Final file |
|---|---|---|
| Filename | modeM0/AS1A05_173T01_9000002812_18835cztM0_level2.evt | modeM0/AS1A05_173T01_9000002812_18835cztM0_level2_quad_clean.evt |
| Size (bytes) | 541,428,480 | 72,319,680 |
| Size | 516.3 MB | 69.0 MB |
| Events in quadrant A | 3,509,217 | 435,267 |
| Events in quadrant B | 3,678,657 | 439,354 |
| Events in quadrant C | 3,532,616 | 421,678 |
| Events in quadrant D | 5,192,100 | 395,934 |
| Mode SS | |||
|---|---|---|---|
| Quadrant | BADHDUFLAG | Total packets | Discarded packets |
| A | 0 | 144 | 0 |
| B | 0 | 144 | 0 |
| C | 0 | 144 | 0 |
| D | 0 | 144 | 0 |
| Mode M9 | |||
|---|---|---|---|
| Quadrant | BADHDUFLAG | Total packets | Discarded packets |
| A | 0 | 3 | 0 |
| B | 0 | 3 | 0 |
| C | 0 | 3 | 0 |
| D | 0 | 3 | 0 |
| Mode M0 | |||
|---|---|---|---|
| Quadrant | BADHDUFLAG | Total packets | Discarded packets |
| A | 0 | 14844 | 1 |
| B | 0 | 15241 | 1 |
| C | 0 | 14906 | 1 |
| D | 0 | 20101 | 1 |
| Quadrant | Total seconds | Saturated seconds | Saturation percentage |
|---|---|---|---|
| A | 7145 | 90 | 1.259622% |
| B | 7146 | 118 | 1.651273% |
| C | 7146 | 145 | 2.029107% |
| D | 7146 | 378 | 5.289673% |
Noise dominated data is calculated using 1-second bins in cleaned event files. If a bin has >2000 counts, and if more than 50% of those come from <1% of pixels, then it is considered to be noise-dominated and hence unusable.
| Quadrant | # 1 sec bins | Bins with >0 counts | Bins with >2000 counts | High rate bins dominated by noise | Noise dominated (total time) | Noise dominated (detector-on time) | Marked lightcurve |
|---|---|---|---|---|---|---|---|
| A | 7490 | 7146 | 1 | 1 | 0.01% | 0.01% | 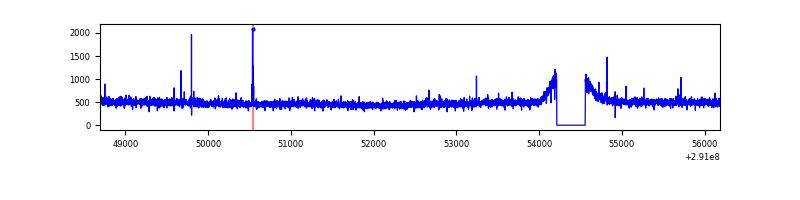 |
| B | 7491 | 7147 | 9 | 9 | 0.12% | 0.13% | 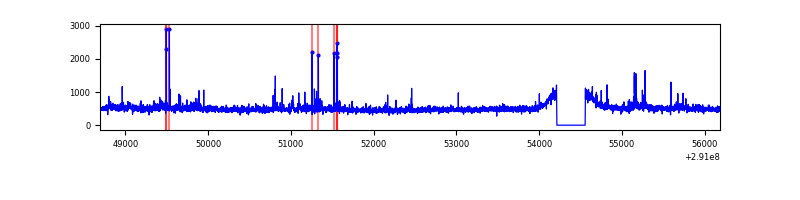 |
| C | 7491 | 7147 | 5 | 5 | 0.07% | 0.07% | 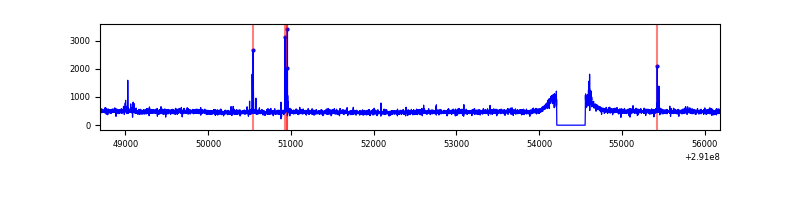 |
| D | 7491 | 7147 | 258 | 258 | 3.44% | 3.61% | 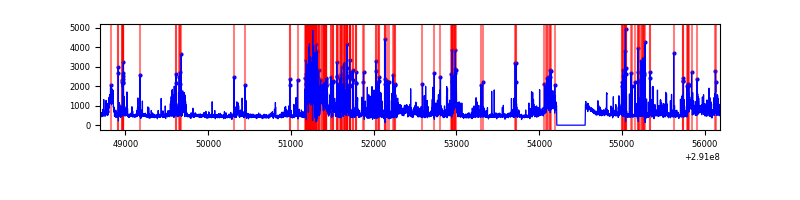 |
Top three noisy pixels from each quadrant. If the there are fewer than three noisy pixels in the level2.evt file, extra rows are filled as -1
| Pixel properties | Quadrant properties | ||||||
|---|---|---|---|---|---|---|---|
| Quadrant | DetID | PixID | Counts | Sigma | Mean | Median | Sigma |
| A | 9 | 143 | 12451 | 63.15 | 899 | 880 | 183.2 |
| A | 8 | 144 | 11521 | 58.08 | 899 | 880 | 183.2 |
| A | 13 | 254 | 11482 | 57.86 | 899 | 880 | 183.2 |
| B | 0 | 229 | 49069 | 277.89 | 894 | 871 | 173.4 |
| B | 4 | 216 | 30612 | 171.47 | 894 | 871 | 173.4 |
| B | 0 | 198 | 22601 | 125.29 | 894 | 871 | 173.4 |
| C | 14 | 238 | 130250 | 639.79 | 855 | 863 | 202.2 |
| C | 0 | 207 | 50549 | 245.69 | 855 | 863 | 202.2 |
| C | 3 | 233 | 10162 | 45.98 | 855 | 863 | 202.2 |
| D | 7 | 238 | 1368827 | 6453.04 | 859 | 835 | 212.0 |
| D | 1 | 52 | 350550 | 1649.66 | 859 | 835 | 212.0 |
| D | 7 | 38 | 107441 | 502.88 | 859 | 835 | 212.0 |
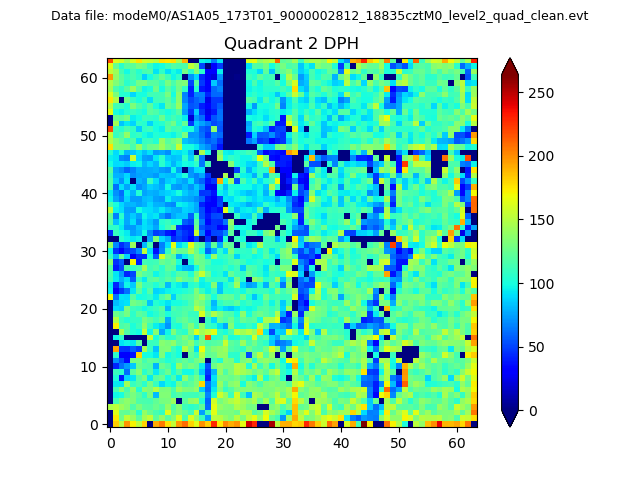
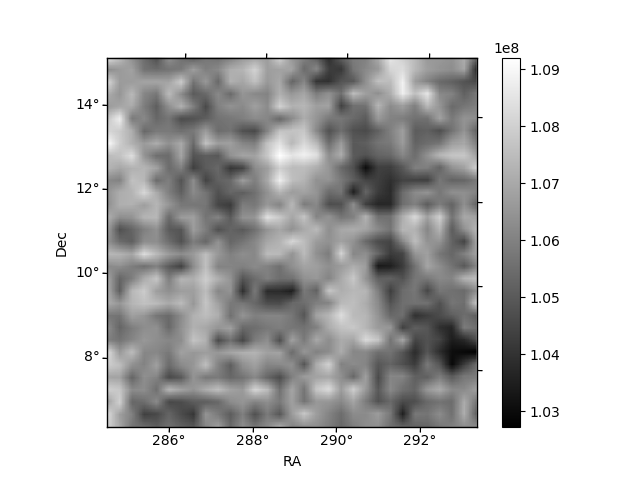
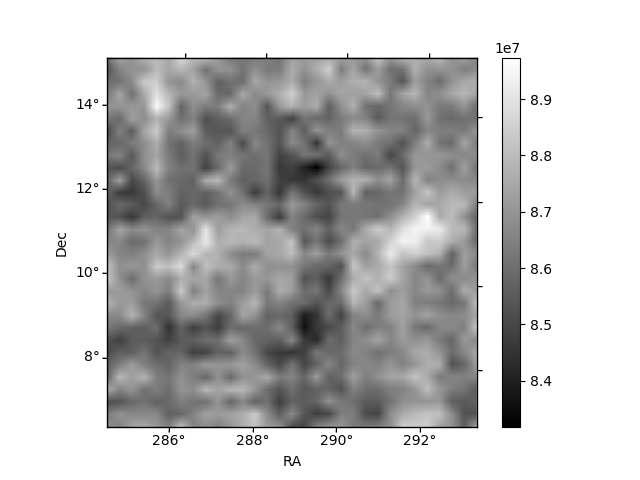
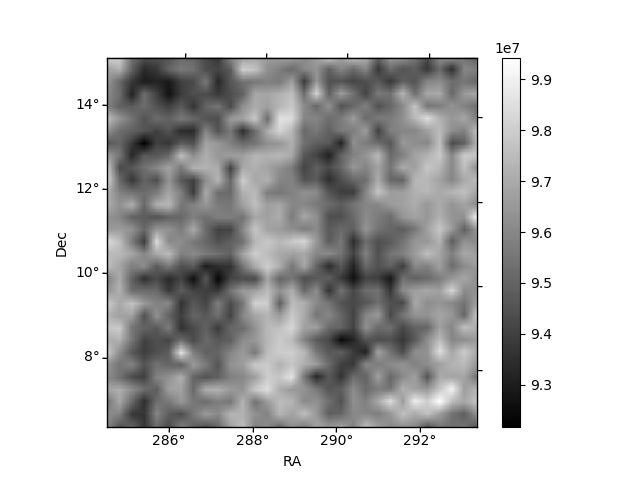
Histogram calculated using DETX and DETY for each event in the final _common_clean file
| Quadrant A | 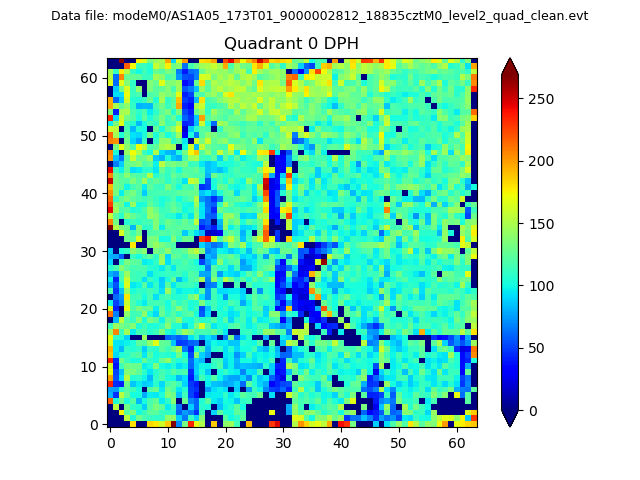 |
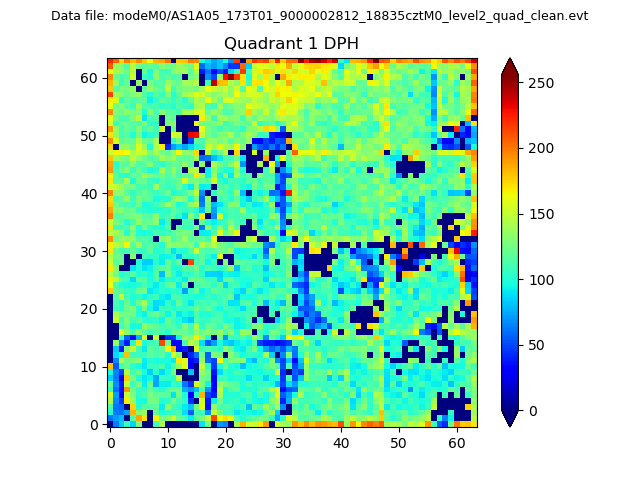 |
Quadrant B |
|---|---|---|---|
| Quadrant D | 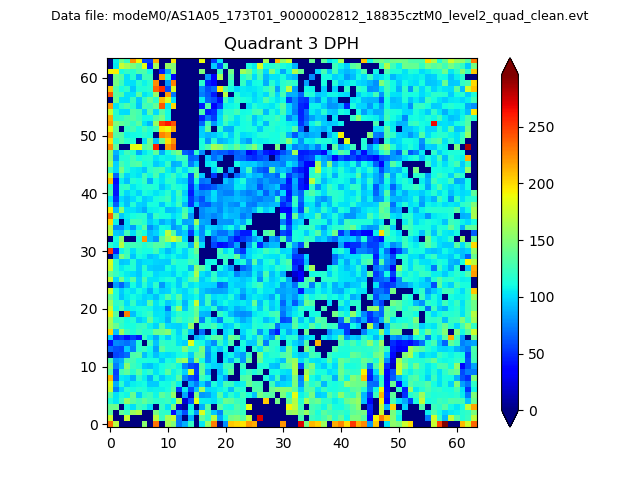 |
 |
Quadrant C |
| Plot type | Count rate plots | Images |
|---|---|---|
| Comparison with Poisson distribution Blue bars denote a histogram of data divided into 1 sec bins. Red curve is a Poisson curve with rate = median count rate of data. |
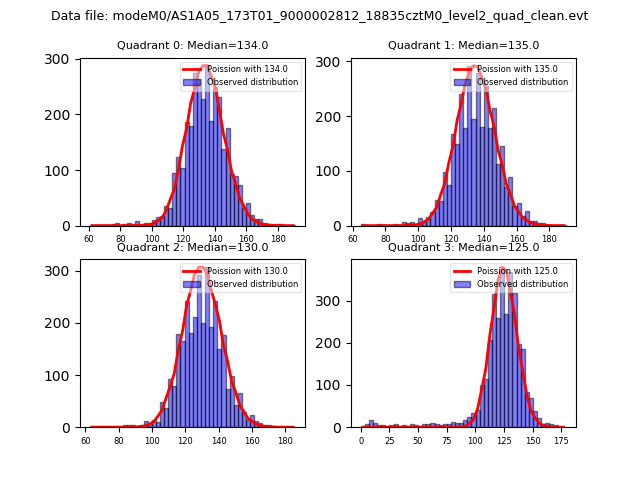 |
 |
| Quadrant-wise count rates Data is divided into 100 sec bins |
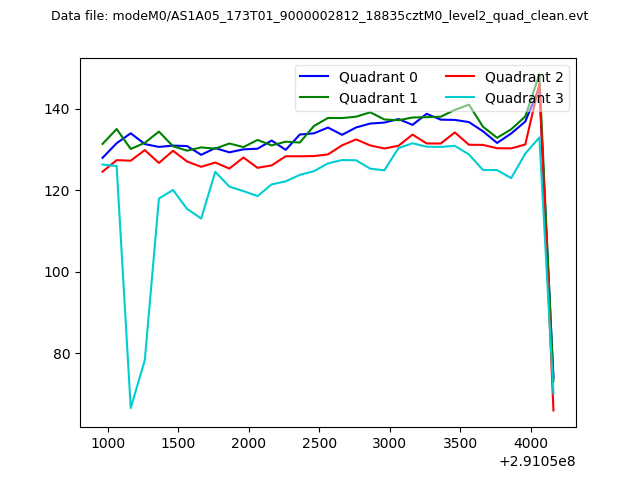 |
|
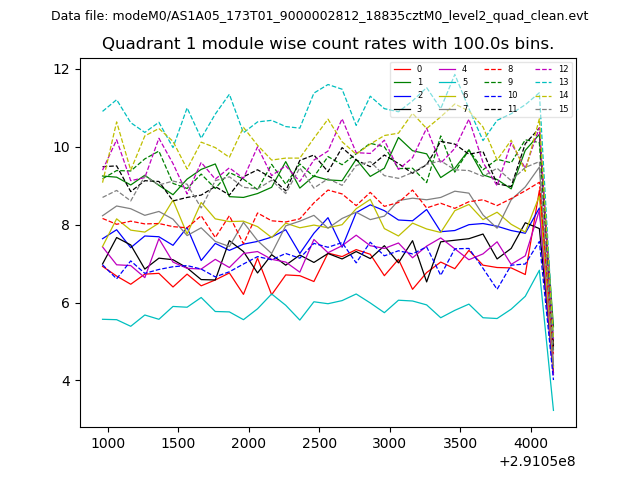
| Module-wise count rates for Quadrant A Data is divided into 100 sec bins |
 |
 |
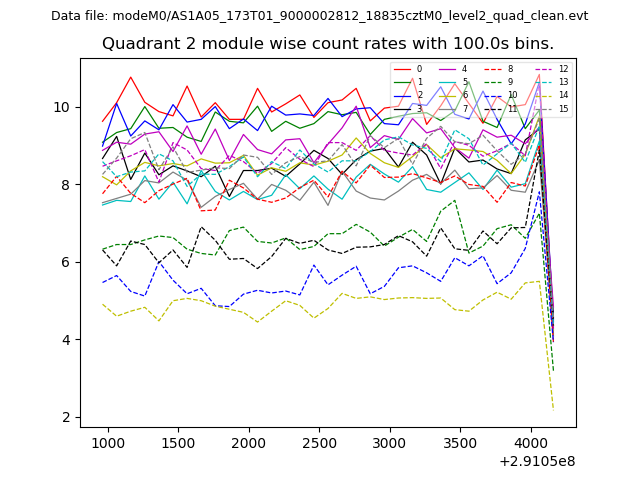
| Module-wise count rates for Quadrant B Data is divided into 100 sec bins |
 |
 |
| Module-wise count rates for Quadrant C Data is divided into 100 sec bins |
 |
 |
| Module-wise count rates for Quadrant D Data is divided into 100 sec bins |
 |
 |
| Parameter | Plot |
|---|---|
| CZT HV Monitor | 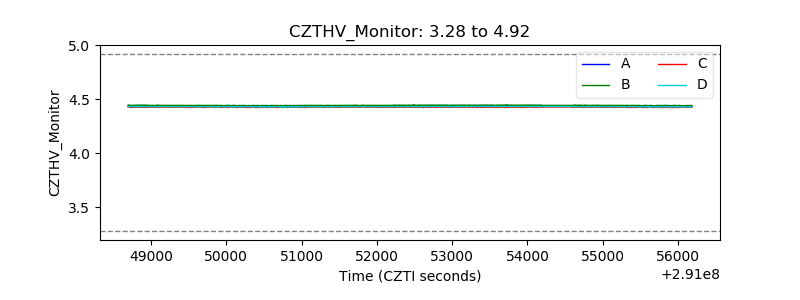 |
| D_VDD | 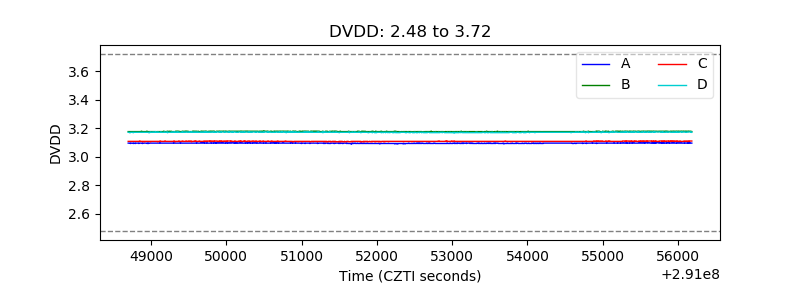 |
| Temperature 1 | 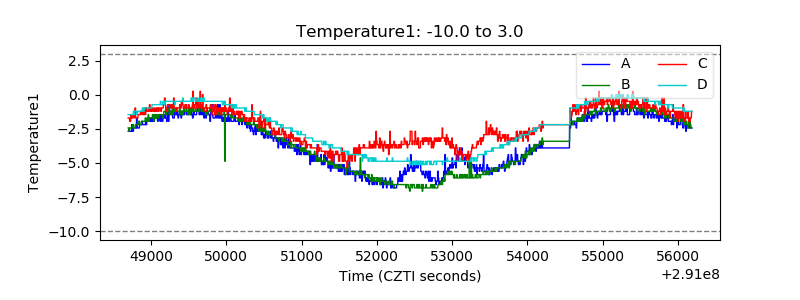 |
| Veto HV Monitor | 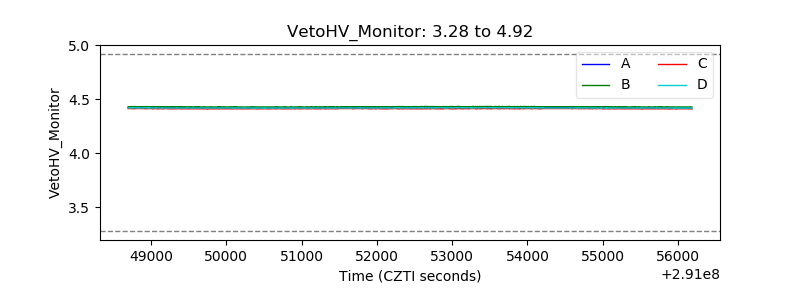 |
| Veto LLD | 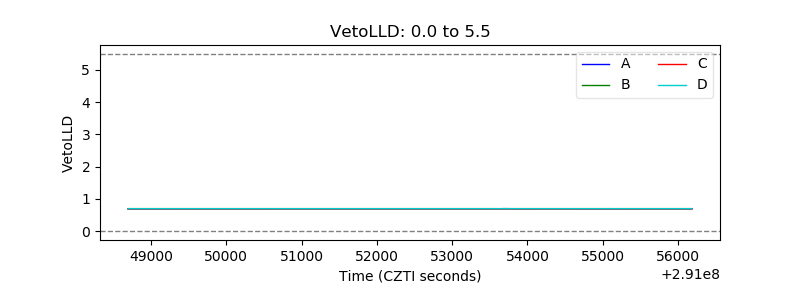 |
| Alpha Counter | 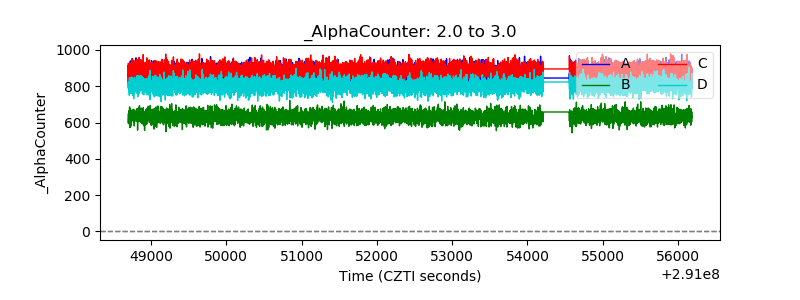 |
| _CPM_Rate | 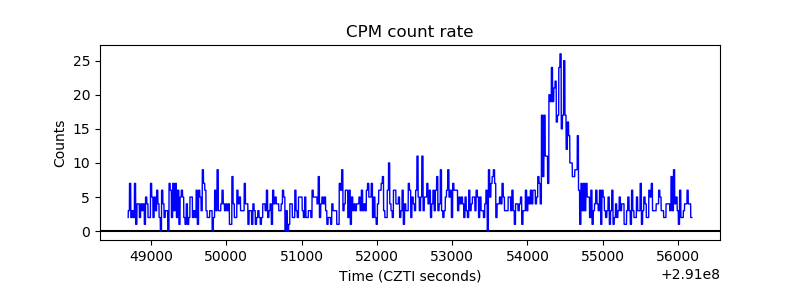 |
| CZT Counter | 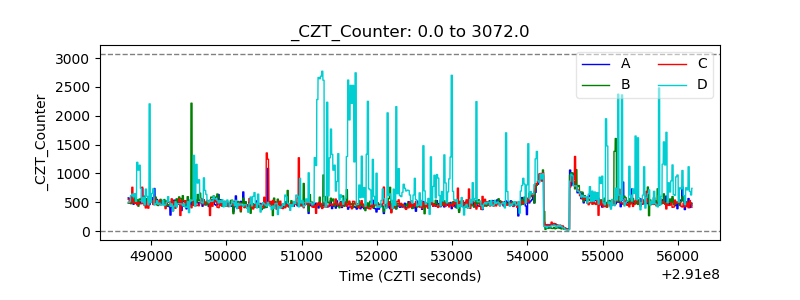 |
| +2.5 Volts monitor |  |
| +5 Volts monitor |  |
| _ROLL_ROT |  |
| _Roll_DEC | 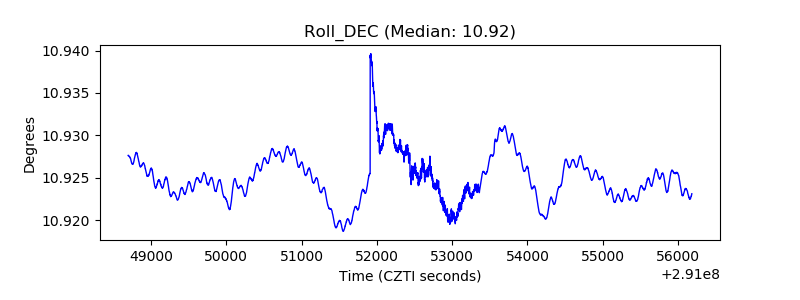 |
| _Roll_RA | 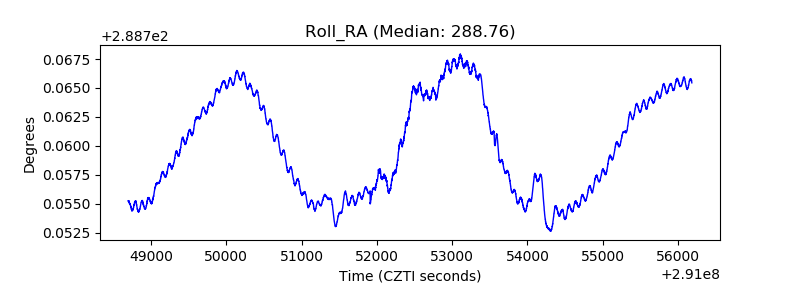 |
| Veto Counter | 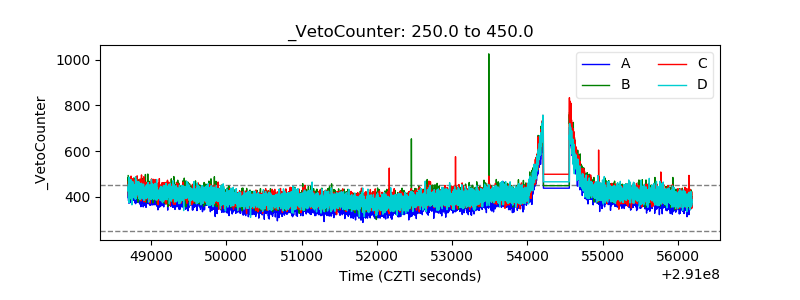 |