| Param | Original file | Final file |
|---|---|---|
| Filename | modeM0/AS1A05_173T01_9000002812_18836cztM0_level2.evt | modeM0/AS1A05_173T01_9000002812_18836cztM0_level2_quad_clean.evt |
| Size (bytes) | 561,196,800 | 77,414,400 |
| Size | 535.2 MB | 73.8 MB |
| Events in quadrant A | 3,662,492 | 470,802 |
| Events in quadrant B | 4,005,682 | 470,150 |
| Events in quadrant C | 3,728,370 | 454,877 |
| Events in quadrant D | 5,093,922 | 429,626 |
| Mode SS | |||
|---|---|---|---|
| Quadrant | BADHDUFLAG | Total packets | Discarded packets |
| A | 0 | 152 | 0 |
| B | 0 | 152 | 0 |
| C | 0 | 152 | 0 |
| D | 0 | 152 | 0 |
| Mode M9 | |||
|---|---|---|---|
| Quadrant | BADHDUFLAG | Total packets | Discarded packets |
| A | 0 | 2 | 0 |
| B | 0 | 2 | 0 |
| C | 0 | 2 | 0 |
| D | 0 | 2 | 0 |
| Mode M0 | |||
|---|---|---|---|
| Quadrant | BADHDUFLAG | Total packets | Discarded packets |
| A | 0 | 15497 | 1 |
| B | 0 | 16474 | 1 |
| C | 0 | 15690 | 2 |
| D | 0 | 20066 | 1 |
| Quadrant | Total seconds | Saturated seconds | Saturation percentage |
|---|---|---|---|
| A | 7447 | 72 | 0.966832% |
| B | 7448 | 129 | 1.732009% |
| C | 7447 | 155 | 2.081375% |
| D | 7447 | 366 | 4.914731% |
Noise dominated data is calculated using 1-second bins in cleaned event files. If a bin has >2000 counts, and if more than 50% of those come from <1% of pixels, then it is considered to be noise-dominated and hence unusable.
| Quadrant | # 1 sec bins | Bins with >0 counts | Bins with >2000 counts | High rate bins dominated by noise | Noise dominated (total time) | Noise dominated (detector-on time) | Marked lightcurve |
|---|---|---|---|---|---|---|---|
| A | 7732 | 7448 | 1 | 1 | 0.01% | 0.01% | 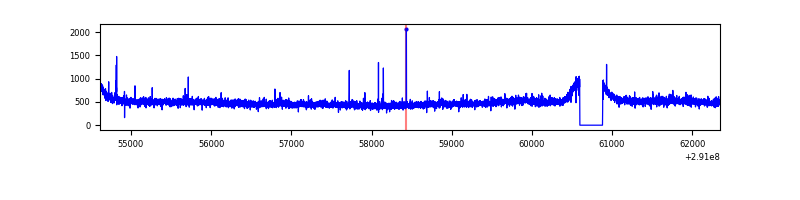 |
| B | 7733 | 7449 | 22 | 22 | 0.28% | 0.30% | 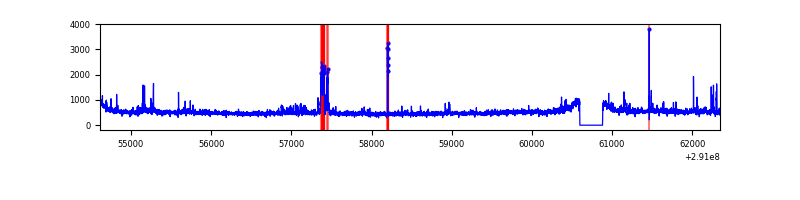 |
| C | 7732 | 7448 | 11 | 11 | 0.14% | 0.15% | 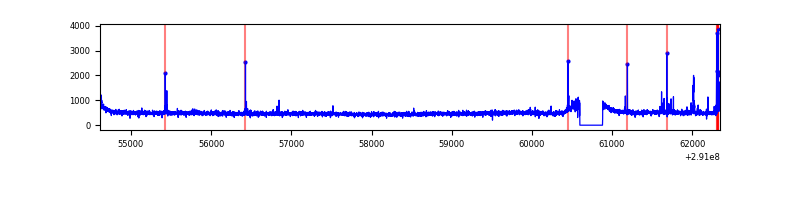 |
| D | 7732 | 7448 | 268 | 268 | 3.47% | 3.60% | 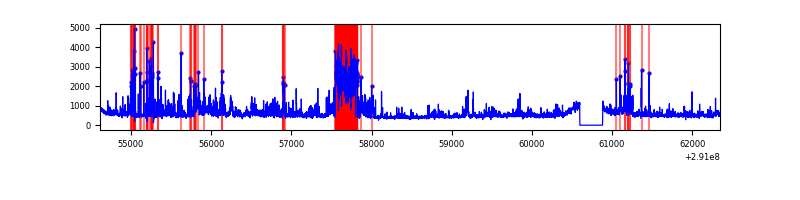 |
Top three noisy pixels from each quadrant. If the there are fewer than three noisy pixels in the level2.evt file, extra rows are filled as -1
| Pixel properties | Quadrant properties | ||||||
|---|---|---|---|---|---|---|---|
| Quadrant | DetID | PixID | Counts | Sigma | Mean | Median | Sigma |
| A | 13 | 254 | 13037 | 63.67 | 938 | 919 | 190.3 |
| A | 9 | 143 | 12145 | 58.98 | 938 | 919 | 190.3 |
| A | 11 | 29 | 11375 | 54.94 | 938 | 919 | 190.3 |
| B | 0 | 229 | 91316 | 496.8 | 931 | 908 | 182.0 |
| B | 12 | 18 | 59949 | 324.44 | 931 | 908 | 182.0 |
| B | 4 | 216 | 43183 | 232.3 | 931 | 908 | 182.0 |
| C | 14 | 238 | 135124 | 637.96 | 889 | 894 | 210.4 |
| C | 9 | 54 | 66387 | 311.27 | 889 | 894 | 210.4 |
| C | 0 | 207 | 32364 | 149.57 | 889 | 894 | 210.4 |
| D | 7 | 238 | 1104102 | 4990.15 | 899 | 874 | 221.1 |
| D | 1 | 52 | 312163 | 1408.03 | 899 | 874 | 221.1 |
| D | 12 | 225 | 126477 | 568.13 | 899 | 874 | 221.1 |
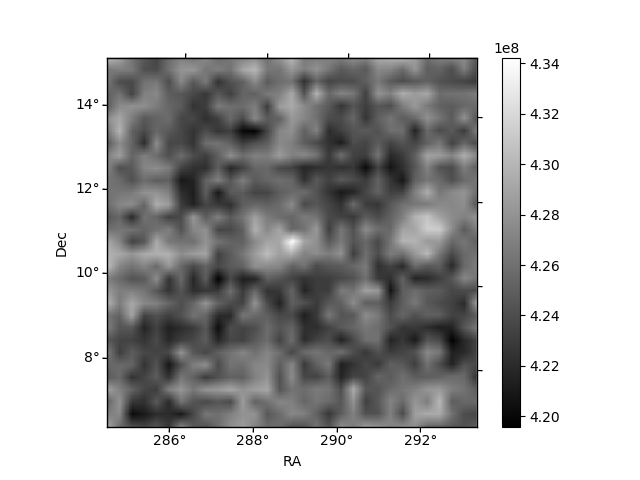
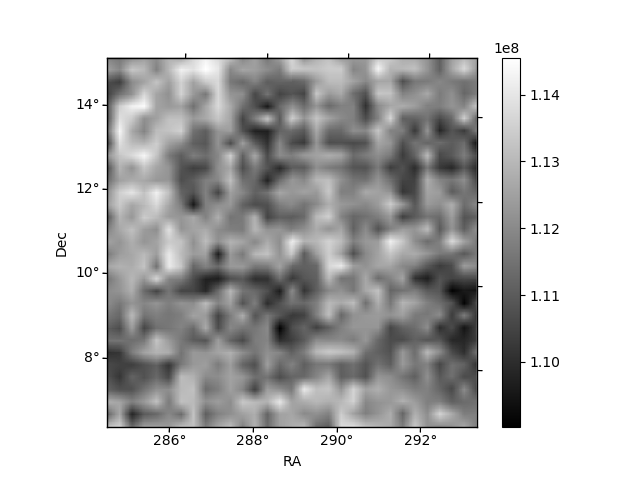
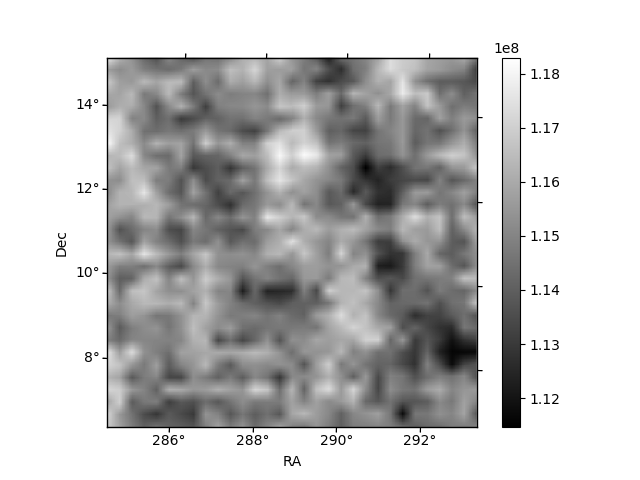
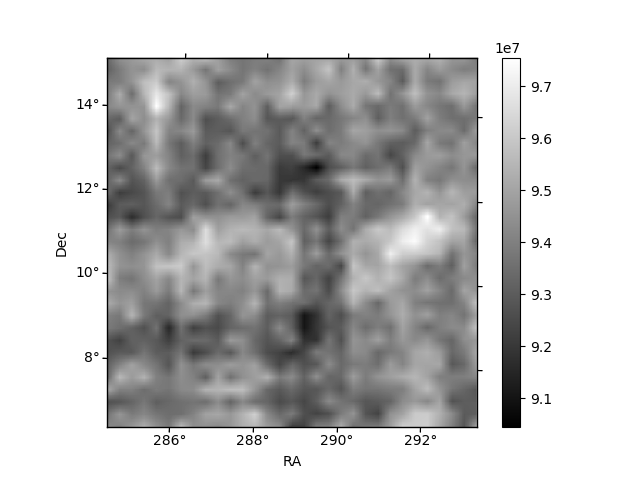
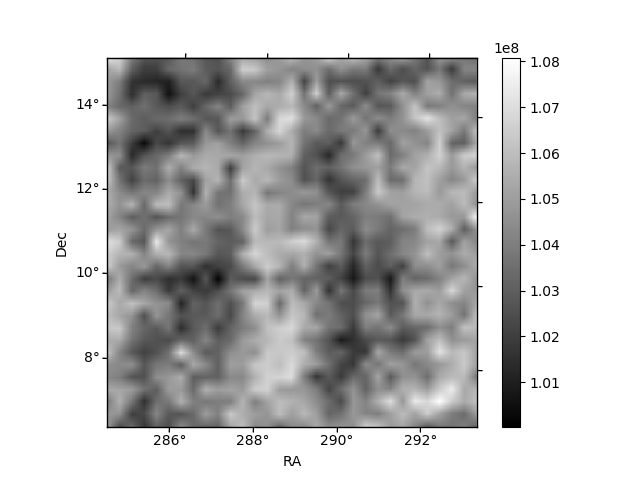
Histogram calculated using DETX and DETY for each event in the final _common_clean file
| Quadrant A | 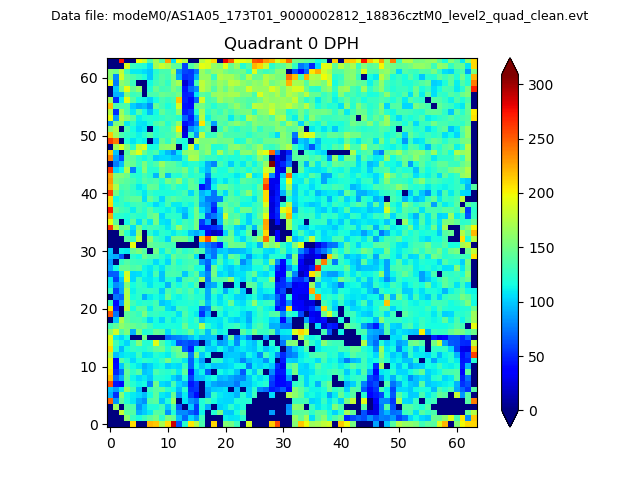 |
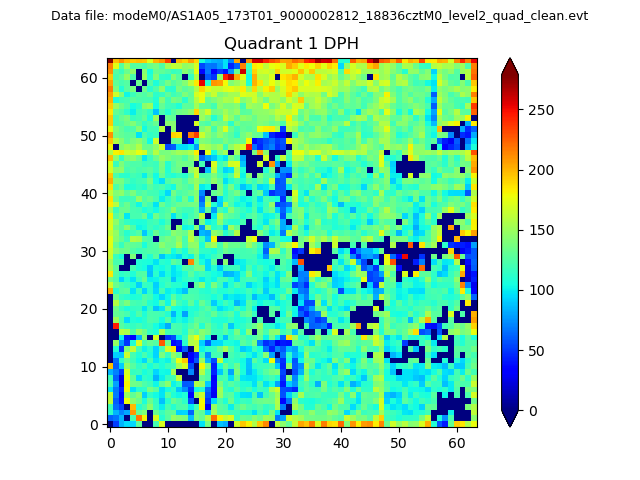 |
Quadrant B |
|---|---|---|---|
| Quadrant D | 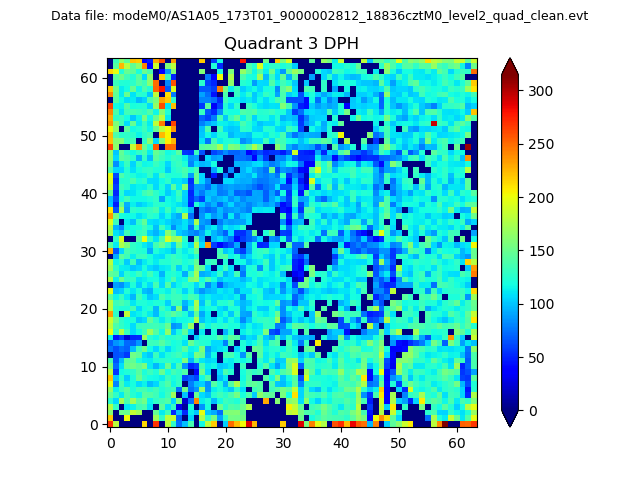 |
 |
Quadrant C |
| Plot type | Count rate plots | Images |
|---|---|---|
| Comparison with Poisson distribution Blue bars denote a histogram of data divided into 1 sec bins. Red curve is a Poisson curve with rate = median count rate of data. |
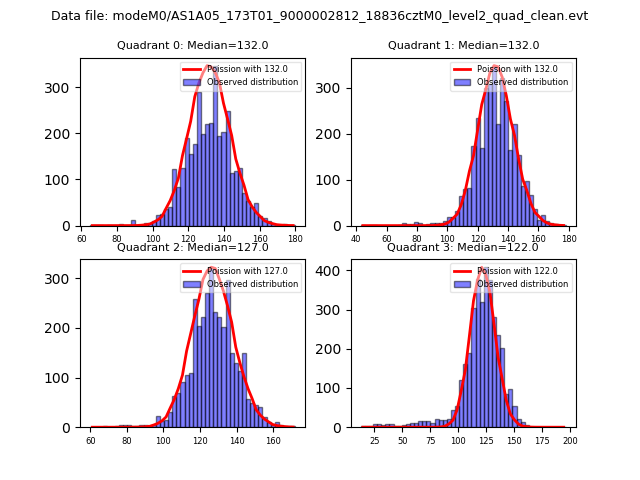 |
 |
| Quadrant-wise count rates Data is divided into 100 sec bins |
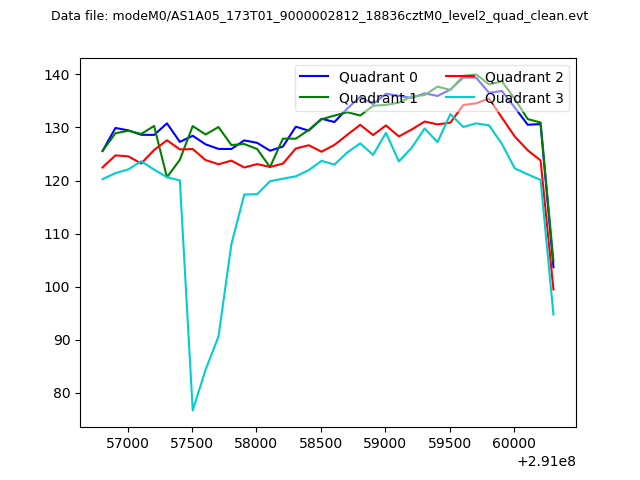 |
|
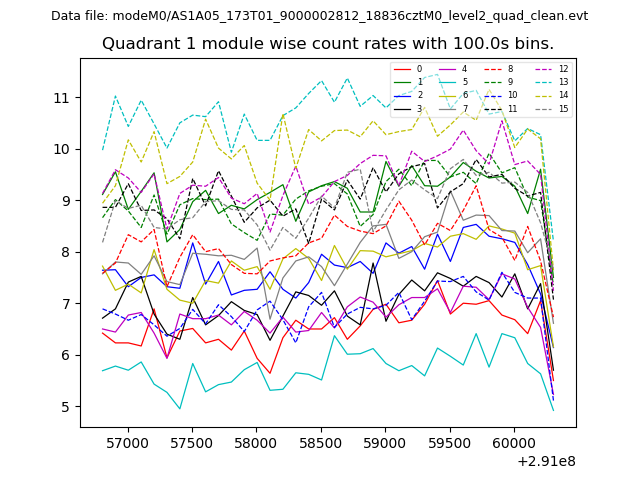
| Module-wise count rates for Quadrant A Data is divided into 100 sec bins |
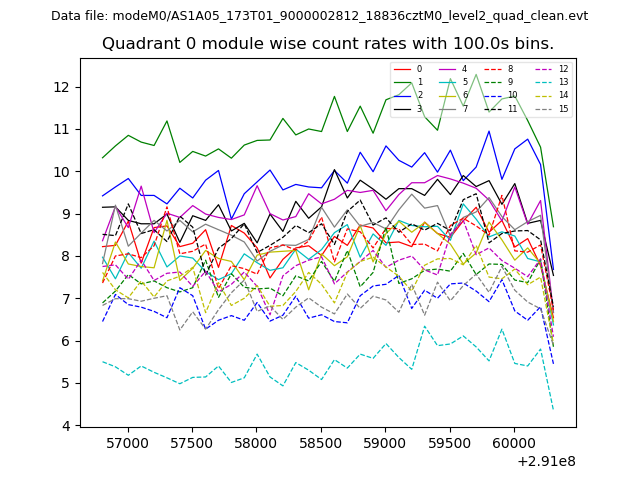 |
 |
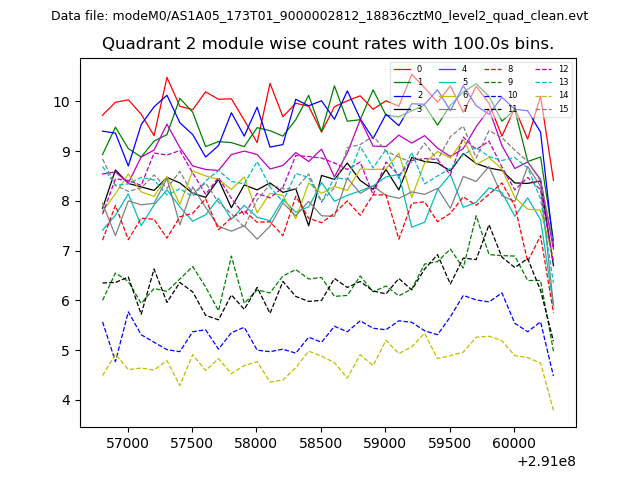
| Module-wise count rates for Quadrant B Data is divided into 100 sec bins |
 |
 |
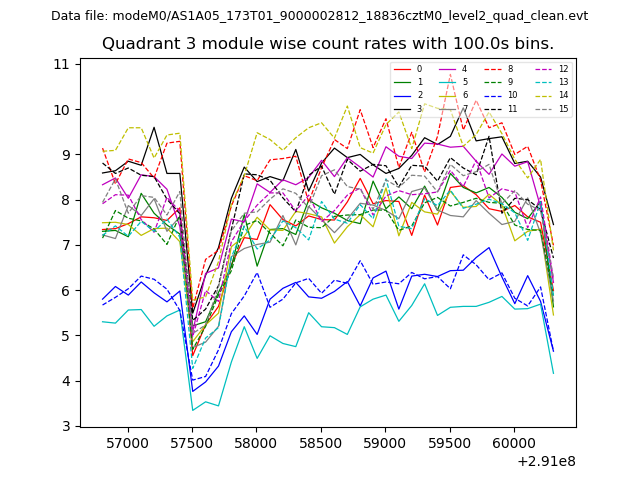
| Module-wise count rates for Quadrant C Data is divided into 100 sec bins |
 |
 |
| Module-wise count rates for Quadrant D Data is divided into 100 sec bins |
 |
 |
| Parameter | Plot |
|---|---|
| CZT HV Monitor | 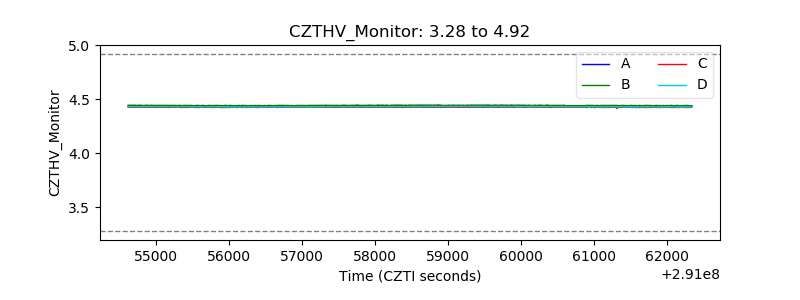 |
| D_VDD | 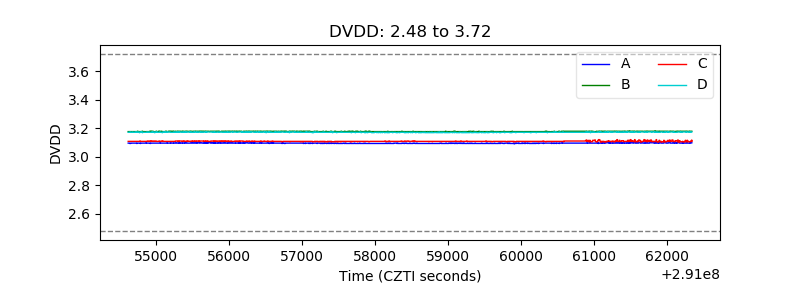 |
| Temperature 1 | 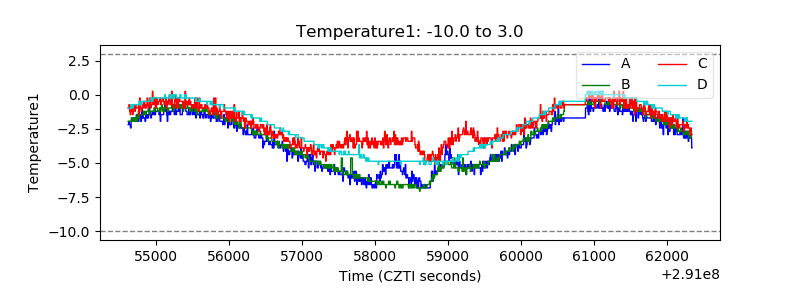 |
| Veto HV Monitor | 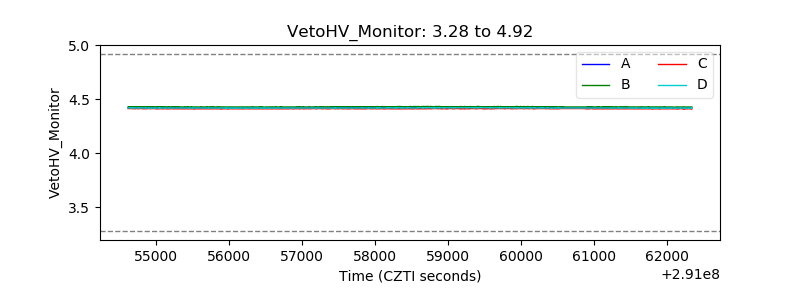 |
| Veto LLD | 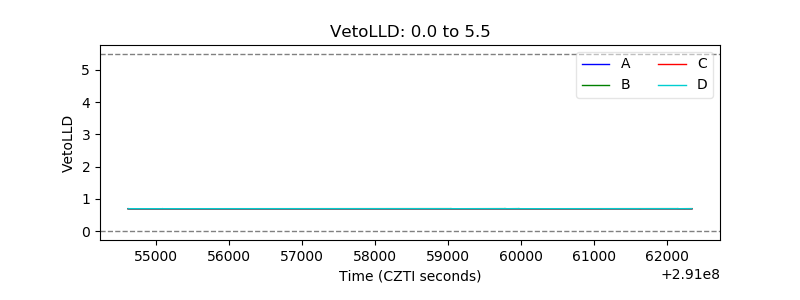 |
| Alpha Counter | 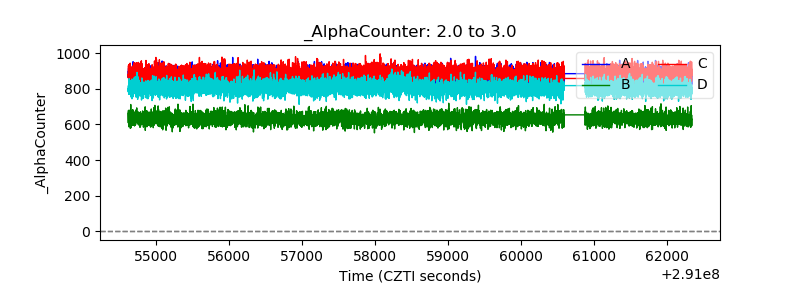 |
| _CPM_Rate | 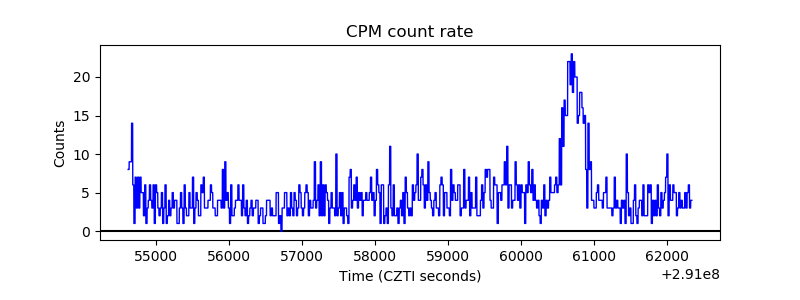 |
| CZT Counter | 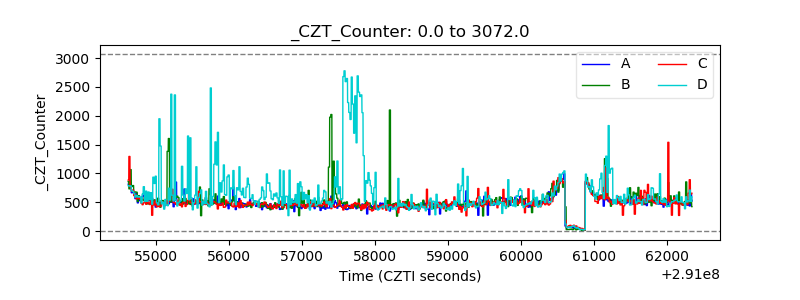 |
| +2.5 Volts monitor |  |
| +5 Volts monitor |  |
| _ROLL_ROT | 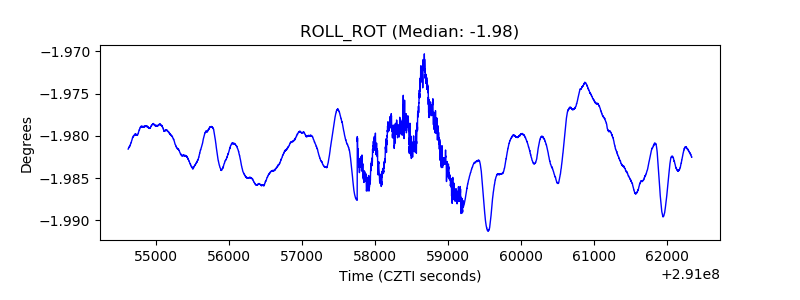 |
| _Roll_DEC | 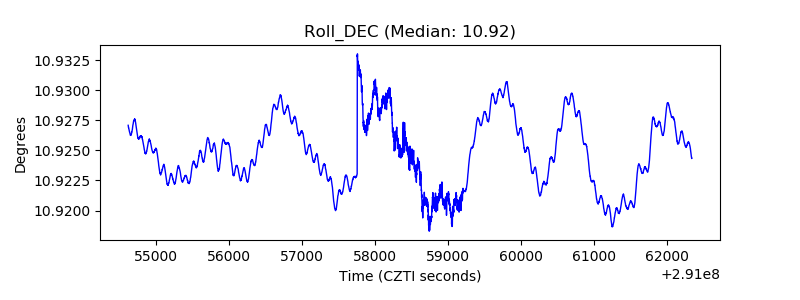 |
| _Roll_RA | 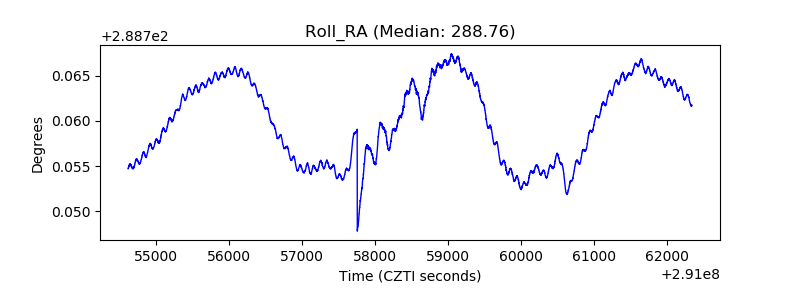 |
| Veto Counter | 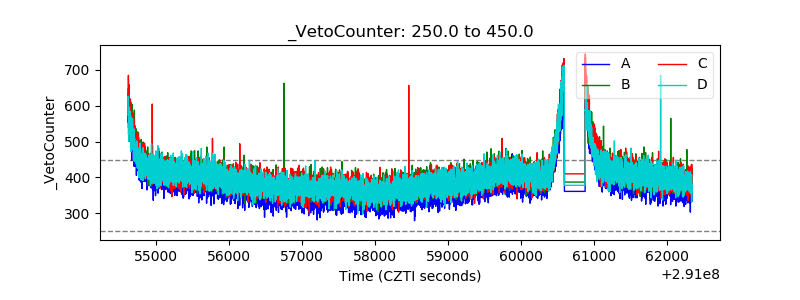 |