| Param | Original file | Final file |
|---|---|---|
| Filename | modeM0/AS1A05_173T01_9000002812_18839cztM0_level2.evt | modeM0/AS1A05_173T01_9000002812_18839cztM0_level2_quad_clean.evt |
| Size (bytes) | 932,181,120 | 166,492,800 |
| Size | 889.0 MB | 158.8 MB |
| Events in quadrant A | 6,439,333 | 1,059,335 |
| Events in quadrant B | 7,140,175 | 1,064,768 |
| Events in quadrant C | 6,288,848 | 1,032,998 |
| Events in quadrant D | 7,497,398 | 1,001,297 |
| Mode SS | |||
|---|---|---|---|
| Quadrant | BADHDUFLAG | Total packets | Discarded packets |
| A | 0 | 262 | 0 |
| B | 0 | 262 | 0 |
| C | 0 | 262 | 0 |
| D | 0 | 262 | 0 |
| Mode M9 | |||
|---|---|---|---|
| Quadrant | BADHDUFLAG | Total packets | Discarded packets |
| A | 0 | 18 | 0 |
| B | 0 | 18 | 0 |
| C | 0 | 18 | 0 |
| D | 0 | 18 | 0 |
| Mode M0 | |||
|---|---|---|---|
| Quadrant | BADHDUFLAG | Total packets | Discarded packets |
| A | 0 | 27356 | 3 |
| B | 0 | 29493 | 3 |
| C | 0 | 26657 | 3 |
| D | 0 | 31221 | 3 |
| Quadrant | Total seconds | Saturated seconds | Saturation percentage |
|---|---|---|---|
| A | 12791 | 196 | 1.532327% |
| B | 12791 | 256 | 2.001407% |
| C | 12791 | 178 | 1.391603% |
| D | 12792 | 269 | 2.102877% |
Noise dominated data is calculated using 1-second bins in cleaned event files. If a bin has >2000 counts, and if more than 50% of those come from <1% of pixels, then it is considered to be noise-dominated and hence unusable.
| Quadrant | # 1 sec bins | Bins with >0 counts | Bins with >2000 counts | High rate bins dominated by noise | Noise dominated (total time) | Noise dominated (detector-on time) | Marked lightcurve |
|---|---|---|---|---|---|---|---|
| A | 14561 | 12794 | 43 | 43 | 0.30% | 0.34% | 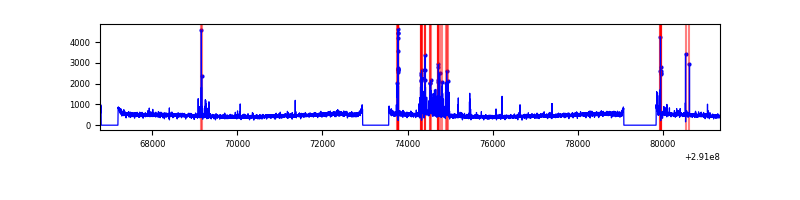 |
| B | 14561 | 12794 | 59 | 59 | 0.41% | 0.46% | 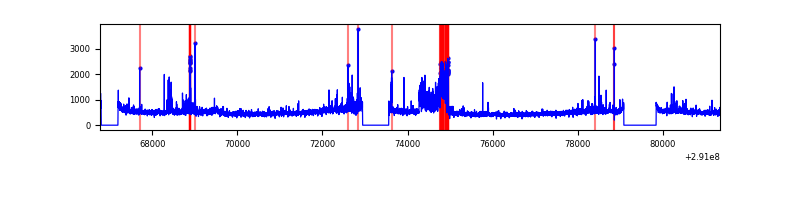 |
| C | 14561 | 12794 | 6 | 6 | 0.04% | 0.05% | 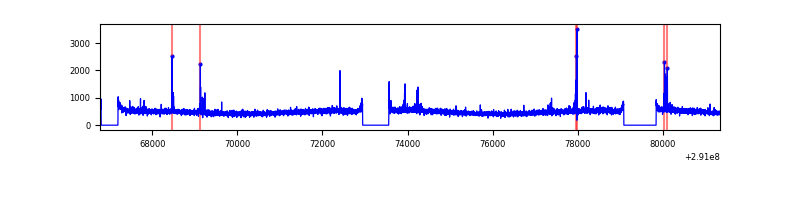 |
| D | 14562 | 12795 | 83 | 83 | 0.57% | 0.65% | 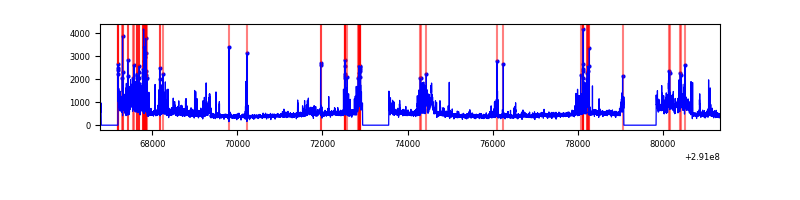 |
Top three noisy pixels from each quadrant. If the there are fewer than three noisy pixels in the level2.evt file, extra rows are filled as -1
| Pixel properties | Quadrant properties | ||||||
|---|---|---|---|---|---|---|---|
| Quadrant | DetID | PixID | Counts | Sigma | Mean | Median | Sigma |
| A | 8 | 144 | 203838 | 636.51 | 1563 | 1527 | 317.8 |
| A | 15 | 174 | 109283 | 339.02 | 1563 | 1527 | 317.8 |
| A | 9 | 143 | 60446 | 185.37 | 1563 | 1527 | 317.8 |
| B | 10 | 245 | 674246 | 2233.52 | 1563 | 1525 | 301.2 |
| B | 0 | 229 | 74485 | 242.24 | 1563 | 1525 | 301.2 |
| B | 4 | 216 | 43434 | 139.14 | 1563 | 1525 | 301.2 |
| C | 14 | 238 | 227664 | 644.09 | 1501 | 1509 | 351.1 |
| C | 3 | 233 | 79127 | 221.06 | 1501 | 1509 | 351.1 |
| C | 0 | 207 | 77612 | 216.74 | 1501 | 1509 | 351.1 |
| D | 7 | 238 | 607565 | 1621.0 | 1516 | 1472 | 373.9 |
| D | 9 | 68 | 463092 | 1234.6 | 1516 | 1472 | 373.9 |
| D | 1 | 52 | 310794 | 827.28 | 1516 | 1472 | 373.9 |
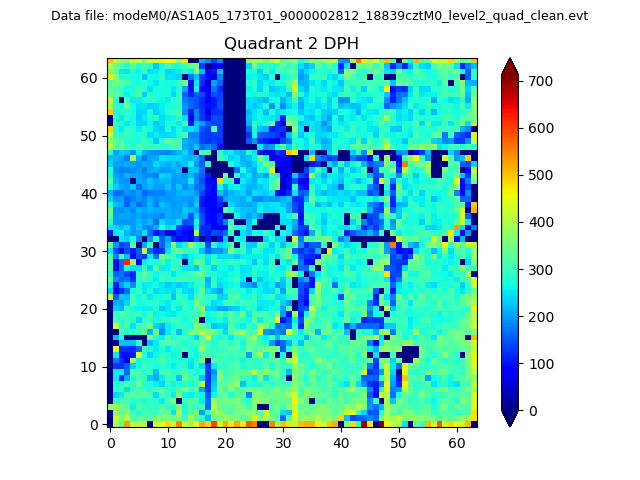
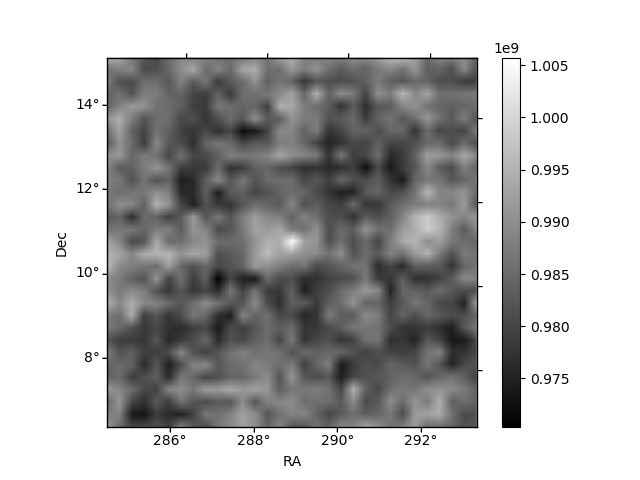
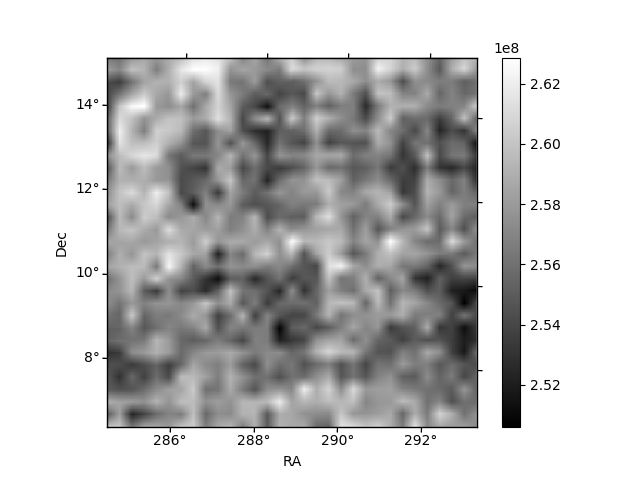
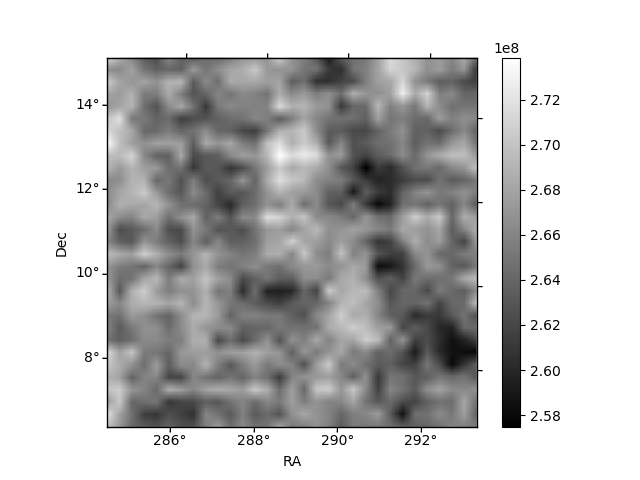
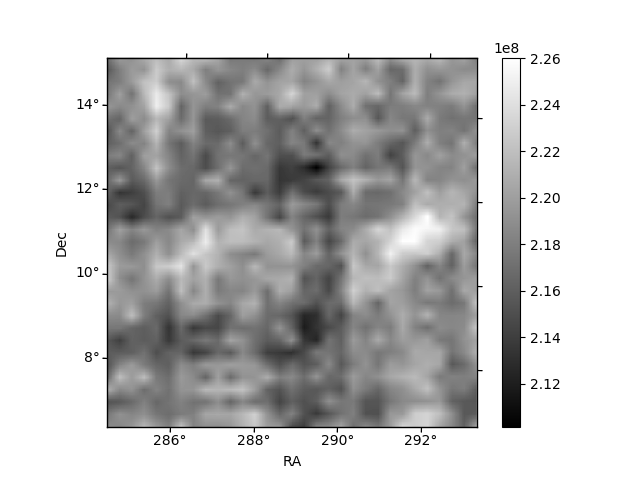
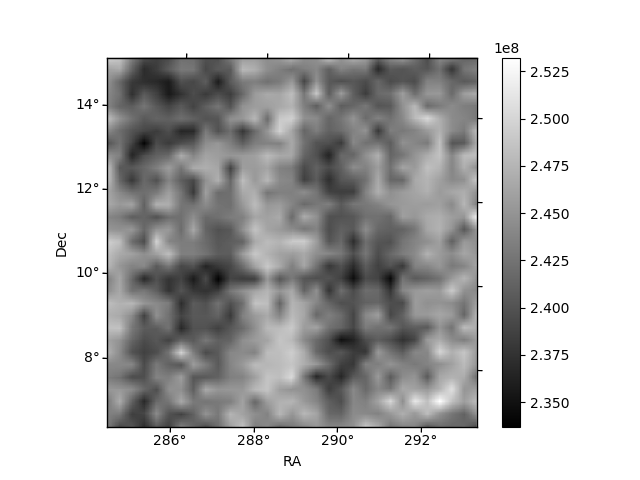
Histogram calculated using DETX and DETY for each event in the final _common_clean file
| Quadrant A | 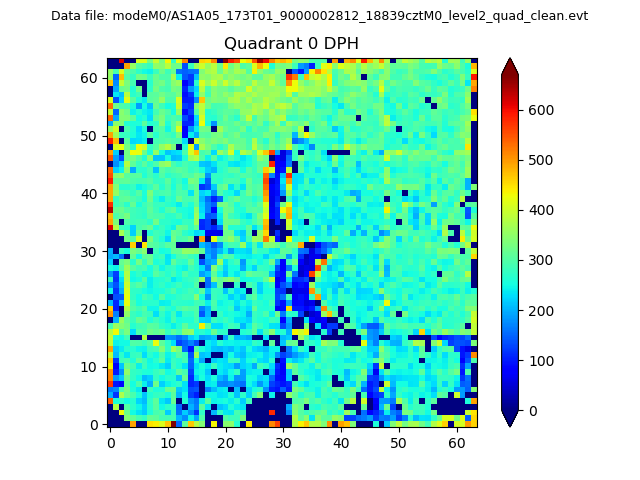 |
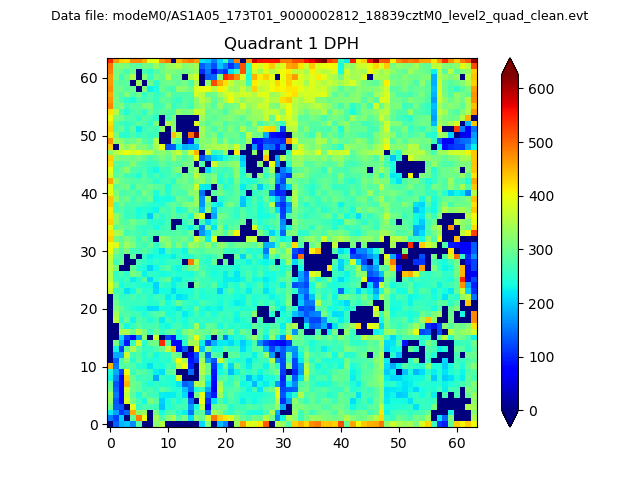 |
Quadrant B |
|---|---|---|---|
| Quadrant D | 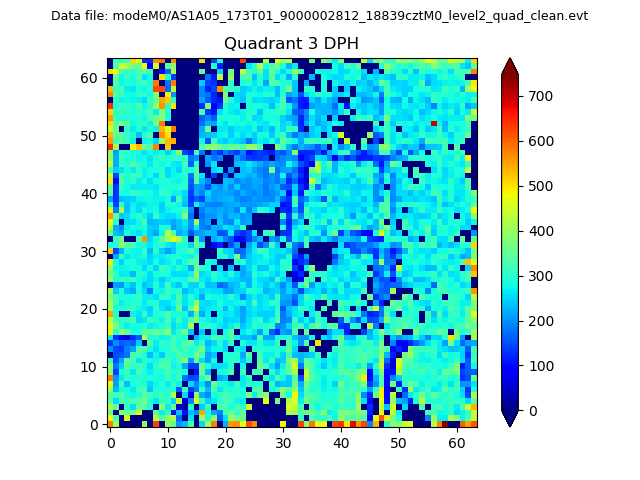 |
 |
Quadrant C |
| Plot type | Count rate plots | Images |
|---|---|---|
| Comparison with Poisson distribution Blue bars denote a histogram of data divided into 1 sec bins. Red curve is a Poisson curve with rate = median count rate of data. |
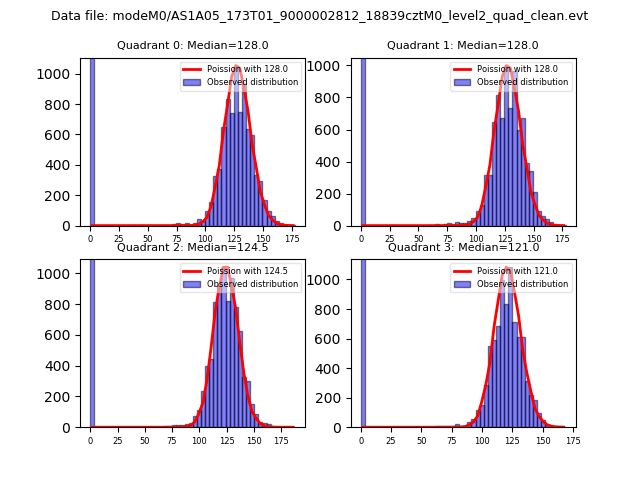 |
 |
| Quadrant-wise count rates Data is divided into 100 sec bins |
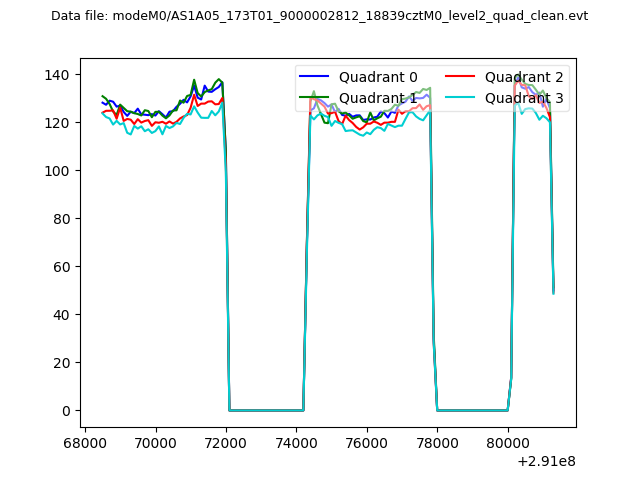 |
|
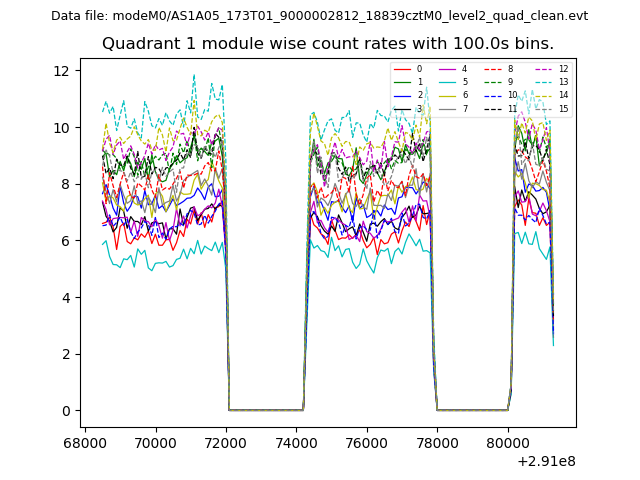
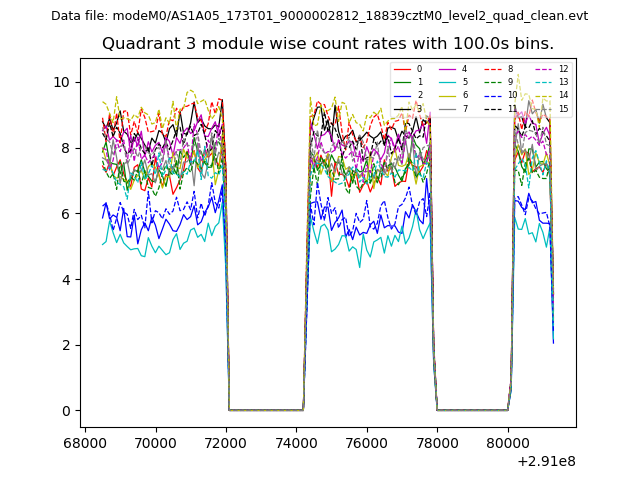
| Module-wise count rates for Quadrant A Data is divided into 100 sec bins |
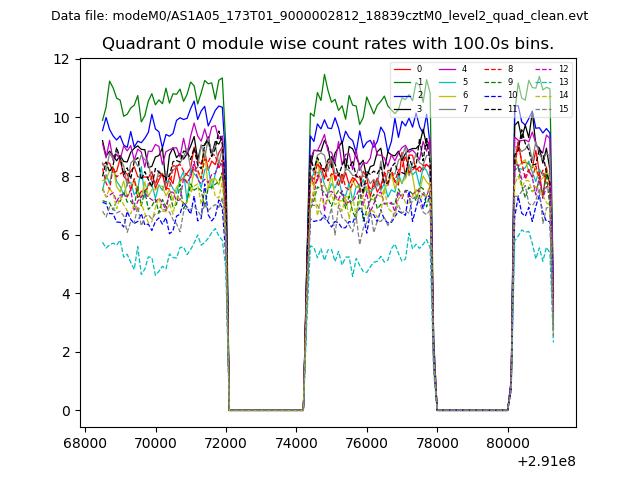 |
 |
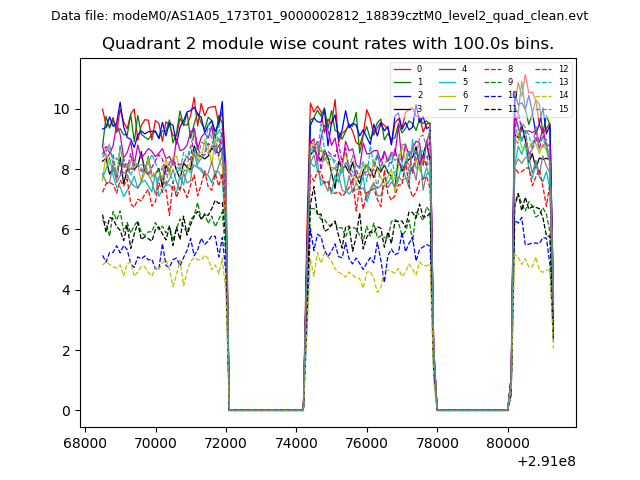
| Module-wise count rates for Quadrant B Data is divided into 100 sec bins |
 |
 |
| Module-wise count rates for Quadrant C Data is divided into 100 sec bins |
 |
 |
| Module-wise count rates for Quadrant D Data is divided into 100 sec bins |
 |
 |
| Parameter | Plot |
|---|---|
| CZT HV Monitor | 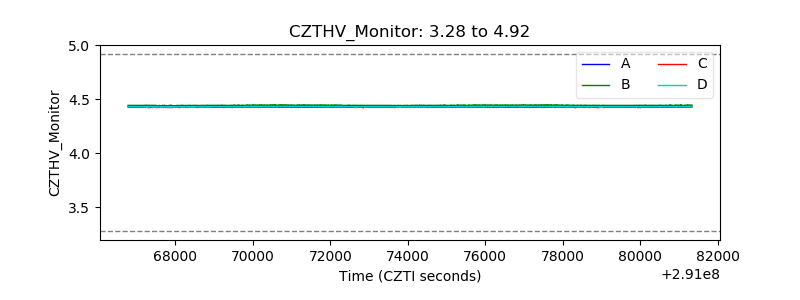 |
| D_VDD | 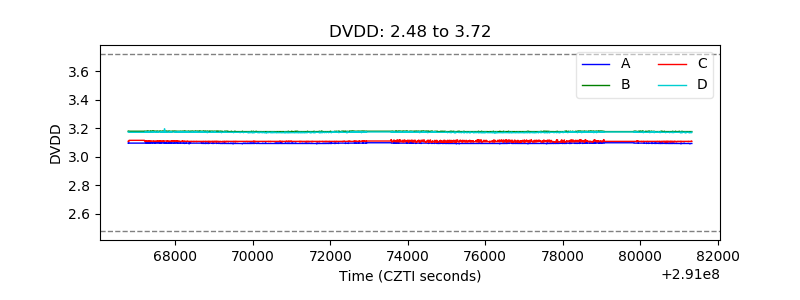 |
| Temperature 1 | 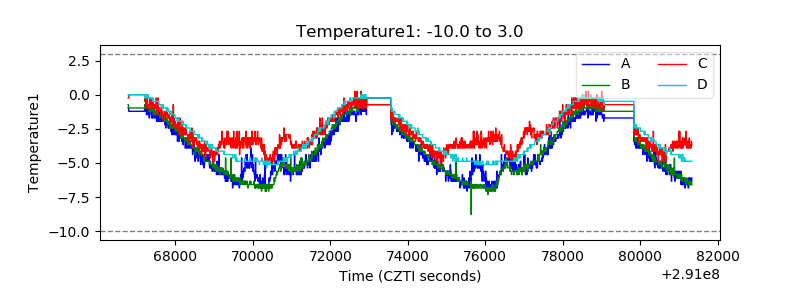 |
| Veto HV Monitor | 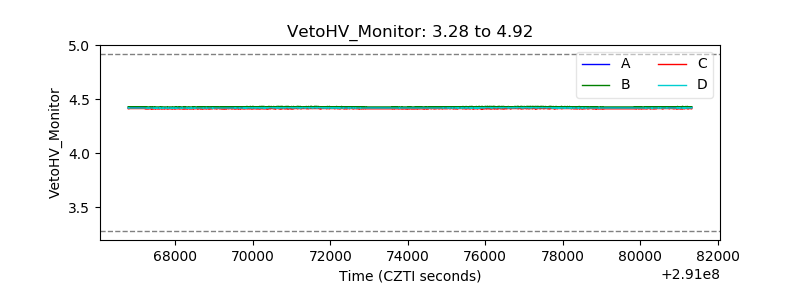 |
| Veto LLD | 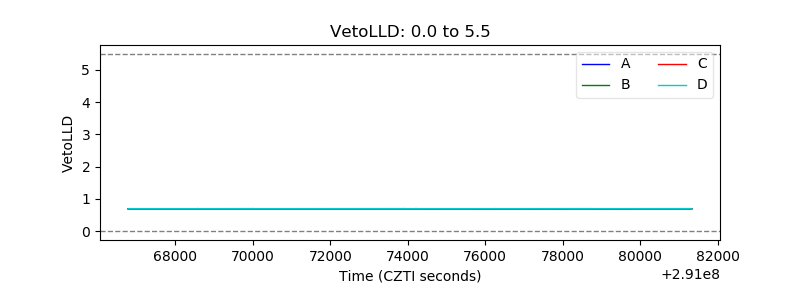 |
| Alpha Counter | 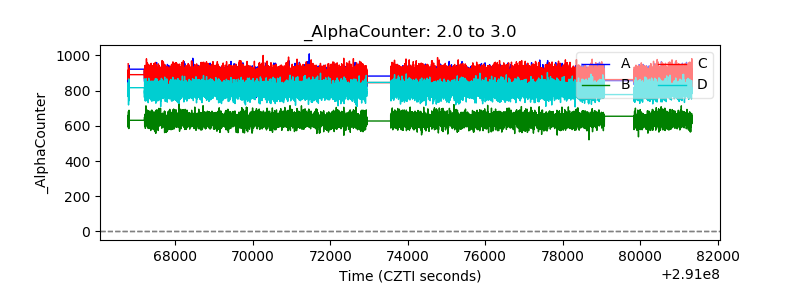 |
| _CPM_Rate | 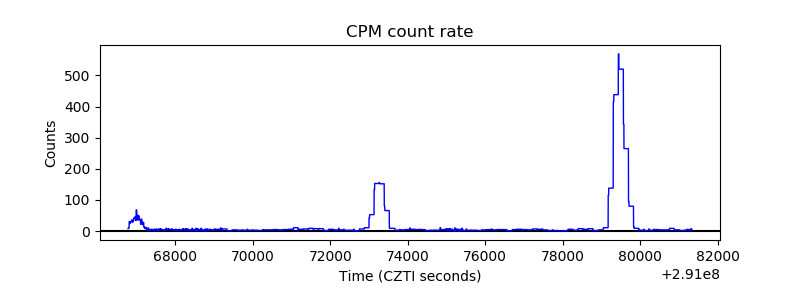 |
| CZT Counter |  |
| +2.5 Volts monitor |  |
| +5 Volts monitor |  |
| _ROLL_ROT | 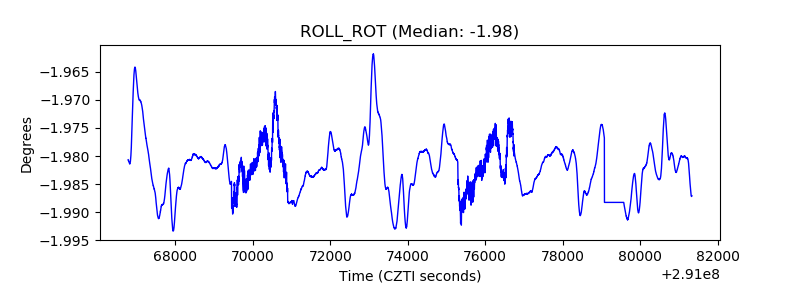 |
| _Roll_DEC | 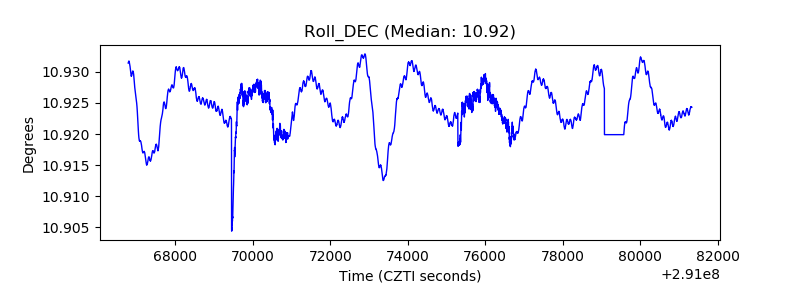 |
| _Roll_RA | 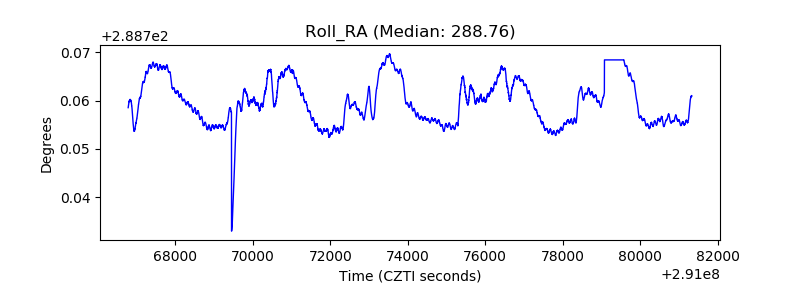 |
| Veto Counter | 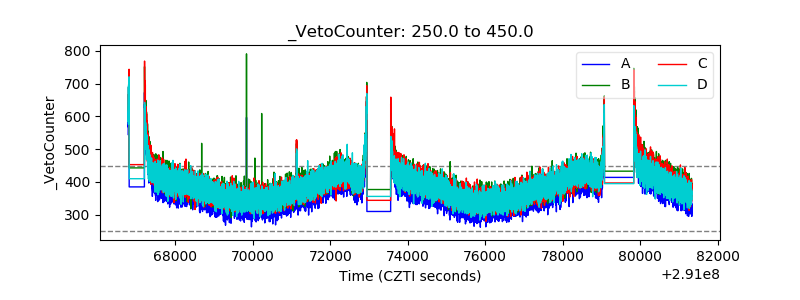 |