| Param | Original file | Final file |
|---|---|---|
| Filename | modeM0/AS1A05_194T13_9000002814cztM0_level2.fits | modeM0/AS1A05_194T13_9000002814cztM0_level2_quad_clean.evt |
| Size (bytes) | 306,360,000 | 202,216,320 |
| Size | 292.2 MB | 192.8 MB |
| Events in quadrant A | 1,956,552 | 1,105,849 |
| Events in quadrant B | 1,868,636 | 1,093,982 |
| Events in quadrant C | 1,852,662 | 1,021,052 |
| Events in quadrant D | 1,614,684 | 914,378 |
| Mode M0 | |||
|---|---|---|---|
| Quadrant | BADHDUFLAG | Total packets | Discarded packets |
| A | 0 | 61012 | 0 |
| B | 0 | 67621 | 0 |
| C | 0 | 61708 | 0 |
| D | 0 | 75364 | 0 |
| Mode SS | |||
|---|---|---|---|
| Quadrant | BADHDUFLAG | Total packets | Discarded packets |
| A | 0 | 588 | 0 |
| B | 0 | 588 | 0 |
| C | 0 | 588 | 0 |
| D | 0 | 588 | 0 |
| Mode M9 | |||
|---|---|---|---|
| Quadrant | BADHDUFLAG | Total packets | Discarded packets |
| A | 0 | 62 | 0 |
| B | 0 | 62 | 0 |
| C | 0 | 62 | 0 |
| D | 0 | 62 | 0 |
| Quadrant | Total seconds | Saturated seconds | Saturation percentage |
|---|---|---|---|
| A | 28890 | 162 | 0.560748% |
| B | 28890 | 361 | 1.249567% |
| C | 28890 | 275 | 0.951886% |
| D | 28890 | 1027 | 3.554863% |
Noise dominated data is calculated using 1-second bins in cleaned event files. If a bin has >2000 counts, and if more than 50% of those come from <1% of pixels, then it is considered to be noise-dominated and hence unusable.
| Quadrant | # 1 sec bins | Bins with >0 counts | Bins with >2000 counts | High rate bins dominated by noise | Noise dominated (total time) | Noise dominated (detector-on time) | Marked lightcurve |
|---|---|---|---|---|---|---|---|
| A | 35161 | 28890 | 0 | 0 | 0.00% | 0.00% |  |
| B | 35161 | 28889 | 0 | 0 | 0.00% | 0.00% |  |
| C | 35161 | 28890 | 0 | 0 | 0.00% | 0.00% |  |
| D | 35161 | 28887 | 0 | 0 | 0.00% | 0.00% |  |
Top three noisy pixels from each quadrant. If the there are fewer than three noisy pixels in the level2.evt file, extra rows are filled as -1
| Pixel properties | Quadrant properties | ||||||
|---|---|---|---|---|---|---|---|
| Quadrant | DetID | PixID | Counts | Sigma | Mean | Median | Sigma |
| A | 7 | 110 | 1589 | 8.96 | 510 | 481 | 123.6 |
| A | 0 | 29 | 1543 | 8.59 | 510 | 481 | 123.6 |
| A | 9 | 19 | 1401 | 7.44 | 510 | 481 | 123.6 |
| B | 2 | 9 | 1484 | 10.23 | 495 | 475 | 98.6 |
| B | 5 | 128 | 1252 | 7.88 | 495 | 475 | 98.6 |
| B | 2 | 8 | 1234 | 7.7 | 495 | 475 | 98.6 |
| C | 1 | 80 | 1401 | 7.41 | 489 | 460 | 126.9 |
| C | 1 | 81 | 1328 | 6.84 | 489 | 460 | 126.9 |
| C | 12 | 241 | 1246 | 6.19 | 489 | 460 | 126.9 |
| D | 10 | 190 | 1263 | 6.86 | 461 | 420 | 122.9 |
| D | 6 | 67 | 1167 | 6.08 | 461 | 420 | 122.9 |
| D | 10 | 189 | 1138 | 5.84 | 461 | 420 | 122.9 |
Histogram calculated using DETX and DETY for each event in the final _common_clean file
| Quadrant A |  |
 |
Quadrant B |
|---|---|---|---|
| Quadrant D |  |
 |
Quadrant C |
| Plot type | Count rate plots | Images |
|---|---|---|
| Comparison with Poisson distribution Blue bars denote a histogram of data divided into 1 sec bins. Red curve is a Poisson curve with rate = median count rate of data. |
 |
 |
| Quadrant-wise count rates Data is divided into 100 sec bins |
 |
|
| Module-wise count rates for Quadrant A Data is divided into 100 sec bins |
 |
 |
| Module-wise count rates for Quadrant B Data is divided into 100 sec bins |
 |
 |
| Module-wise count rates for Quadrant C Data is divided into 100 sec bins |
 |
 |
| Module-wise count rates for Quadrant D Data is divided into 100 sec bins |
 |
 |
| Parameter | Plot |
|---|---|
| CZT HV Monitor |  |
| D_VDD |  |
| Temperature 1 |  |
| Veto HV Monitor |  |
| Veto LLD | 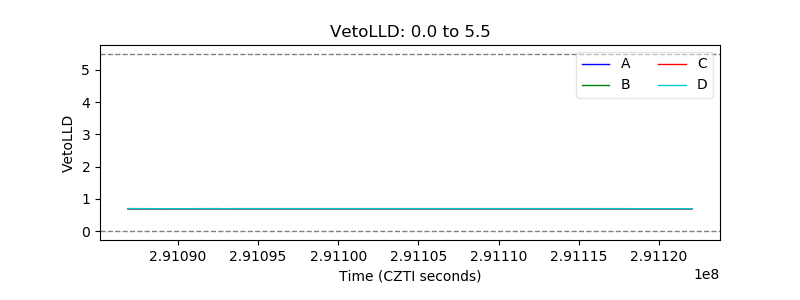 |
| Alpha Counter |  |
| _CPM_Rate |  |
| CZT Counter |  |
| +2.5 Volts monitor |  |
| +5 Volts monitor |  |
| _ROLL_ROT |  |
| _Roll_DEC |  |
| _Roll_RA |  |
| Veto Counter |  |