| Param | Original file | Final file |
|---|---|---|
| Filename | modeM0/AS1A05_194T13_9000002814_18840cztM0_level2.evt | modeM0/AS1A05_194T13_9000002814_18840cztM0_level2_quad_clean.evt |
| Size (bytes) | 51,436,800 | 7,620,480 |
| Size | 49.1 MB | 7.3 MB |
| Events in quadrant A | 309,814 | 43,775 |
| Events in quadrant B | 576,169 | 44,075 |
| Events in quadrant C | 312,431 | 43,051 |
| Events in quadrant D | 308,536 | 42,756 |
| Mode M0 | |||
|---|---|---|---|
| Quadrant | BADHDUFLAG | Total packets | Discarded packets |
| A | 0 | 1408 | 0 |
| B | 0 | 2155 | 0 |
| C | 0 | 1399 | 0 |
| D | 0 | 1442 | 0 |
| Mode SS | |||
|---|---|---|---|
| Quadrant | BADHDUFLAG | Total packets | Discarded packets |
| A | 0 | 14 | 0 |
| B | 0 | 14 | 0 |
| C | 0 | 14 | 0 |
| D | 0 | 14 | 0 |
| Quadrant | Total seconds | Saturated seconds | Saturation percentage |
|---|---|---|---|
| A | 699 | 0 | 0.000000% |
| B | 699 | 18 | 2.575107% |
| C | 699 | 2 | 0.286123% |
| D | 699 | 1 | 0.143062% |
Noise dominated data is calculated using 1-second bins in cleaned event files. If a bin has >2000 counts, and if more than 50% of those come from <1% of pixels, then it is considered to be noise-dominated and hence unusable.
| Quadrant | # 1 sec bins | Bins with >0 counts | Bins with >2000 counts | High rate bins dominated by noise | Noise dominated (total time) | Noise dominated (detector-on time) | Marked lightcurve |
|---|---|---|---|---|---|---|---|
| A | 699 | 699 | 1 | 1 | 0.14% | 0.14% | 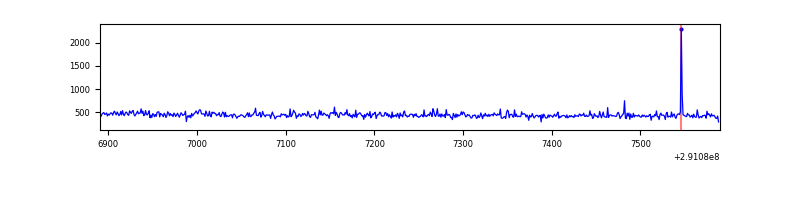 |
| B | 699 | 699 | 11 | 11 | 1.57% | 1.57% | 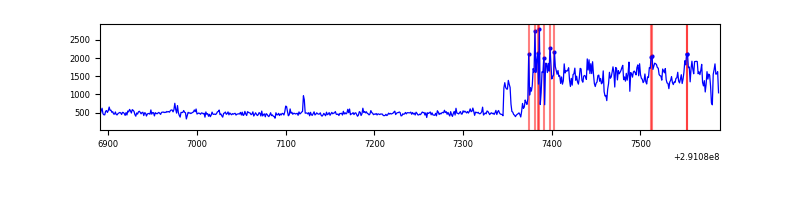 |
| C | 699 | 699 | 0 | 0 | 0.00% | 0.00% | 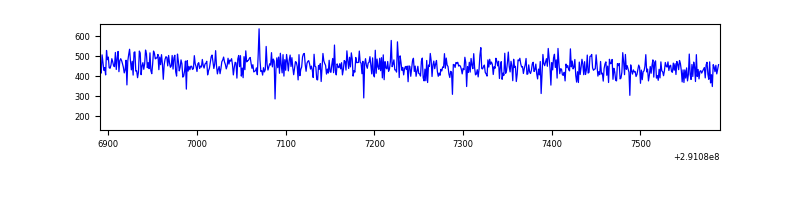 |
| D | 699 | 699 | 1 | 1 | 0.14% | 0.14% |  |
Top three noisy pixels from each quadrant. If the there are fewer than three noisy pixels in the level2.evt file, extra rows are filled as -1
| Pixel properties | Quadrant properties | ||||||
|---|---|---|---|---|---|---|---|
| Quadrant | DetID | PixID | Counts | Sigma | Mean | Median | Sigma |
| A | 15 | 174 | 2781 | 149.14 | 79 | 77 | 18.1 |
| A | 11 | 29 | 1543 | 80.86 | 79 | 77 | 18.1 |
| A | 13 | 254 | 1107 | 56.81 | 79 | 77 | 18.1 |
| B | 10 | 245 | 260083 | 14955.64 | 79 | 77 | 17.4 |
| B | 0 | 229 | 3168 | 177.8 | 79 | 77 | 17.4 |
| B | 12 | 111 | 1948 | 107.62 | 79 | 77 | 17.4 |
| C | 14 | 238 | 11207 | 559.29 | 76 | 77 | 19.9 |
| C | 3 | 233 | 1645 | 78.79 | 76 | 77 | 19.9 |
| C | 13 | 61 | 553 | 23.92 | 76 | 77 | 19.9 |
| D | 1 | 52 | 14255 | 677.06 | 76 | 74 | 20.9 |
| D | 2 | 120 | 3733 | 174.7 | 76 | 74 | 20.9 |
| D | 2 | 234 | 2739 | 127.24 | 76 | 74 | 20.9 |
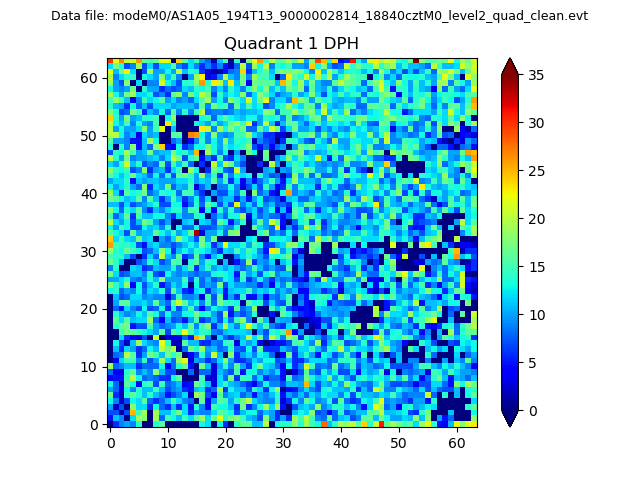
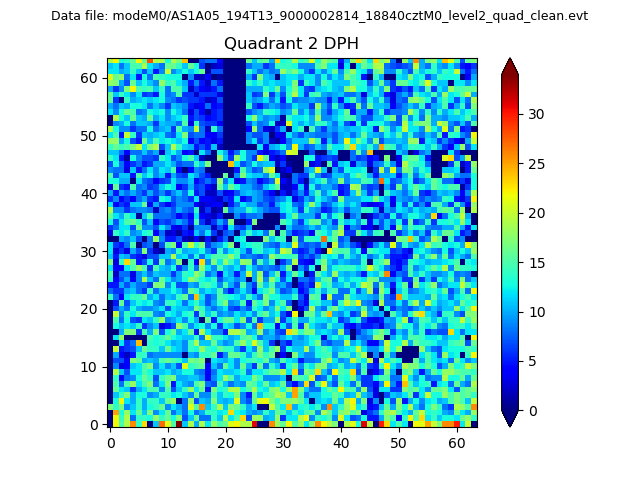
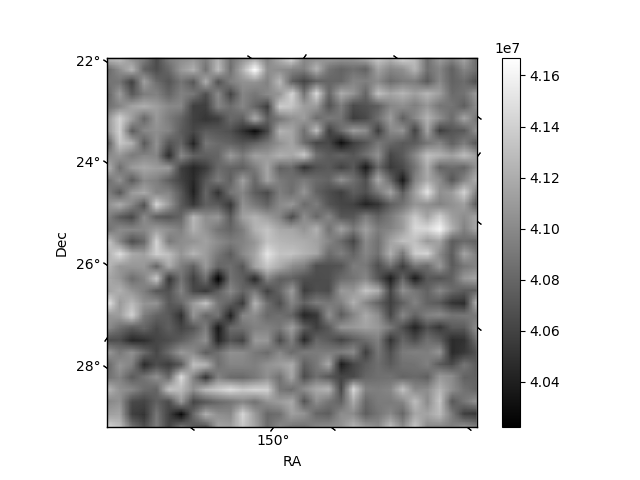
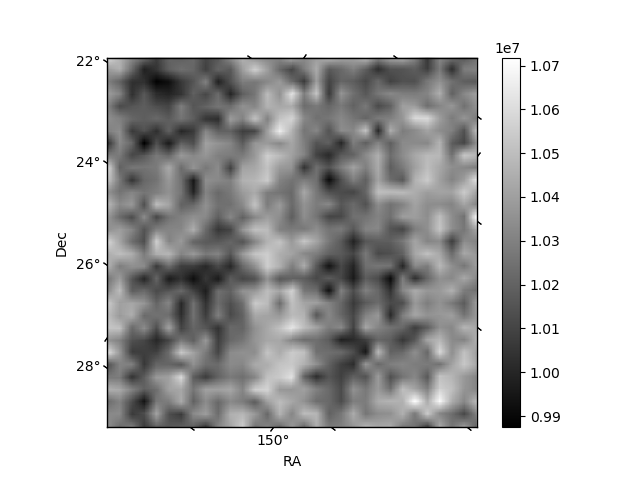
Histogram calculated using DETX and DETY for each event in the final _common_clean file
| Quadrant A | 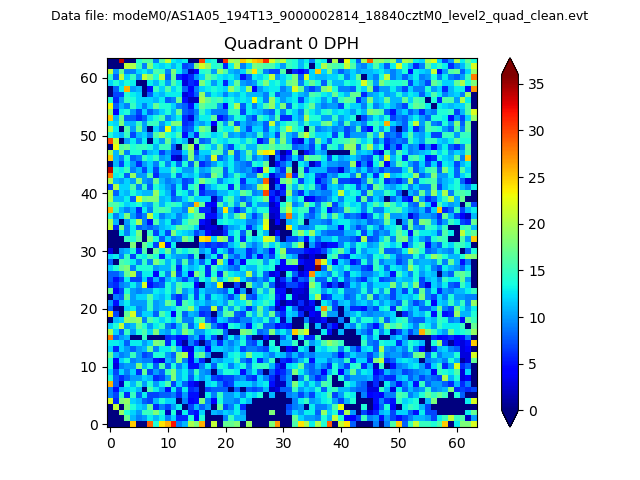 |
 |
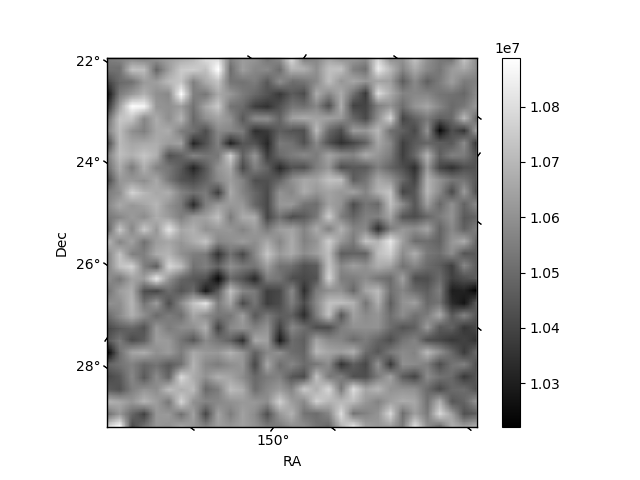
Quadrant B |
|---|---|---|---|
| Quadrant D | 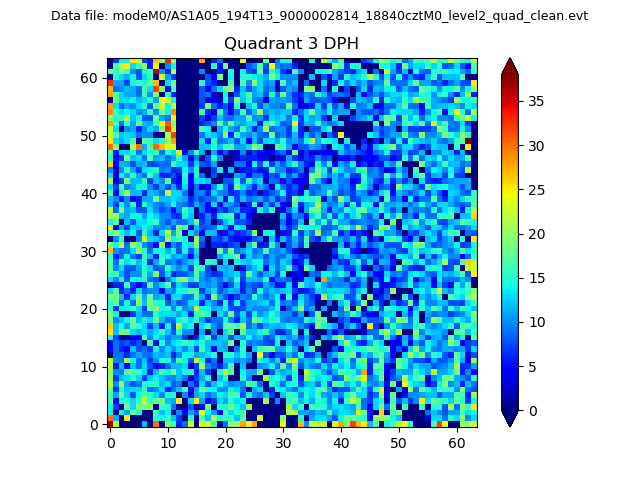 |
 |
Quadrant C |
| Plot type | Count rate plots | Images |
|---|---|---|
| Comparison with Poisson distribution Blue bars denote a histogram of data divided into 1 sec bins. Red curve is a Poisson curve with rate = median count rate of data. |
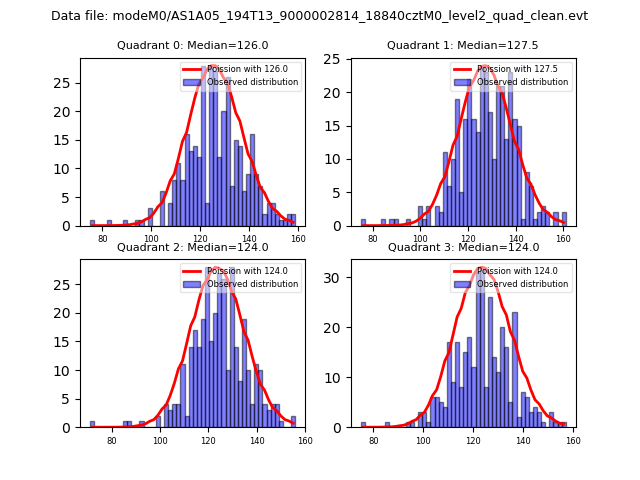 |
 |
| Quadrant-wise count rates Data is divided into 100 sec bins |
 |
|
| Module-wise count rates for Quadrant A Data is divided into 100 sec bins |
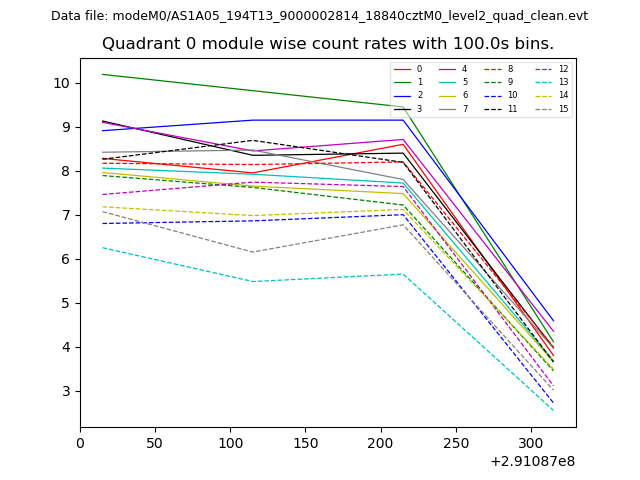 |
 |
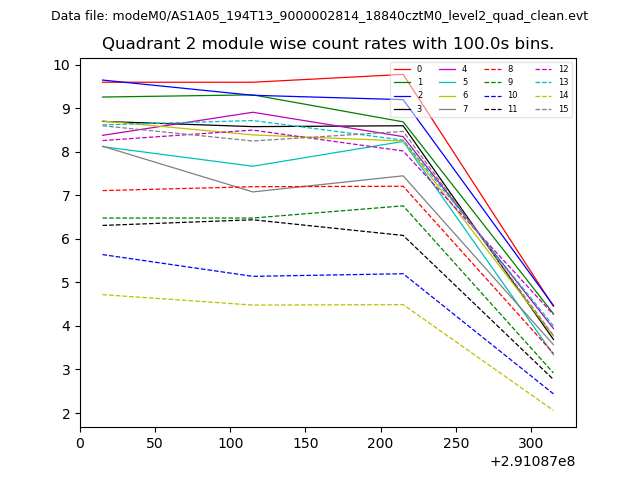
| Module-wise count rates for Quadrant B Data is divided into 100 sec bins |
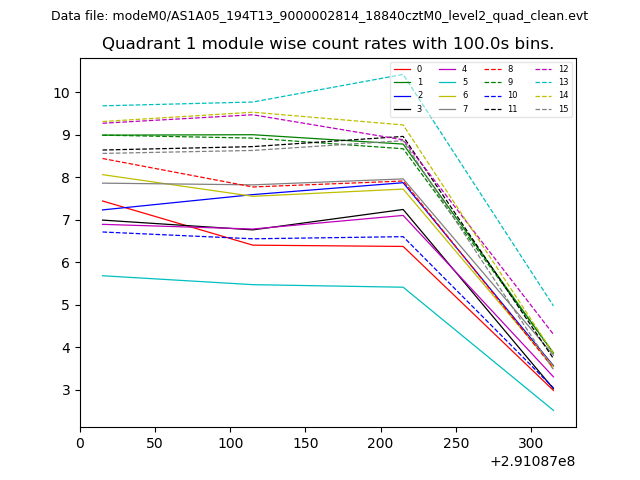 |
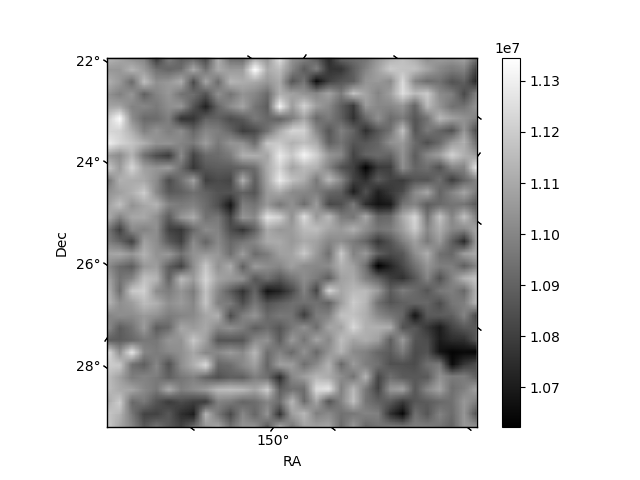 |
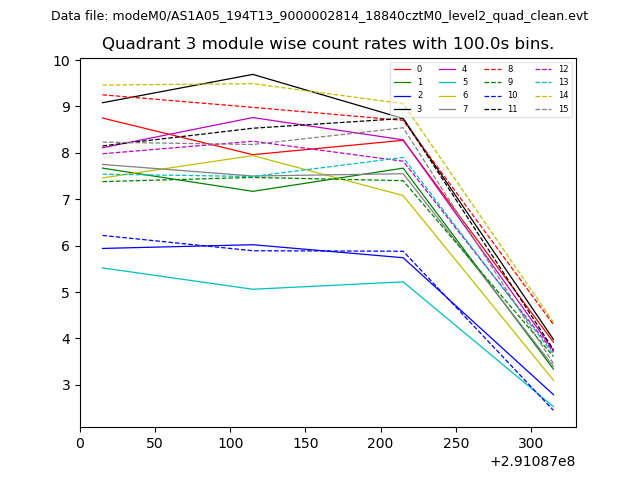
| Module-wise count rates for Quadrant C Data is divided into 100 sec bins |
 |
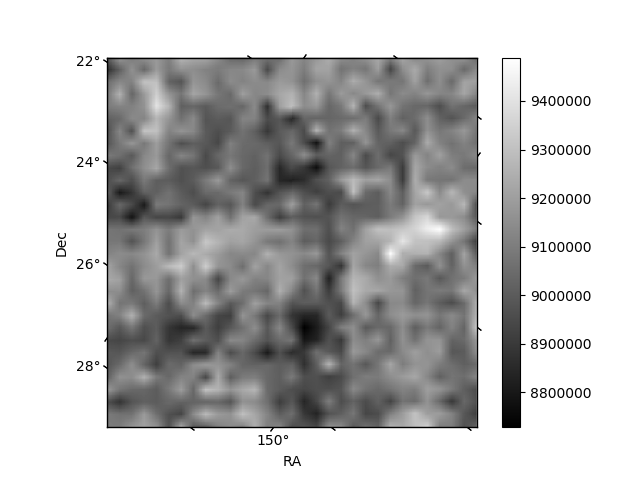 |
| Module-wise count rates for Quadrant D Data is divided into 100 sec bins |
 |
 |
| Parameter | Plot |
|---|---|
| CZT HV Monitor | 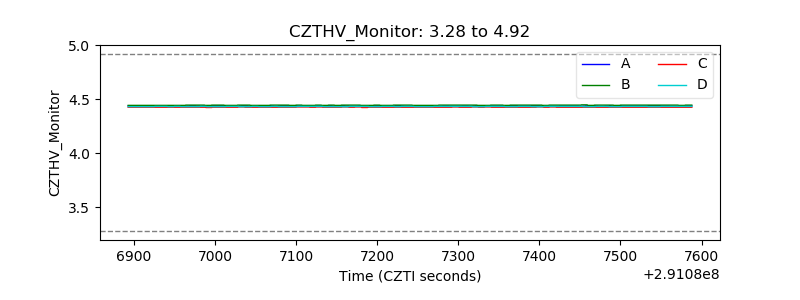 |
| D_VDD |  |
| Temperature 1 | 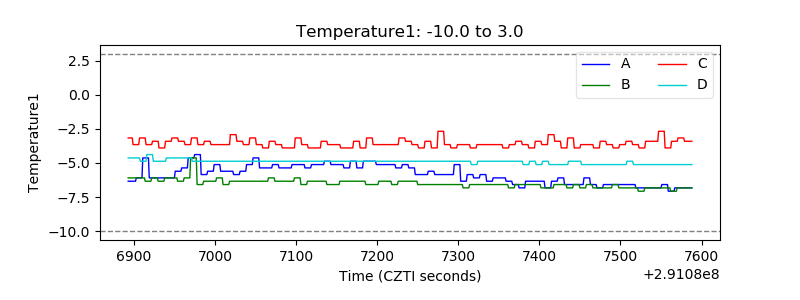 |
| Veto HV Monitor | 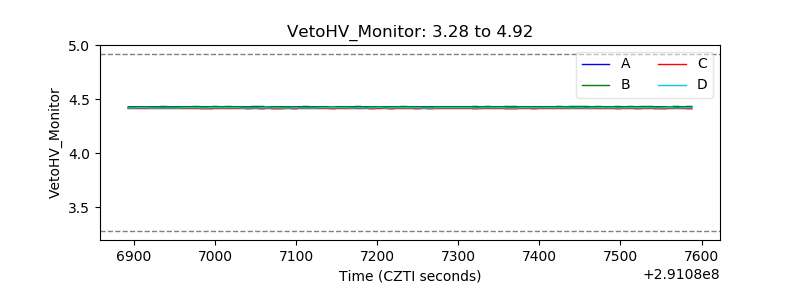 |
| Veto LLD | 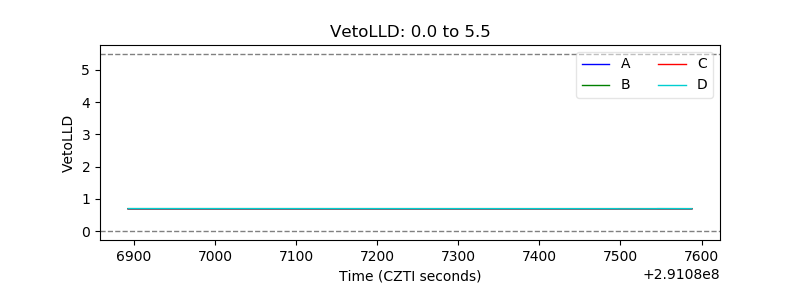 |
| Alpha Counter |  |
| _CPM_Rate |  |
| CZT Counter | 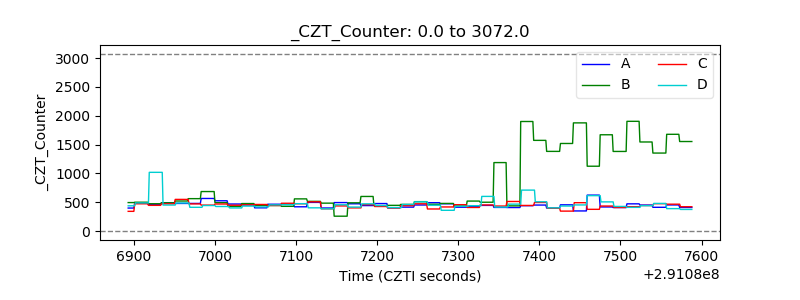 |
| +2.5 Volts monitor |  |
| +5 Volts monitor |  |
| _ROLL_ROT |  |
| _Roll_DEC | 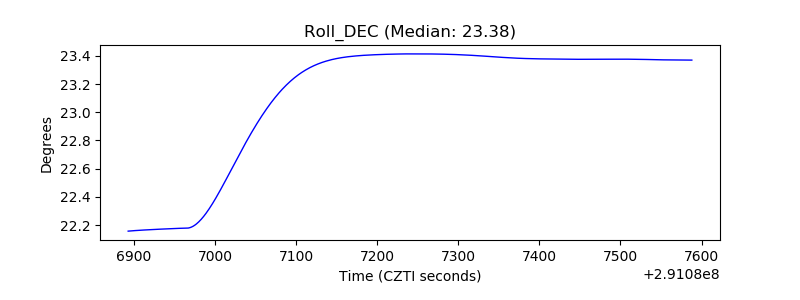 |
| _Roll_RA | 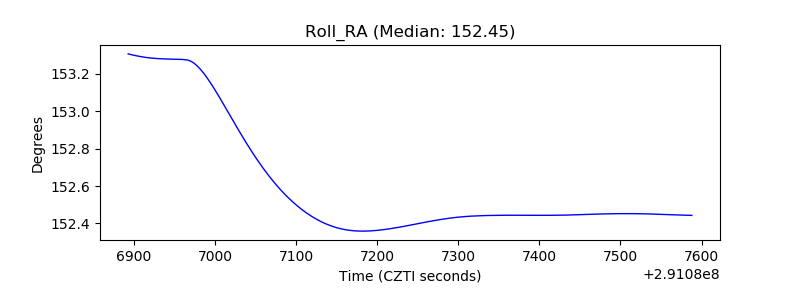 |
| Veto Counter | 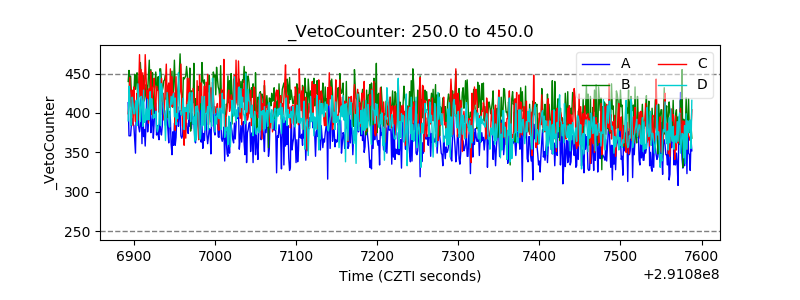 |