| Param | Original file | Final file |
|---|---|---|
| Filename | modeM0/AS1A05_194T13_9000002814_18841cztM0_level2.evt | modeM0/AS1A05_194T13_9000002814_18841cztM0_level2_quad_clean.evt |
| Size (bytes) | 408,003,840 | 64,782,720 |
| Size | 389.1 MB | 61.8 MB |
| Events in quadrant A | 2,737,880 | 398,878 |
| Events in quadrant B | 3,572,150 | 401,396 |
| Events in quadrant C | 2,805,906 | 383,635 |
| Events in quadrant D | 2,848,775 | 374,887 |
| Mode M0 | |||
|---|---|---|---|
| Quadrant | BADHDUFLAG | Total packets | Discarded packets |
| A | 0 | 11807 | 1 |
| B | 0 | 14359 | 1 |
| C | 0 | 11961 | 1 |
| D | 0 | 12529 | 1 |
| Mode SS | |||
|---|---|---|---|
| Quadrant | BADHDUFLAG | Total packets | Discarded packets |
| A | 0 | 116 | 0 |
| B | 0 | 116 | 0 |
| C | 0 | 116 | 0 |
| D | 0 | 116 | 0 |
| Mode M9 | |||
|---|---|---|---|
| Quadrant | BADHDUFLAG | Total packets | Discarded packets |
| A | 0 | 11 | 0 |
| B | 0 | 11 | 0 |
| C | 0 | 11 | 0 |
| D | 0 | 11 | 0 |
| Quadrant | Total seconds | Saturated seconds | Saturation percentage |
|---|---|---|---|
| A | 5764 | 12 | 0.208189% |
| B | 5764 | 81 | 1.405274% |
| C | 5764 | 40 | 0.693963% |
| D | 5764 | 40 | 0.693963% |
Noise dominated data is calculated using 1-second bins in cleaned event files. If a bin has >2000 counts, and if more than 50% of those come from <1% of pixels, then it is considered to be noise-dominated and hence unusable.
| Quadrant | # 1 sec bins | Bins with >0 counts | Bins with >2000 counts | High rate bins dominated by noise | Noise dominated (total time) | Noise dominated (detector-on time) | Marked lightcurve |
|---|---|---|---|---|---|---|---|
| A | 6839 | 5765 | 4 | 4 | 0.06% | 0.07% | 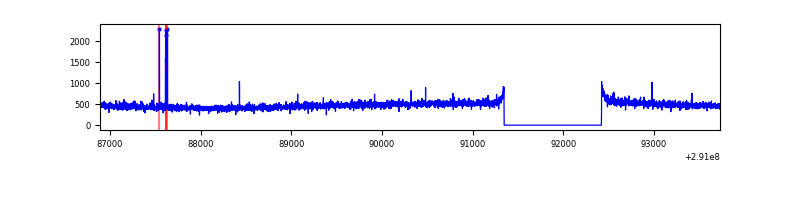 |
| B | 6839 | 5765 | 30 | 30 | 0.44% | 0.52% | 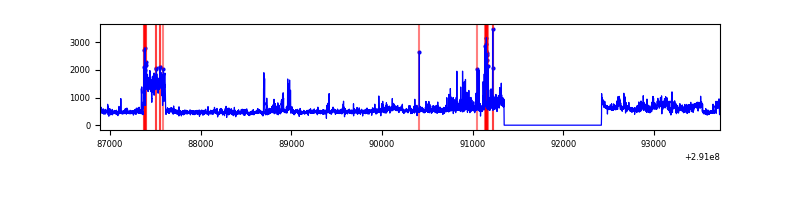 |
| C | 6839 | 5765 | 2 | 2 | 0.03% | 0.03% | 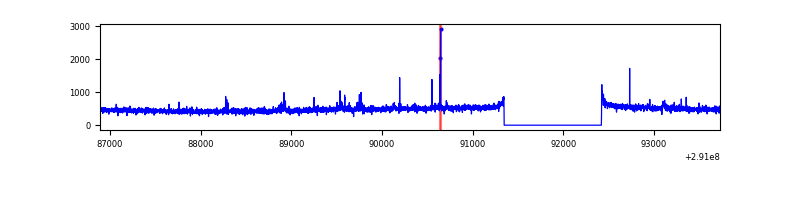 |
| D | 6839 | 5765 | 15 | 15 | 0.22% | 0.26% | 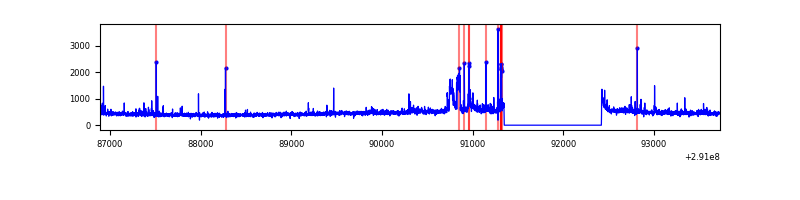 |
Top three noisy pixels from each quadrant. If the there are fewer than three noisy pixels in the level2.evt file, extra rows are filled as -1
| Pixel properties | Quadrant properties | ||||||
|---|---|---|---|---|---|---|---|
| Quadrant | DetID | PixID | Counts | Sigma | Mean | Median | Sigma |
| A | 15 | 174 | 16691 | 113.14 | 703 | 687 | 141.5 |
| A | 11 | 29 | 10398 | 68.65 | 703 | 687 | 141.5 |
| A | 13 | 254 | 8731 | 56.87 | 703 | 687 | 141.5 |
| B | 10 | 245 | 612779 | 4589.24 | 700 | 684 | 133.4 |
| B | 7 | 220 | 100092 | 745.32 | 700 | 684 | 133.4 |
| B | 6 | 36 | 44486 | 328.41 | 700 | 684 | 133.4 |
| C | 14 | 238 | 103708 | 653.92 | 671 | 678 | 157.6 |
| C | 3 | 233 | 36373 | 226.55 | 671 | 678 | 157.6 |
| C | 5 | 112 | 28490 | 176.52 | 671 | 678 | 157.6 |
| D | 1 | 20 | 192948 | 1152.76 | 676 | 658 | 166.8 |
| D | 14 | 34 | 37650 | 221.76 | 676 | 658 | 166.8 |
| D | 1 | 52 | 29861 | 175.07 | 676 | 658 | 166.8 |
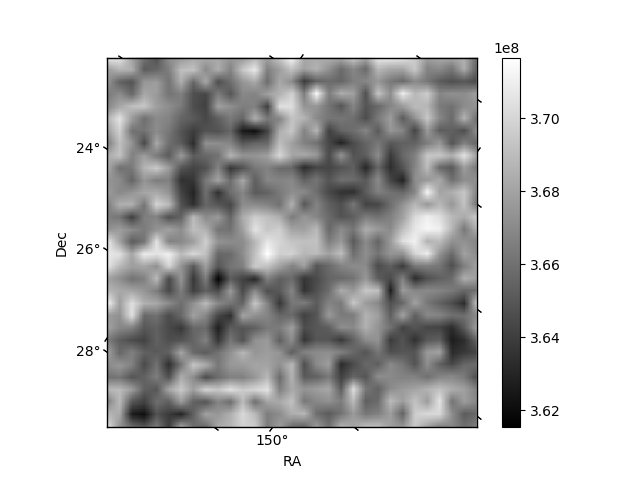
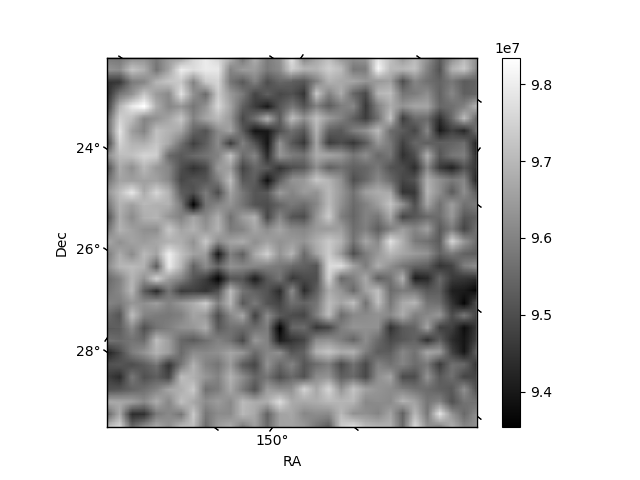
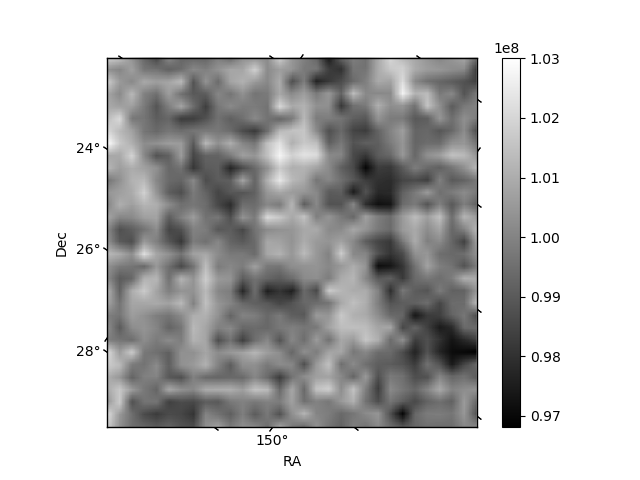
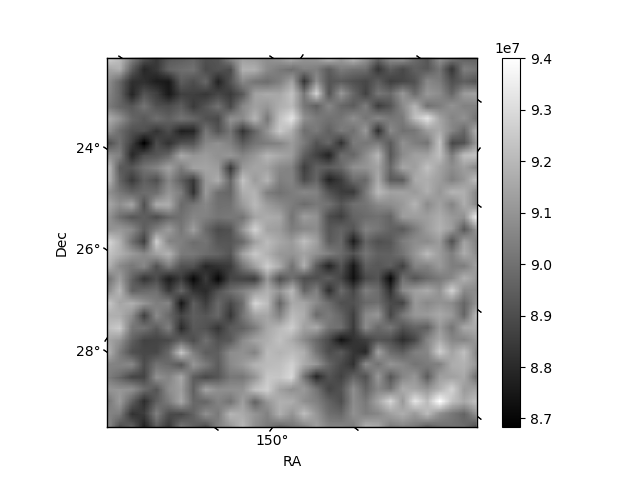
Histogram calculated using DETX and DETY for each event in the final _common_clean file
| Quadrant A | 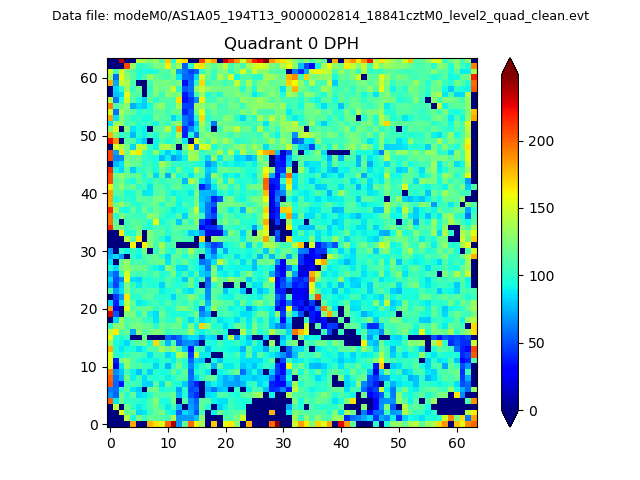 |
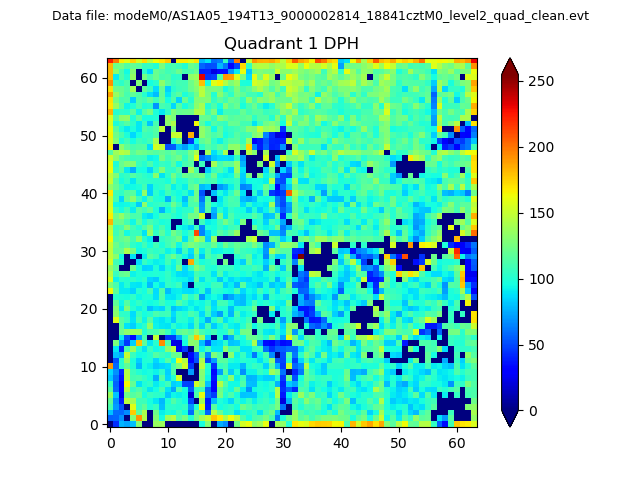 |
Quadrant B |
|---|---|---|---|
| Quadrant D | 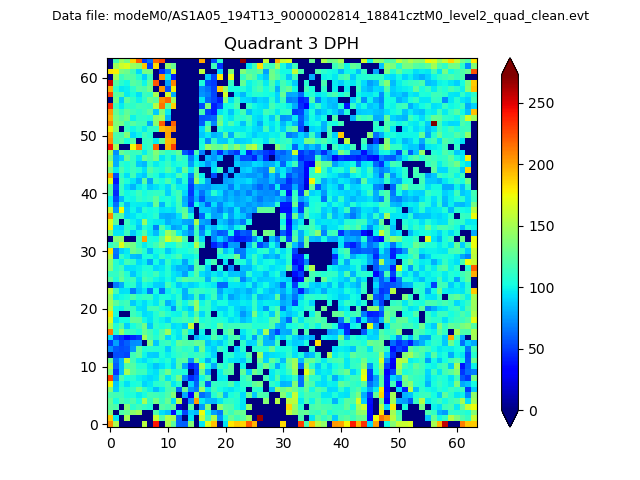 |
 |
Quadrant C |
| Plot type | Count rate plots | Images |
|---|---|---|
| Comparison with Poisson distribution Blue bars denote a histogram of data divided into 1 sec bins. Red curve is a Poisson curve with rate = median count rate of data. |
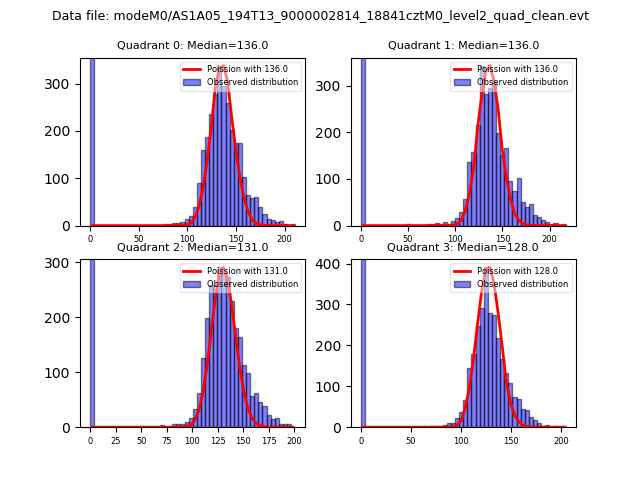 |
 |
| Quadrant-wise count rates Data is divided into 100 sec bins |
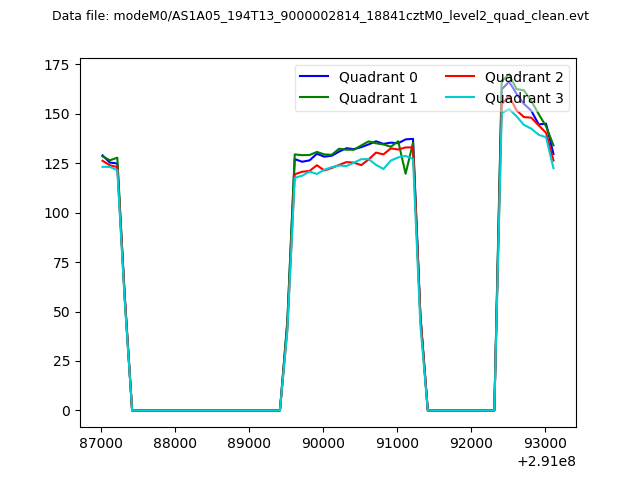 |
|
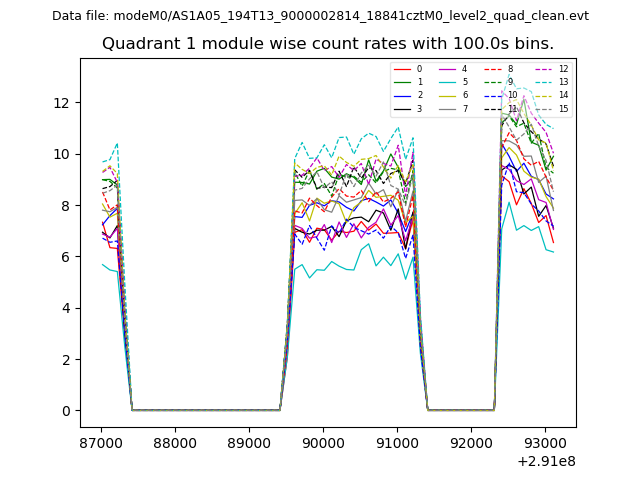
| Module-wise count rates for Quadrant A Data is divided into 100 sec bins |
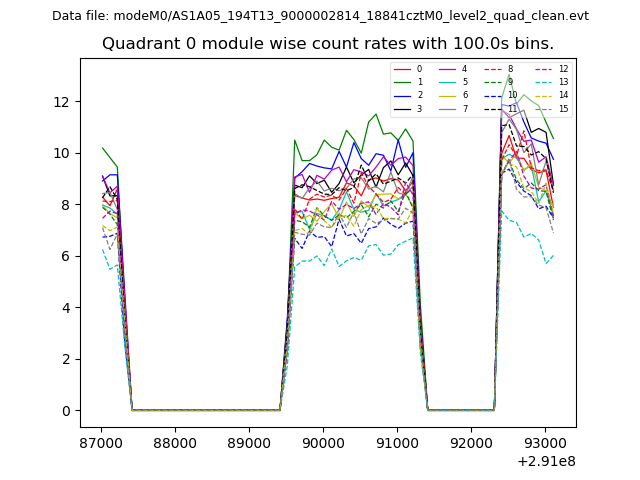 |
 |
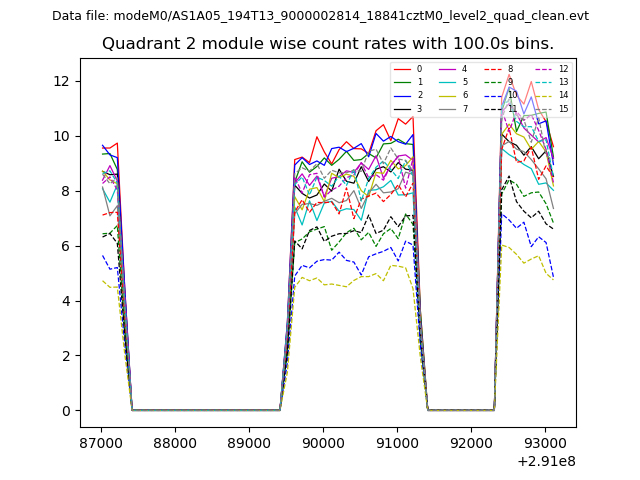
| Module-wise count rates for Quadrant B Data is divided into 100 sec bins |
 |
 |
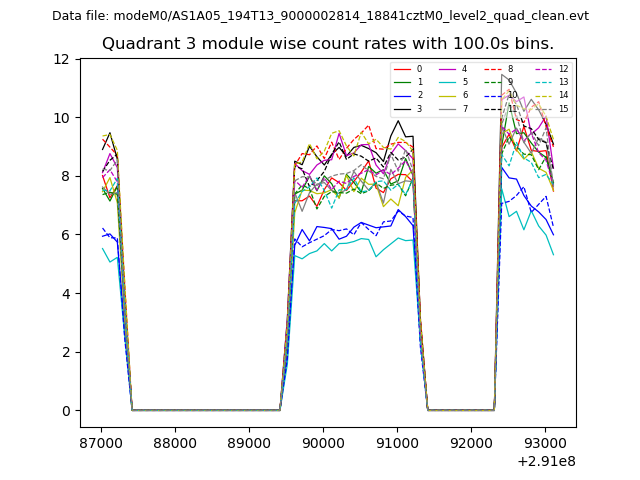
| Module-wise count rates for Quadrant C Data is divided into 100 sec bins |
 |
 |
| Module-wise count rates for Quadrant D Data is divided into 100 sec bins |
 |
 |
| Parameter | Plot |
|---|---|
| CZT HV Monitor | 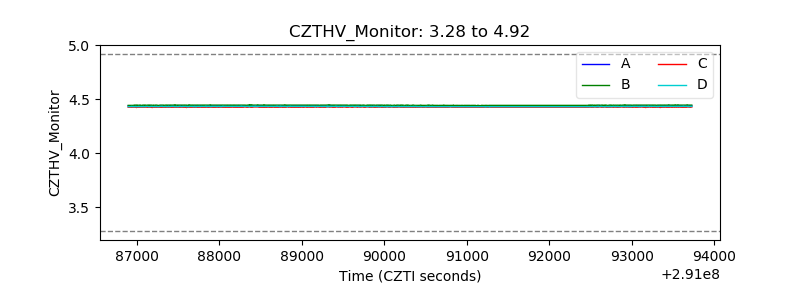 |
| D_VDD | 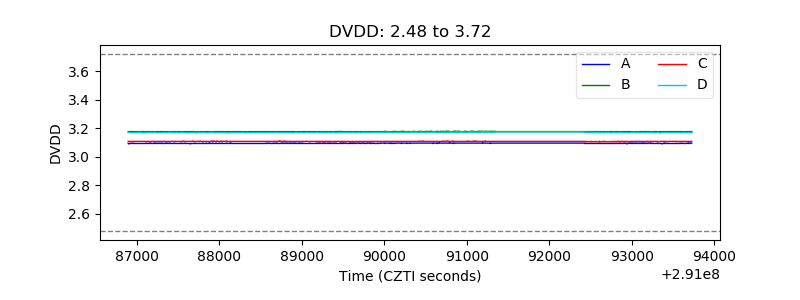 |
| Temperature 1 | 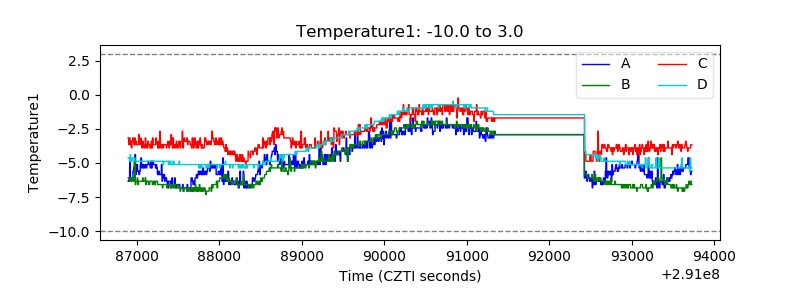 |
| Veto HV Monitor | 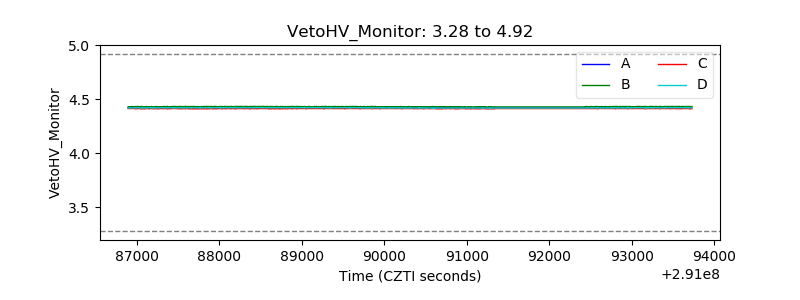 |
| Veto LLD | 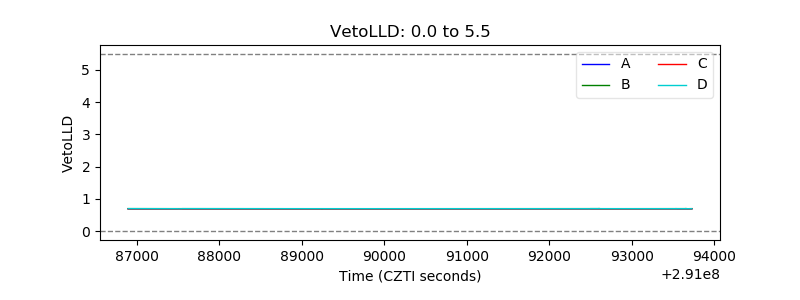 |
| Alpha Counter | 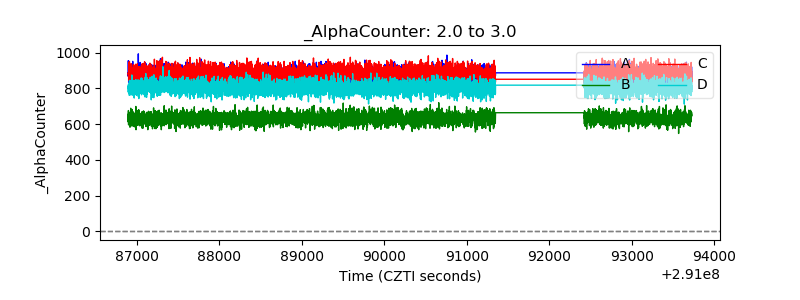 |
| _CPM_Rate | 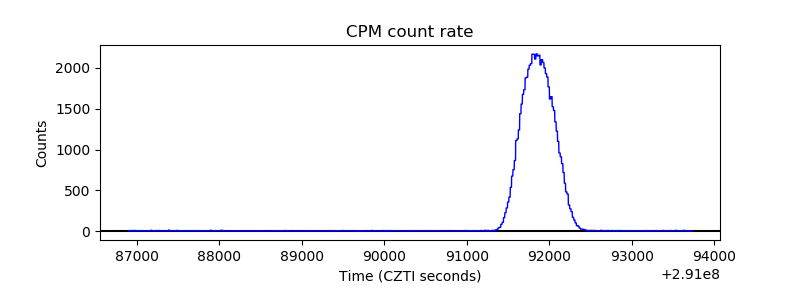 |
| CZT Counter | 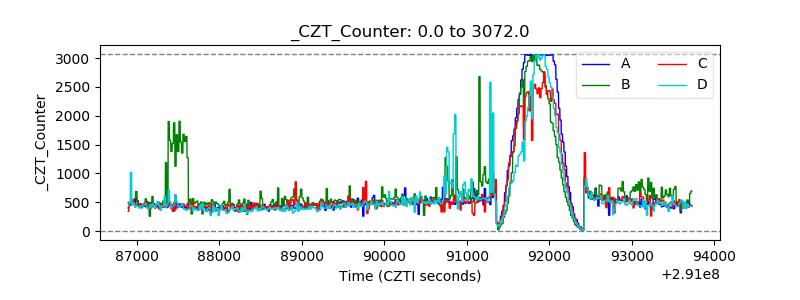 |
| +2.5 Volts monitor |  |
| +5 Volts monitor |  |
| _ROLL_ROT | 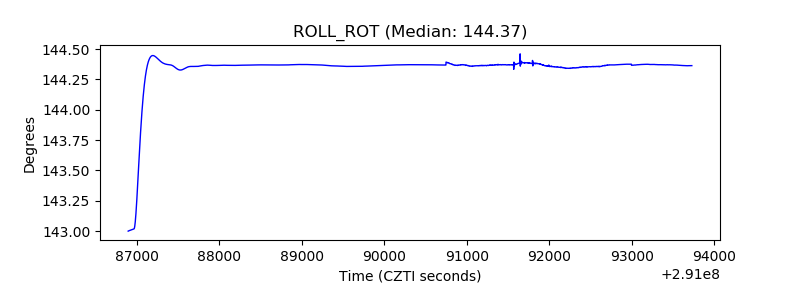 |
| _Roll_DEC | 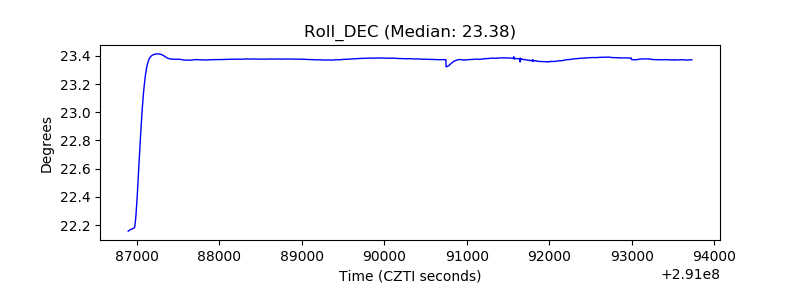 |
| _Roll_RA | 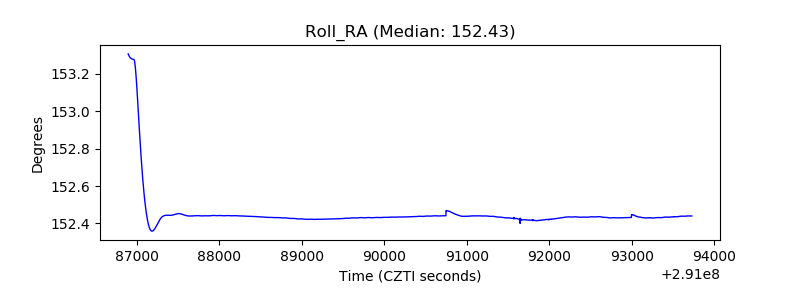 |
| Veto Counter | 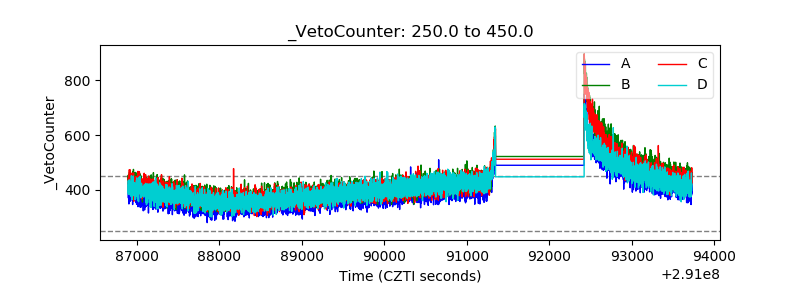 |