| Param | Original file | Final file |
|---|---|---|
| Filename | modeM0/AS1A05_194T13_9000002814_18844cztM0_level2.evt | modeM0/AS1A05_194T13_9000002814_18844cztM0_level2_quad_clean.evt |
| Size (bytes) | 529,905,600 | 66,467,520 |
| Size | 505.4 MB | 63.4 MB |
| Events in quadrant A | 3,448,713 | 404,720 |
| Events in quadrant B | 3,647,727 | 409,276 |
| Events in quadrant C | 3,510,485 | 381,045 |
| Events in quadrant D | 5,000,819 | 363,961 |
| Mode M0 | |||
|---|---|---|---|
| Quadrant | BADHDUFLAG | Total packets | Discarded packets |
| A | 0 | 14045 | 2 |
| B | 0 | 14753 | 2 |
| C | 0 | 14282 | 3 |
| D | 0 | 18955 | 2 |
| Mode SS | |||
|---|---|---|---|
| Quadrant | BADHDUFLAG | Total packets | Discarded packets |
| A | 0 | 134 | 0 |
| B | 0 | 134 | 0 |
| C | 0 | 134 | 0 |
| D | 0 | 134 | 0 |
| Mode M9 | |||
|---|---|---|---|
| Quadrant | BADHDUFLAG | Total packets | Discarded packets |
| A | 0 | 19 | 0 |
| B | 0 | 20 | 0 |
| C | 0 | 20 | 0 |
| D | 0 | 20 | 0 |
| Quadrant | Total seconds | Saturated seconds | Saturation percentage |
|---|---|---|---|
| A | 6492 | 19 | 0.292668% |
| B | 6492 | 55 | 0.847197% |
| C | 6491 | 55 | 0.847327% |
| D | 6491 | 351 | 5.407487% |
Noise dominated data is calculated using 1-second bins in cleaned event files. If a bin has >2000 counts, and if more than 50% of those come from <1% of pixels, then it is considered to be noise-dominated and hence unusable.
| Quadrant | # 1 sec bins | Bins with >0 counts | Bins with >2000 counts | High rate bins dominated by noise | Noise dominated (total time) | Noise dominated (detector-on time) | Marked lightcurve |
|---|---|---|---|---|---|---|---|
| A | 7802 | 6493 | 3 | 3 | 0.04% | 0.05% | 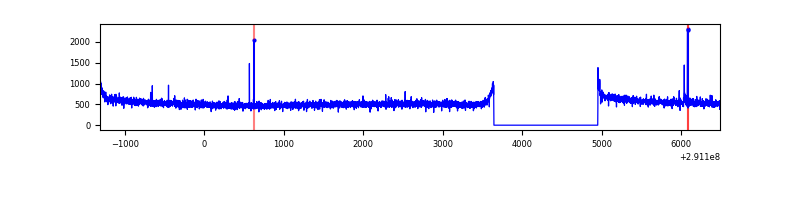 |
| B | 7802 | 6493 | 8 | 8 | 0.10% | 0.12% | 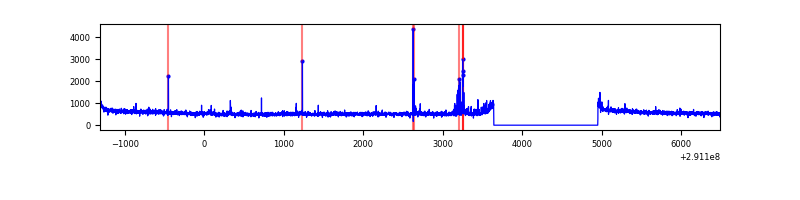 |
| C | 7801 | 6492 | 15 | 15 | 0.19% | 0.23% | 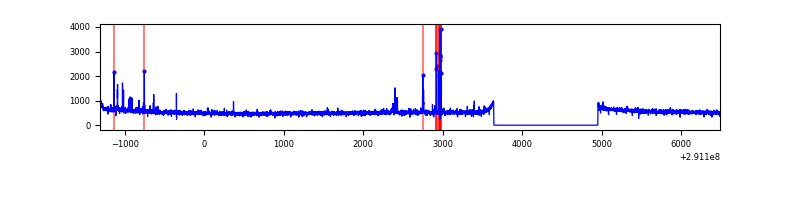 |
| D | 7801 | 6492 | 294 | 294 | 3.77% | 4.53% | 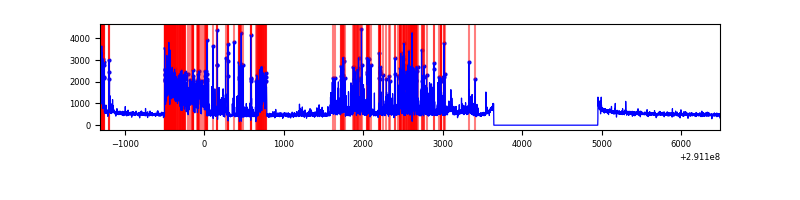 |
Top three noisy pixels from each quadrant. If the there are fewer than three noisy pixels in the level2.evt file, extra rows are filled as -1
| Pixel properties | Quadrant properties | ||||||
|---|---|---|---|---|---|---|---|
| Quadrant | DetID | PixID | Counts | Sigma | Mean | Median | Sigma |
| A | 9 | 143 | 16671 | 90.41 | 885 | 869 | 174.8 |
| A | 13 | 254 | 10139 | 53.04 | 885 | 869 | 174.8 |
| A | 0 | 23 | 8979 | 46.4 | 885 | 869 | 174.8 |
| B | 10 | 245 | 67436 | 403.78 | 886 | 867 | 164.9 |
| B | 0 | 197 | 56376 | 336.69 | 886 | 867 | 164.9 |
| B | 0 | 230 | 20752 | 120.61 | 886 | 867 | 164.9 |
| C | 14 | 238 | 133460 | 688.71 | 833 | 845 | 192.6 |
| C | 0 | 207 | 68211 | 349.85 | 833 | 845 | 192.6 |
| C | 5 | 112 | 32454 | 164.16 | 833 | 845 | 192.6 |
| D | 1 | 52 | 1134192 | 5723.14 | 824 | 801 | 198.0 |
| D | 12 | 1 | 552856 | 2787.64 | 824 | 801 | 198.0 |
| D | 1 | 20 | 134021 | 672.7 | 824 | 801 | 198.0 |
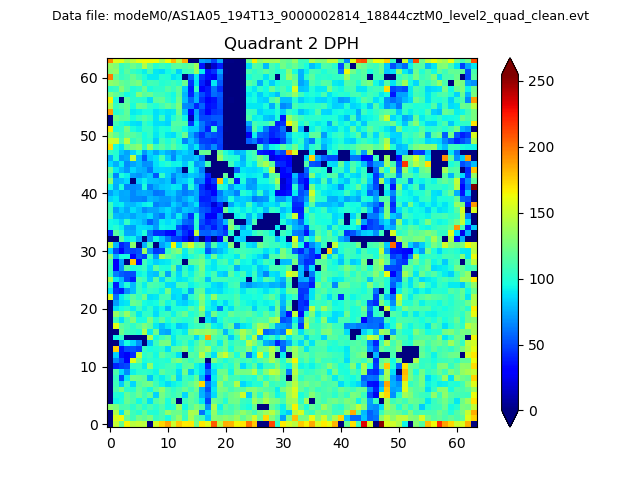
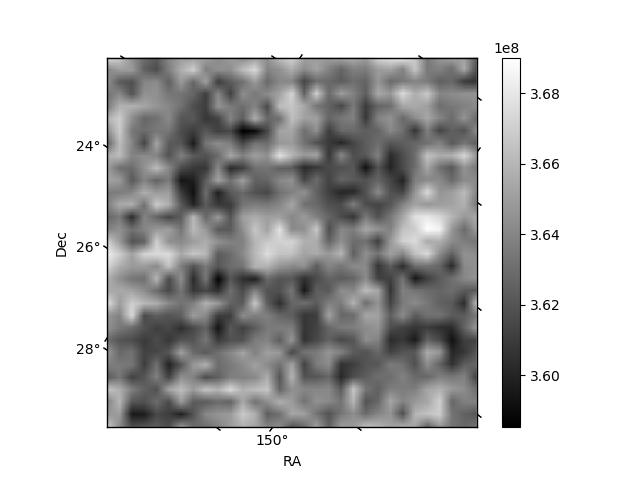
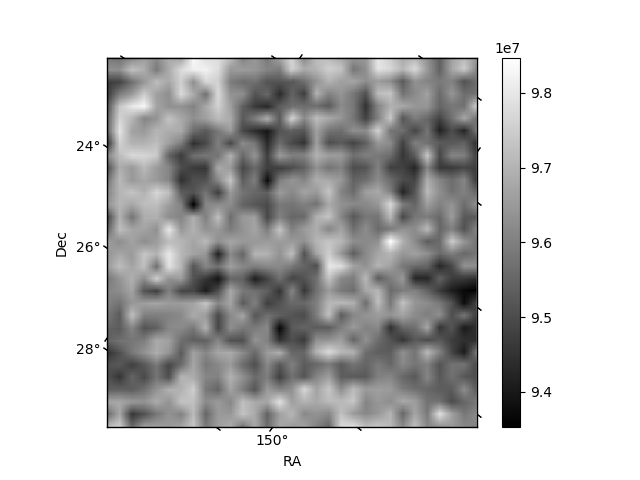
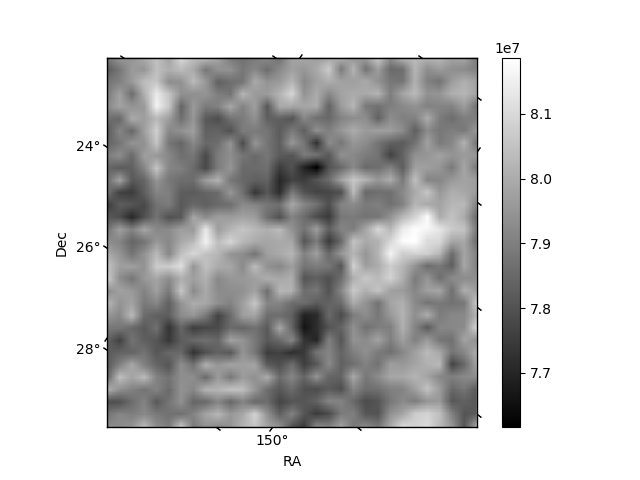
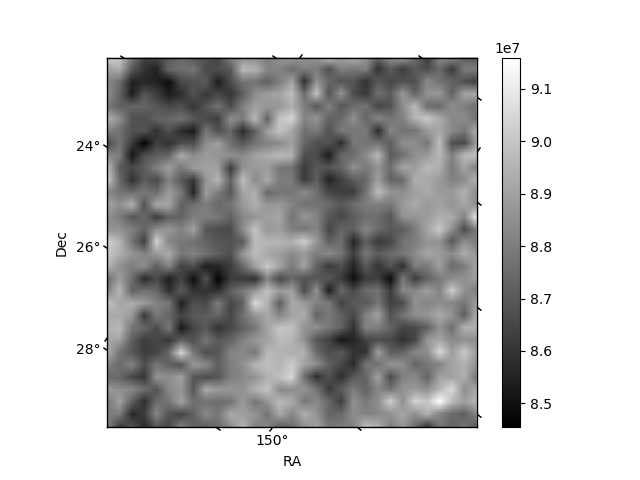
Histogram calculated using DETX and DETY for each event in the final _common_clean file
| Quadrant A | 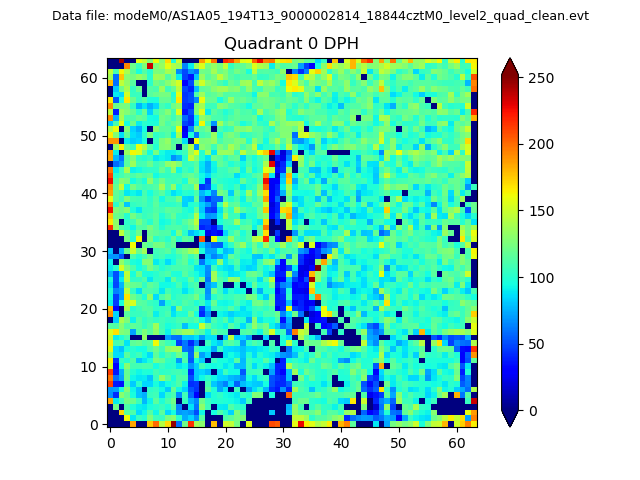 |
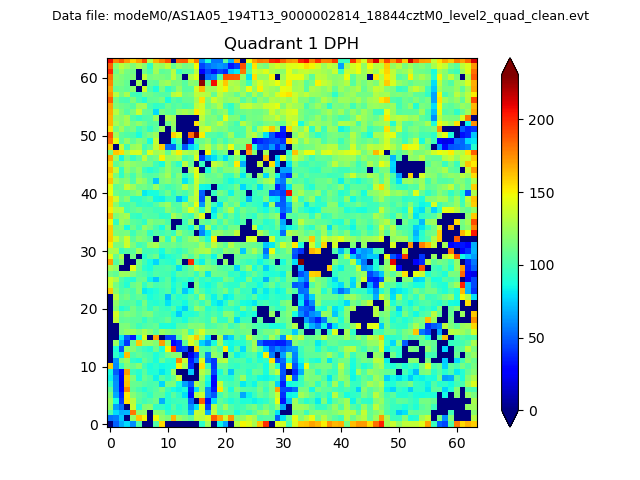 |
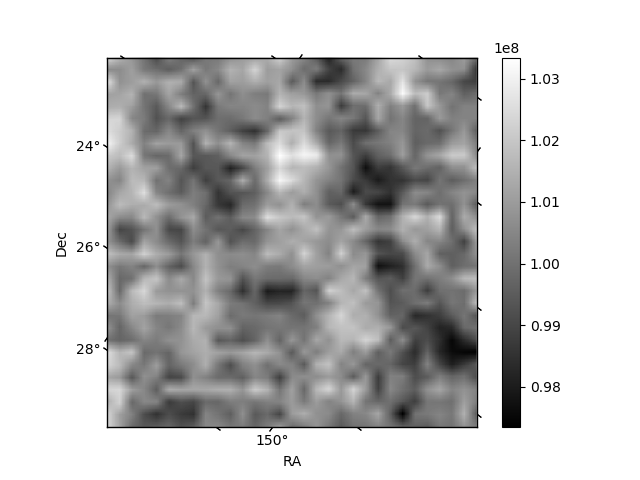
Quadrant B |
|---|---|---|---|
| Quadrant D | 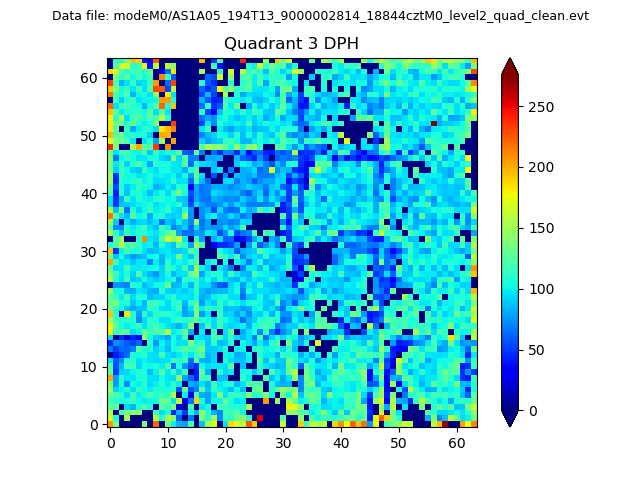 |
 |
Quadrant C |
| Plot type | Count rate plots | Images |
|---|---|---|
| Comparison with Poisson distribution Blue bars denote a histogram of data divided into 1 sec bins. Red curve is a Poisson curve with rate = median count rate of data. |
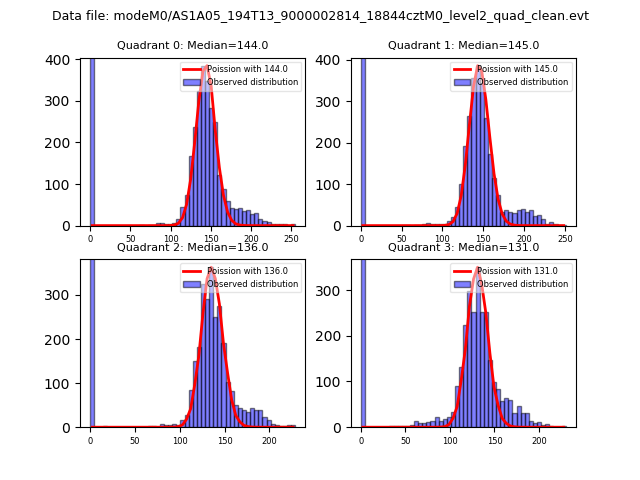 |
 |
| Quadrant-wise count rates Data is divided into 100 sec bins |
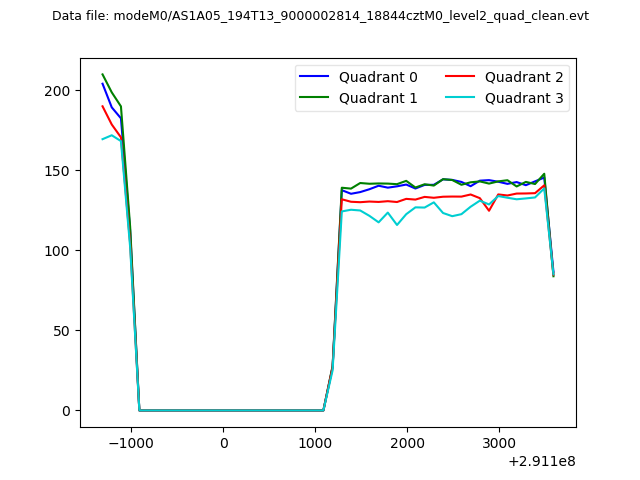 |
|
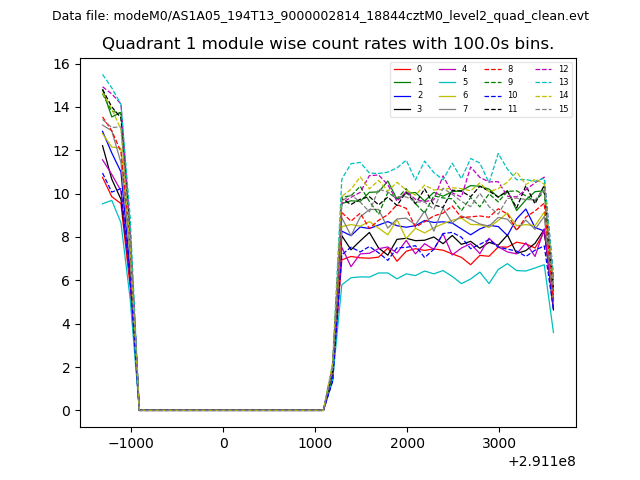
| Module-wise count rates for Quadrant A Data is divided into 100 sec bins |
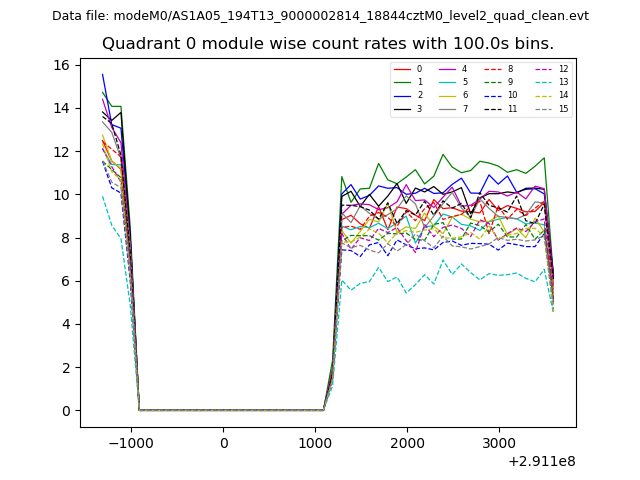 |
 |
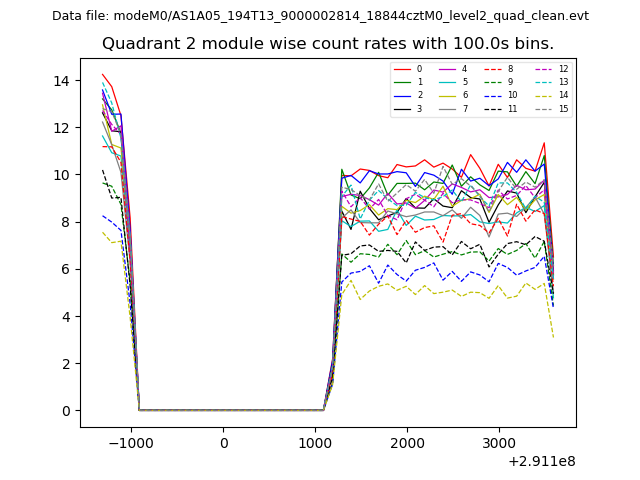
| Module-wise count rates for Quadrant B Data is divided into 100 sec bins |
 |
 |
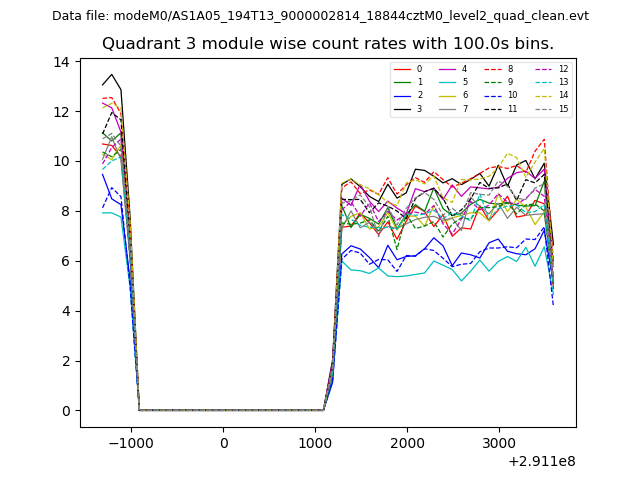
| Module-wise count rates for Quadrant C Data is divided into 100 sec bins |
 |
 |
| Module-wise count rates for Quadrant D Data is divided into 100 sec bins |
 |
 |
| Parameter | Plot |
|---|---|
| CZT HV Monitor | 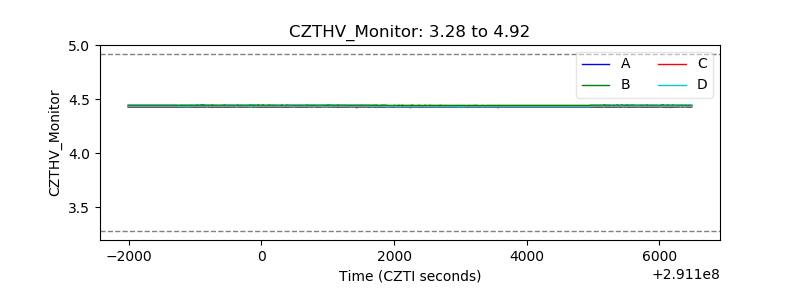 |
| D_VDD | 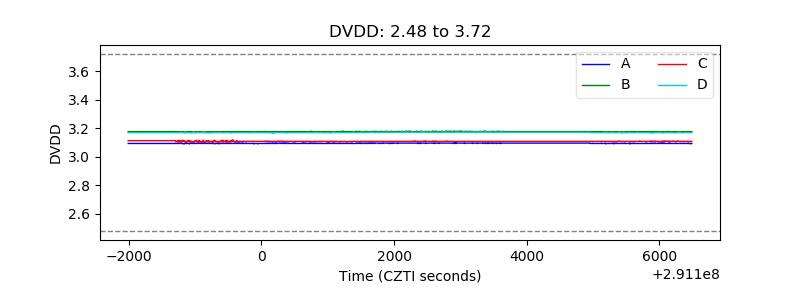 |
| Temperature 1 | 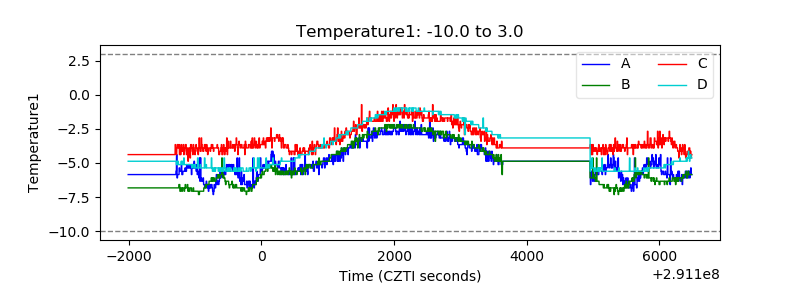 |
| Veto HV Monitor | 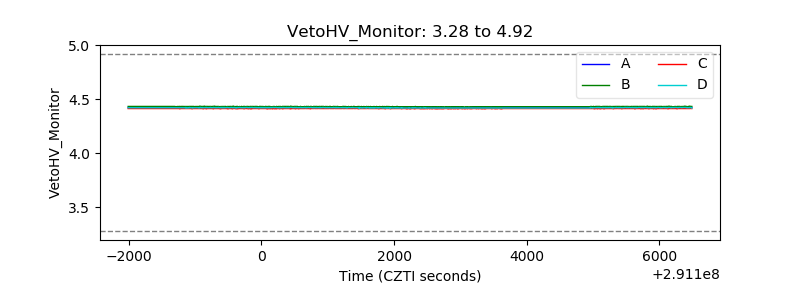 |
| Veto LLD | 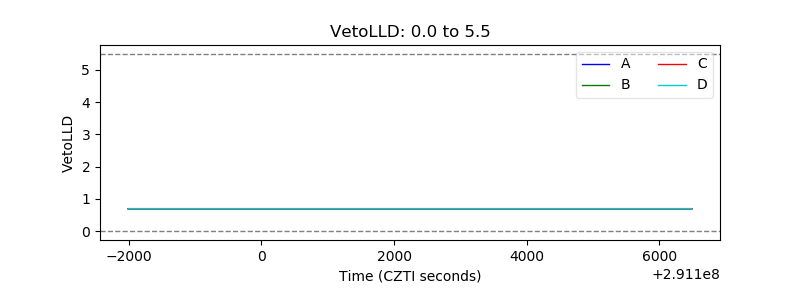 |
| Alpha Counter | 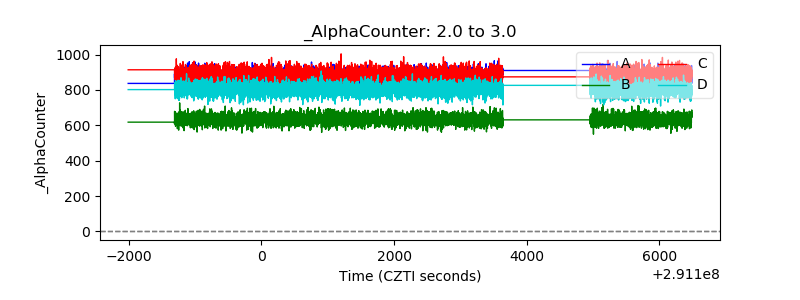 |
| _CPM_Rate | 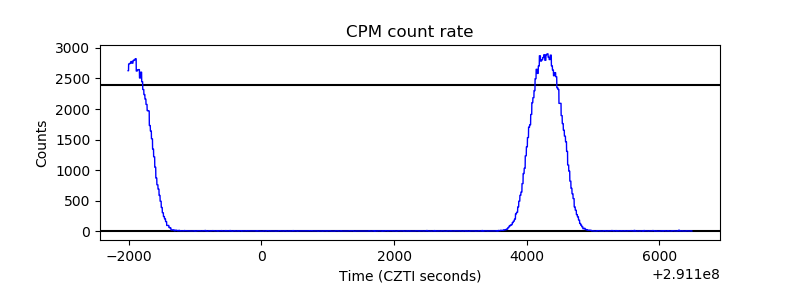 |
| CZT Counter | 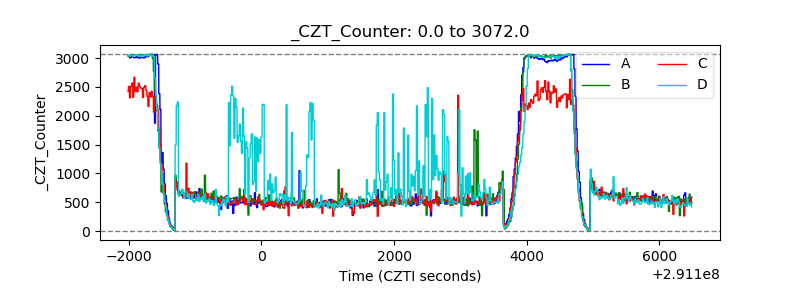 |
| +2.5 Volts monitor |  |
| +5 Volts monitor |  |
| _ROLL_ROT | 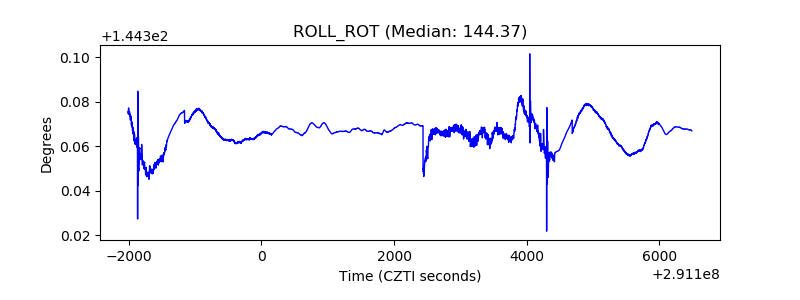 |
| _Roll_DEC | 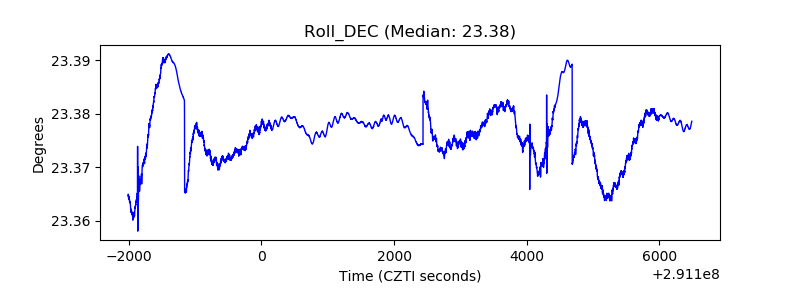 |
| _Roll_RA | 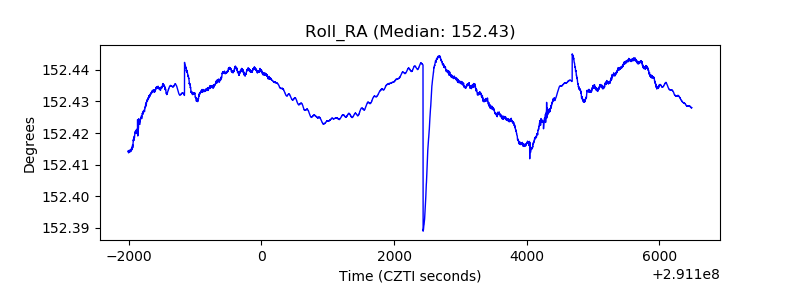 |
| Veto Counter | 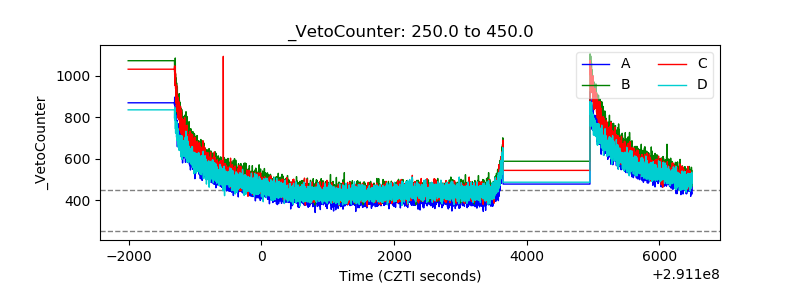 |