| Param | Original file | Final file |
|---|---|---|
| Filename | modeM0/AS1A05_194T13_9000002814_18845cztM0_level2.evt | modeM0/AS1A05_194T13_9000002814_18845cztM0_level2_quad_clean.evt |
| Size (bytes) | 502,263,360 | 65,620,800 |
| Size | 479.0 MB | 62.6 MB |
| Events in quadrant A | 3,515,293 | 401,281 |
| Events in quadrant B | 3,617,300 | 405,568 |
| Events in quadrant C | 3,426,754 | 376,856 |
| Events in quadrant D | 4,224,336 | 362,972 |
| Mode M0 | |||
|---|---|---|---|
| Quadrant | BADHDUFLAG | Total packets | Discarded packets |
| A | 0 | 14155 | 2 |
| B | 0 | 14579 | 2 |
| C | 0 | 13787 | 2 |
| D | 0 | 16405 | 2 |
| Mode SS | |||
|---|---|---|---|
| Quadrant | BADHDUFLAG | Total packets | Discarded packets |
| A | 0 | 130 | 0 |
| B | 0 | 128 | 0 |
| C | 0 | 128 | 0 |
| D | 0 | 128 | 0 |
| Mode M9 | |||
|---|---|---|---|
| Quadrant | BADHDUFLAG | Total packets | Discarded packets |
| A | 0 | 18 | 0 |
| B | 0 | 19 | 0 |
| C | 0 | 19 | 0 |
| D | 0 | 19 | 0 |
| Quadrant | Total seconds | Saturated seconds | Saturation percentage |
|---|---|---|---|
| A | 6301 | 65 | 1.031582% |
| B | 6301 | 83 | 1.317251% |
| C | 6300 | 79 | 1.253968% |
| D | 6300 | 292 | 4.634921% |
Noise dominated data is calculated using 1-second bins in cleaned event files. If a bin has >2000 counts, and if more than 50% of those come from <1% of pixels, then it is considered to be noise-dominated and hence unusable.
| Quadrant | # 1 sec bins | Bins with >0 counts | Bins with >2000 counts | High rate bins dominated by noise | Noise dominated (total time) | Noise dominated (detector-on time) | Marked lightcurve |
|---|---|---|---|---|---|---|---|
| A | 7636 | 6302 | 2 | 2 | 0.03% | 0.03% | 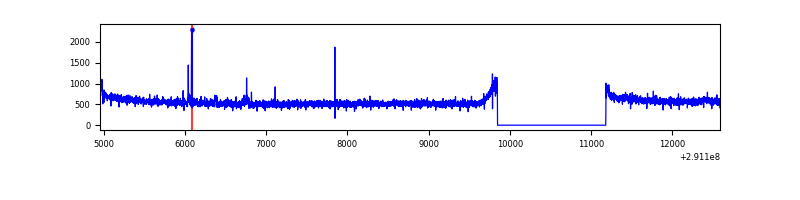 |
| B | 7636 | 6302 | 5 | 5 | 0.07% | 0.08% | 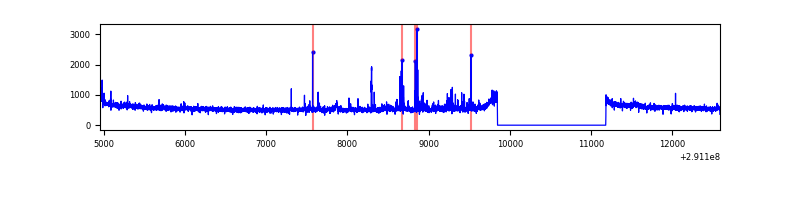 |
| C | 7635 | 6301 | 0 | 0 | 0.00% | 0.00% | 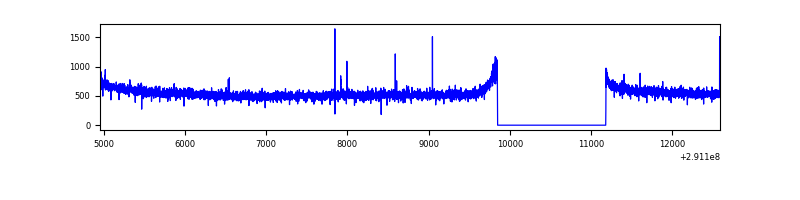 |
| D | 7635 | 6301 | 190 | 190 | 2.49% | 3.02% | 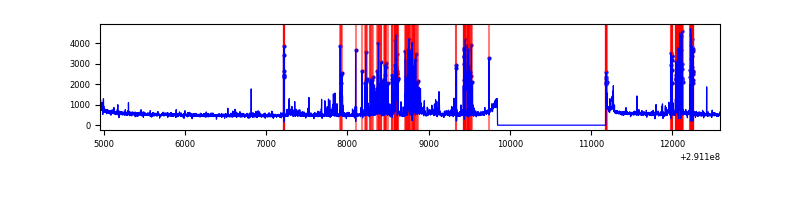 |
Top three noisy pixels from each quadrant. If the there are fewer than three noisy pixels in the level2.evt file, extra rows are filled as -1
| Pixel properties | Quadrant properties | ||||||
|---|---|---|---|---|---|---|---|
| Quadrant | DetID | PixID | Counts | Sigma | Mean | Median | Sigma |
| A | 9 | 143 | 17699 | 94.46 | 897 | 883 | 178.0 |
| A | 0 | 23 | 14851 | 78.46 | 897 | 883 | 178.0 |
| A | 10 | 1 | 10304 | 52.92 | 897 | 883 | 178.0 |
| B | 0 | 197 | 53577 | 319.54 | 892 | 874 | 164.9 |
| B | 0 | 229 | 25019 | 146.39 | 892 | 874 | 164.9 |
| B | 12 | 111 | 18858 | 109.04 | 892 | 874 | 164.9 |
| C | 14 | 238 | 133825 | 691.33 | 835 | 843 | 192.4 |
| C | 3 | 233 | 19016 | 94.48 | 835 | 843 | 192.4 |
| C | 0 | 207 | 8141 | 37.94 | 835 | 843 | 192.4 |
| D | 12 | 1 | 327361 | 1635.34 | 833 | 809 | 199.7 |
| D | 1 | 52 | 310599 | 1551.39 | 833 | 809 | 199.7 |
| D | 1 | 20 | 309696 | 1546.87 | 833 | 809 | 199.7 |
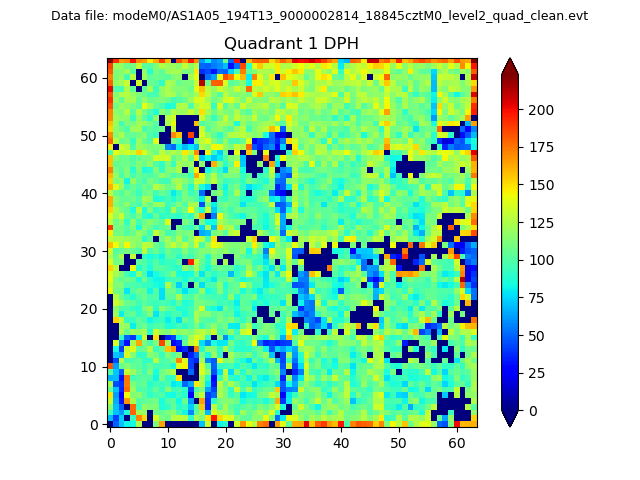
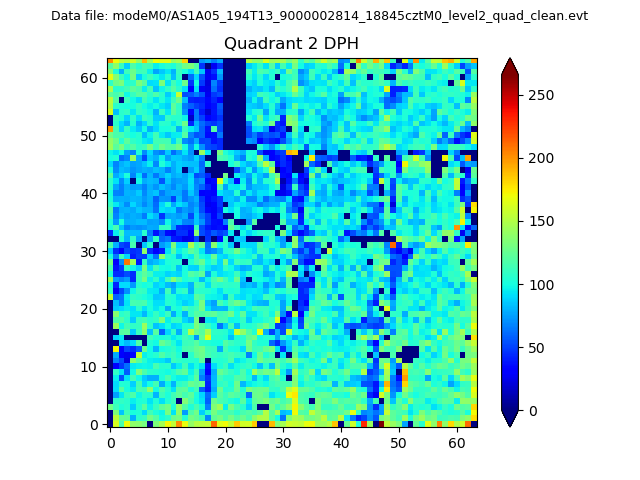
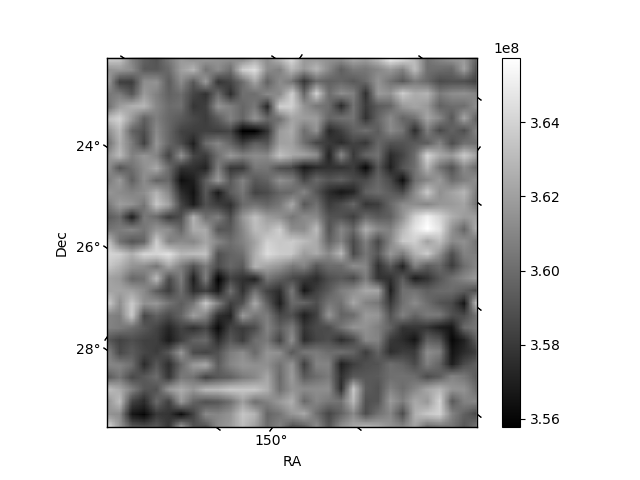
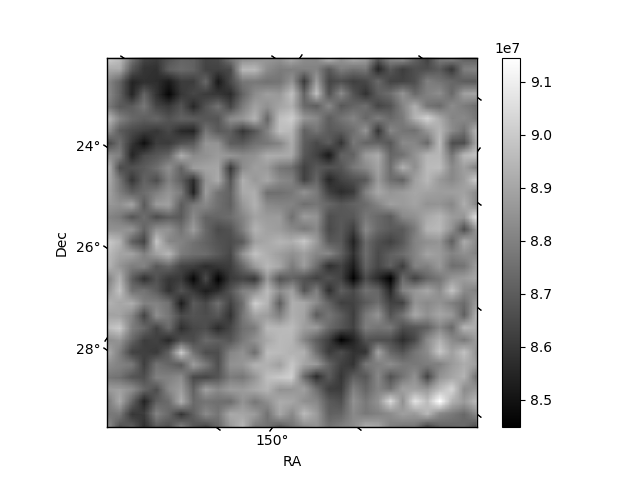
Histogram calculated using DETX and DETY for each event in the final _common_clean file
| Quadrant A |  |
 |
Quadrant B |
|---|---|---|---|
| Quadrant D | 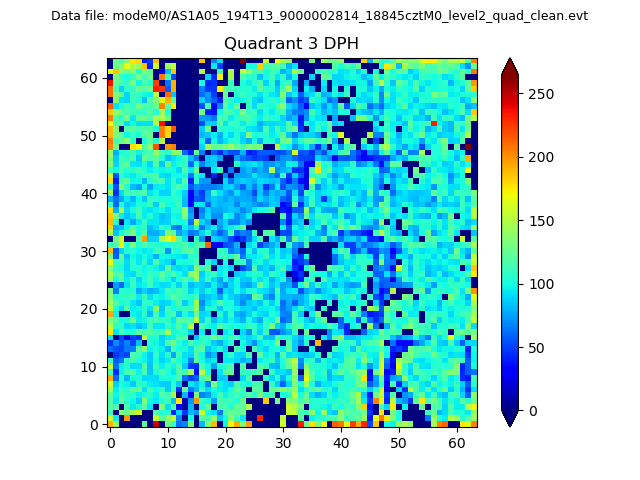 |
 |
Quadrant C |
| Plot type | Count rate plots | Images |
|---|---|---|
| Comparison with Poisson distribution Blue bars denote a histogram of data divided into 1 sec bins. Red curve is a Poisson curve with rate = median count rate of data. |
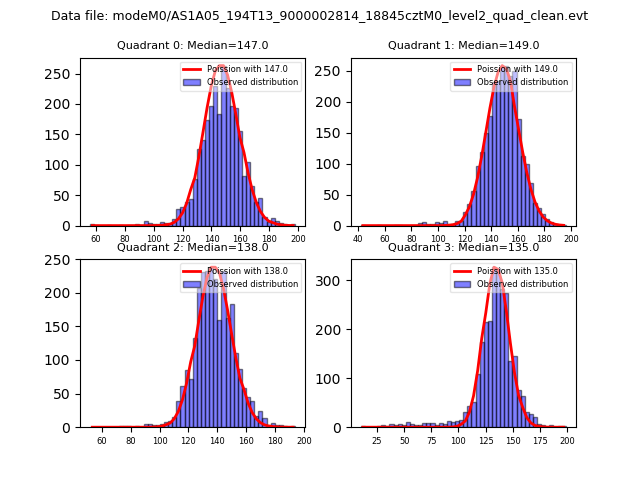 |
 |
| Quadrant-wise count rates Data is divided into 100 sec bins |
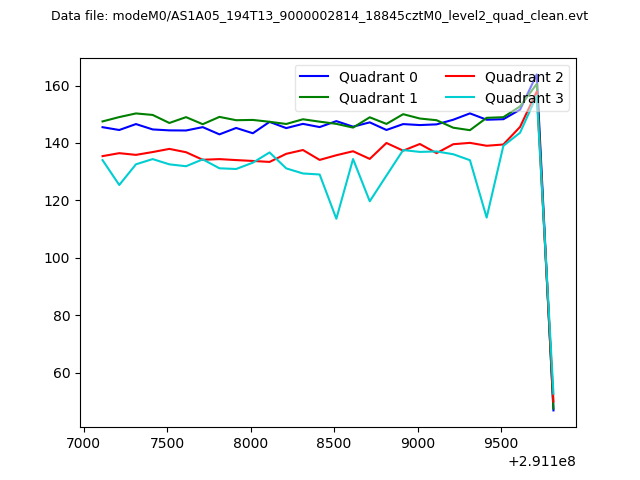 |
|
| Module-wise count rates for Quadrant A Data is divided into 100 sec bins |
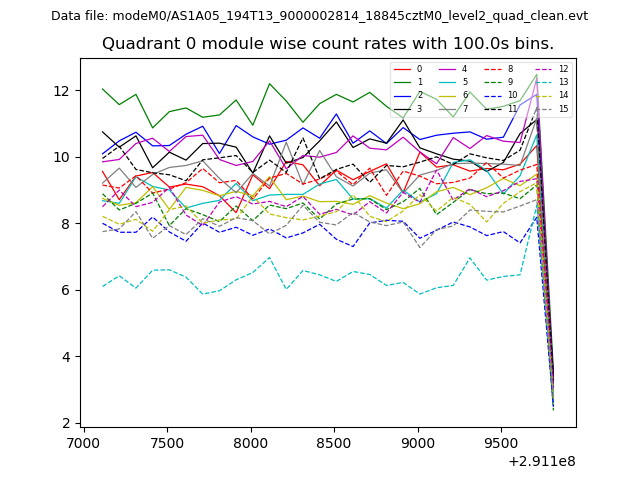 |
 |
| Module-wise count rates for Quadrant B Data is divided into 100 sec bins |
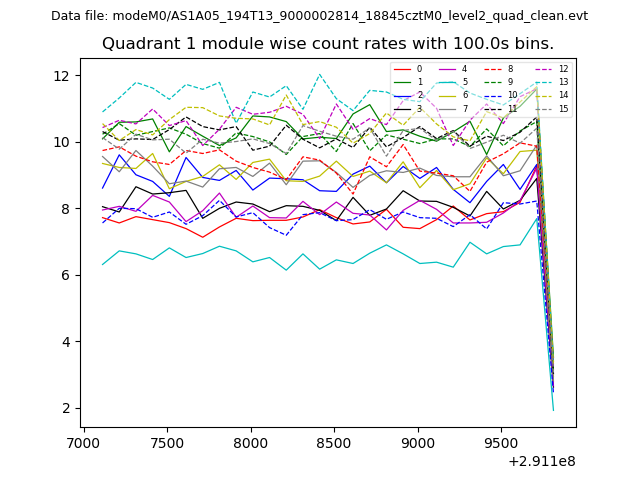 |
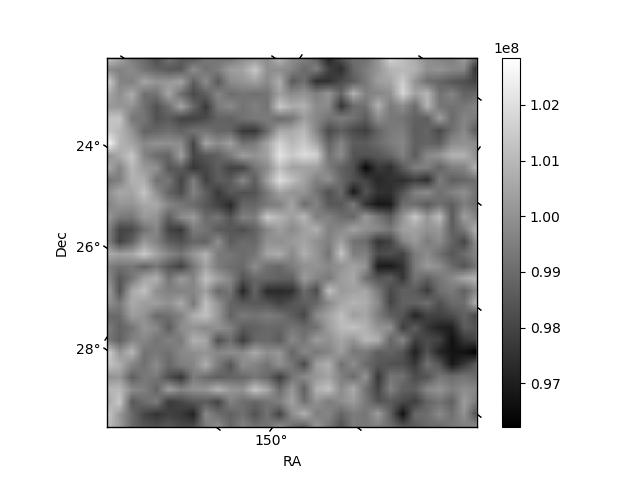 |
| Module-wise count rates for Quadrant C Data is divided into 100 sec bins |
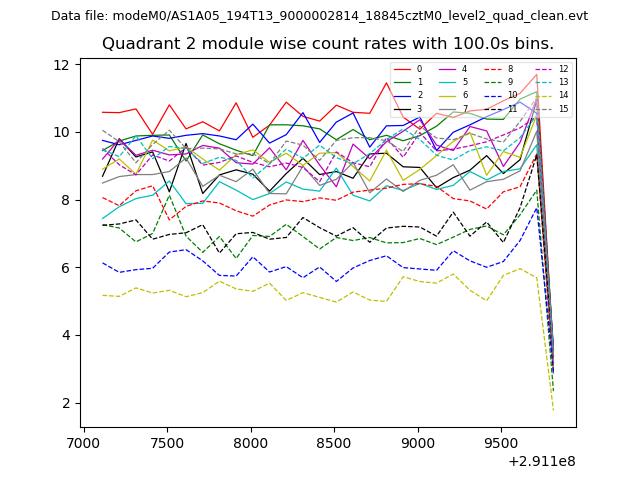 |
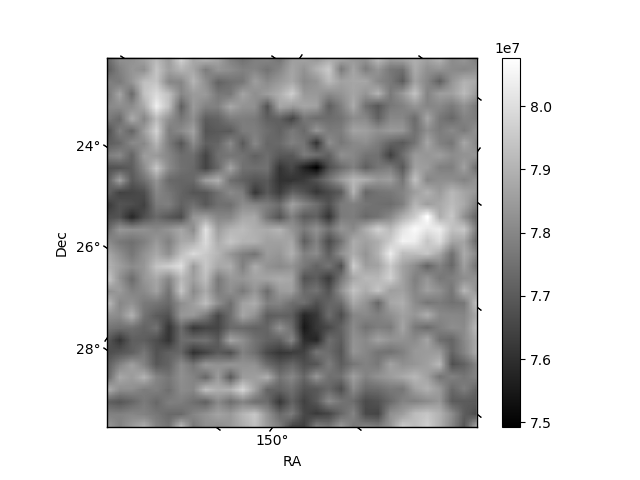 |
| Module-wise count rates for Quadrant D Data is divided into 100 sec bins |
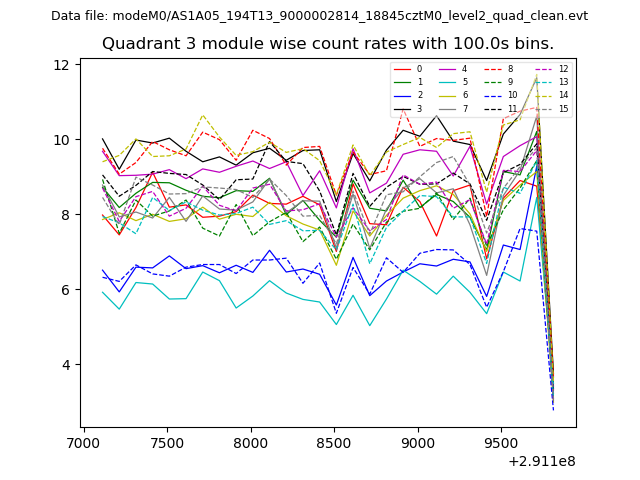 |
 |
| Parameter | Plot |
|---|---|
| CZT HV Monitor | 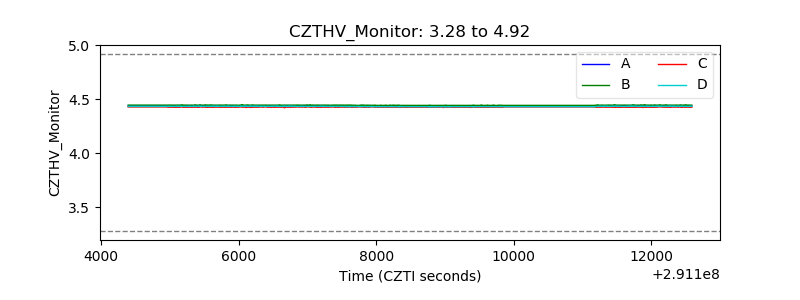 |
| D_VDD | 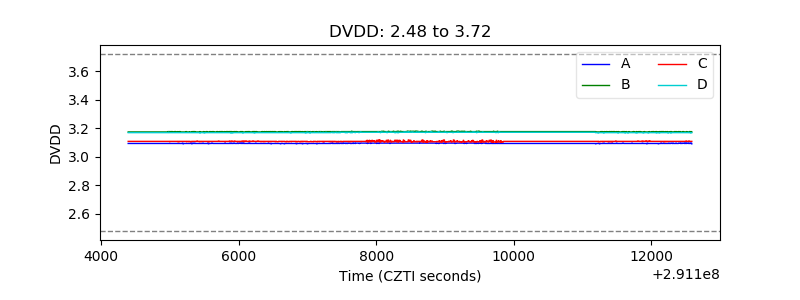 |
| Temperature 1 | 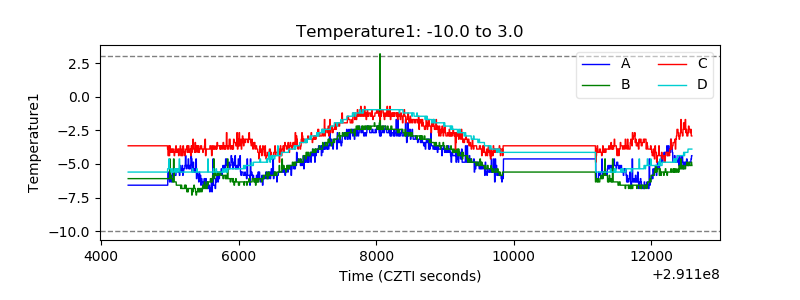 |
| Veto HV Monitor | 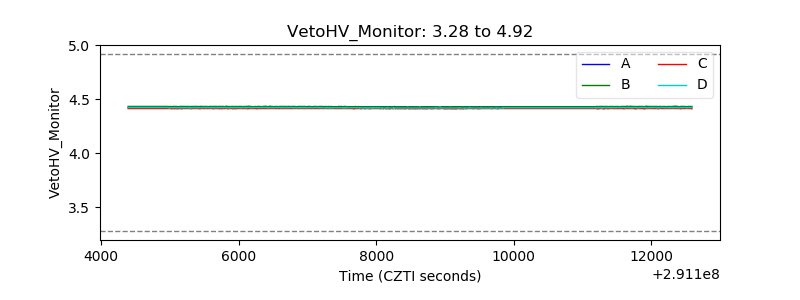 |
| Veto LLD | 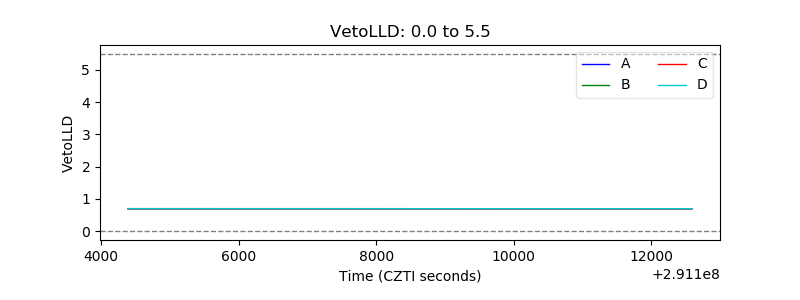 |
| Alpha Counter | 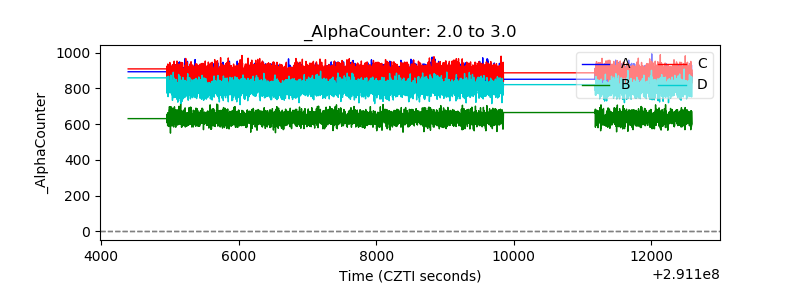 |
| _CPM_Rate | 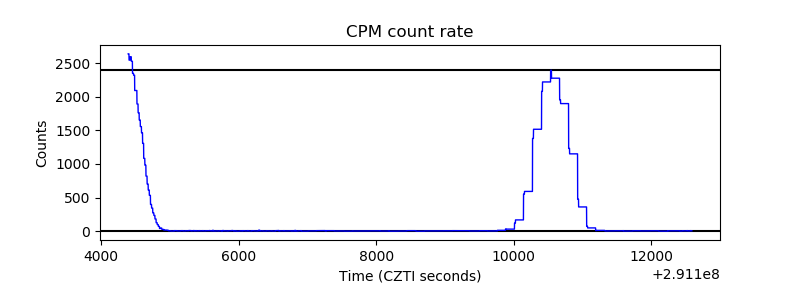 |
| CZT Counter | 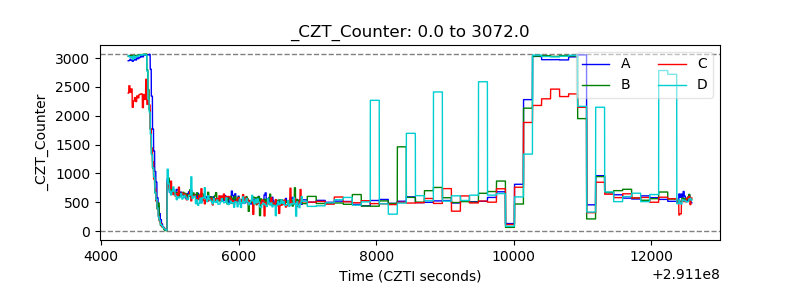 |
| +2.5 Volts monitor |  |
| +5 Volts monitor |  |
| _ROLL_ROT | 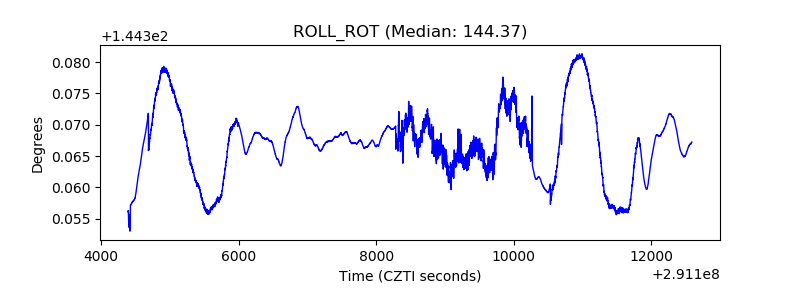 |
| _Roll_DEC | 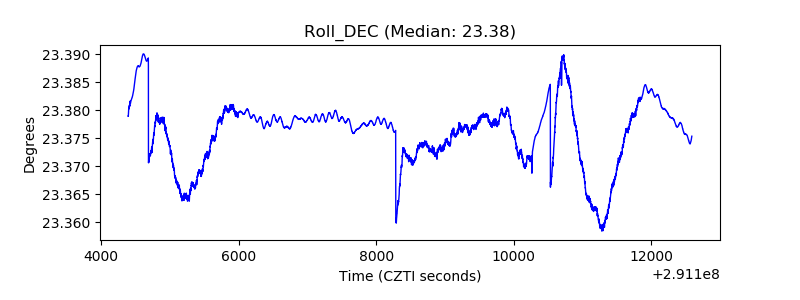 |
| _Roll_RA | 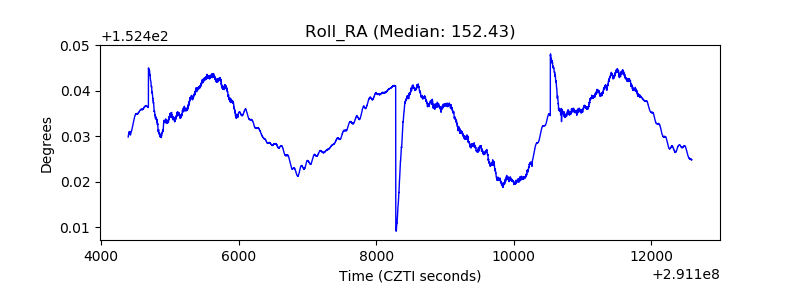 |
| Veto Counter | 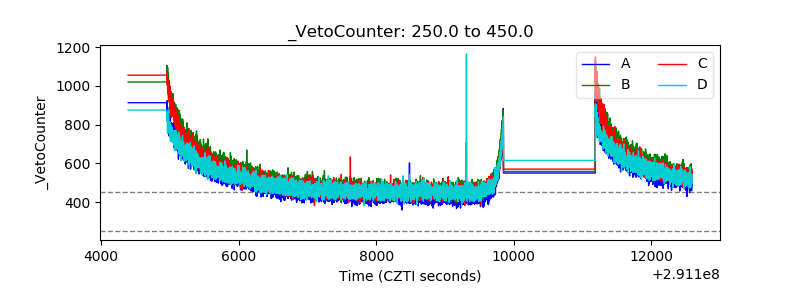 |