| Param | Original file | Final file |
|---|---|---|
| Filename | modeM0/AS1T03_094T01_9000002816cztM0_level2.fits | modeM0/AS1T03_094T01_9000002816cztM0_level2_quad_clean.evt |
| Size (bytes) | 1,472,627,520 | 1,207,422,720 |
| Size | 1.4 GB | 1.1 GB |
| Events in quadrant A | 9,107,138 | 6,824,755 |
| Events in quadrant B | 8,755,440 | 6,943,397 |
| Events in quadrant C | 8,909,162 | 6,564,306 |
| Events in quadrant D | 7,523,010 | 5,933,129 |
| Mode M9 | |||
|---|---|---|---|
| Quadrant | BADHDUFLAG | Total packets | Discarded packets |
| A | 0 | 238 | 0 |
| B | 0 | 238 | 0 |
| C | 0 | 238 | 0 |
| D | 0 | 238 | 0 |
| Mode SS | |||
|---|---|---|---|
| Quadrant | BADHDUFLAG | Total packets | Discarded packets |
| A | 0 | 3064 | 0 |
| B | 0 | 3064 | 0 |
| C | 0 | 3064 | 0 |
| D | 0 | 3064 | 0 |
| Mode M0 | |||
|---|---|---|---|
| Quadrant | BADHDUFLAG | Total packets | Discarded packets |
| A | 0 | 333738 | 0 |
| B | 0 | 332554 | 0 |
| C | 0 | 326579 | 0 |
| D | 0 | 423929 | 0 |
| Quadrant | Total seconds | Saturated seconds | Saturation percentage |
|---|---|---|---|
| A | 150323 | 3517 | 2.339629% |
| B | 150323 | 2773 | 1.844694% |
| C | 150323 | 3244 | 2.158020% |
| D | 150323 | 9240 | 6.146764% |
Noise dominated data is calculated using 1-second bins in cleaned event files. If a bin has >2000 counts, and if more than 50% of those come from <1% of pixels, then it is considered to be noise-dominated and hence unusable.
| Quadrant | # 1 sec bins | Bins with >0 counts | Bins with >2000 counts | High rate bins dominated by noise | Noise dominated (total time) | Noise dominated (detector-on time) | Marked lightcurve |
|---|---|---|---|---|---|---|---|
| A | 173867 | 150323 | 0 | 0 | 0.00% | 0.00% | 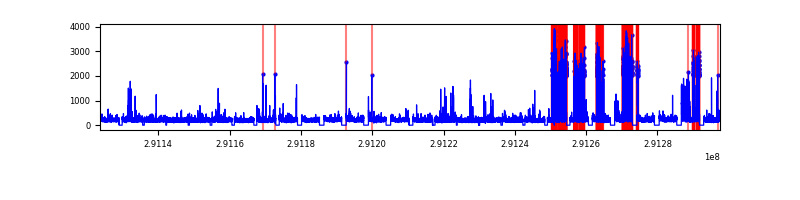 |
| B | 173867 | 150318 | 0 | 0 | 0.00% | 0.00% | 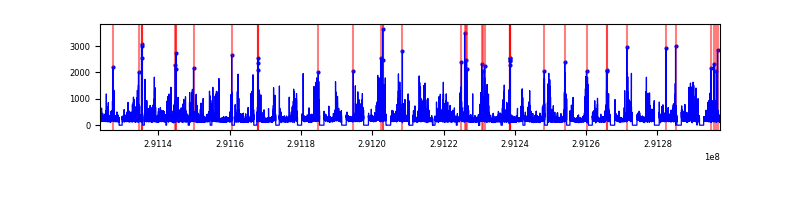 |
| C | 173867 | 150312 | 0 | 0 | 0.00% | 0.00% |  |
| D | 173867 | 150217 | 0 | 0 | 0.00% | 0.00% | 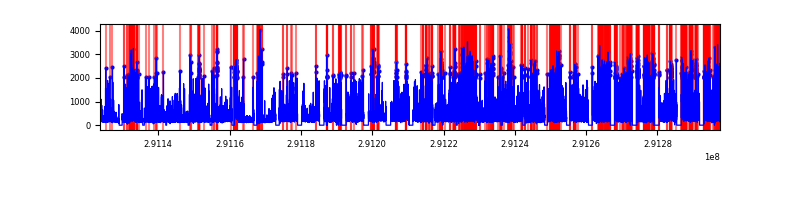 |
Top three noisy pixels from each quadrant. If the there are fewer than three noisy pixels in the level2.evt file, extra rows are filled as -1
| Pixel properties | Quadrant properties | ||||||
|---|---|---|---|---|---|---|---|
| Quadrant | DetID | PixID | Counts | Sigma | Mean | Median | Sigma |
| A | 0 | 29 | 7533 | 9.14 | 2373 | 2223 | 581.2 |
| A | 7 | 110 | 7519 | 9.11 | 2373 | 2223 | 581.2 |
| A | 9 | 19 | 6767 | 7.82 | 2373 | 2223 | 581.2 |
| B | 2 | 9 | 7019 | 10.67 | 2318 | 2213 | 450.5 |
| B | 2 | 8 | 5815 | 7.99 | 2318 | 2213 | 450.5 |
| B | 3 | 17 | 5773 | 7.9 | 2318 | 2213 | 450.5 |
| C | 1 | 80 | 6797 | 7.68 | 2348 | 2189 | 599.8 |
| C | 1 | 81 | 6731 | 7.57 | 2348 | 2189 | 599.8 |
| C | 12 | 241 | 6102 | 6.52 | 2348 | 2189 | 599.8 |
| D | 10 | 190 | 5677 | 6.54 | 2152 | 1960 | 568.7 |
| D | 3 | 14 | 5602 | 6.4 | 2152 | 1960 | 568.7 |
| D | 10 | 189 | 5230 | 5.75 | 2152 | 1960 | 568.7 |
Histogram calculated using DETX and DETY for each event in the final _common_clean file
| Quadrant A |  |
 |
Quadrant B |
|---|---|---|---|
| Quadrant D |  |
 |
Quadrant C |
| Plot type | Count rate plots | Images |
|---|---|---|
| Comparison with Poisson distribution Blue bars denote a histogram of data divided into 1 sec bins. Red curve is a Poisson curve with rate = median count rate of data. |
 |
 |
| Quadrant-wise count rates Data is divided into 100 sec bins |
 |
|
| Module-wise count rates for Quadrant A Data is divided into 100 sec bins |
 |
 |
| Module-wise count rates for Quadrant B Data is divided into 100 sec bins |
 |
 |
| Module-wise count rates for Quadrant C Data is divided into 100 sec bins |
 |
 |
| Module-wise count rates for Quadrant D Data is divided into 100 sec bins |
 |
 |
| Parameter | Plot |
|---|---|
| CZT HV Monitor |  |
| D_VDD |  |
| Temperature 1 |  |
| Veto HV Monitor |  |
| Veto LLD |  |
| Alpha Counter |  |
| _CPM_Rate |  |
| CZT Counter |  |
| +2.5 Volts monitor |  |
| +5 Volts monitor |  |
| _ROLL_ROT |  |
| _Roll_DEC | 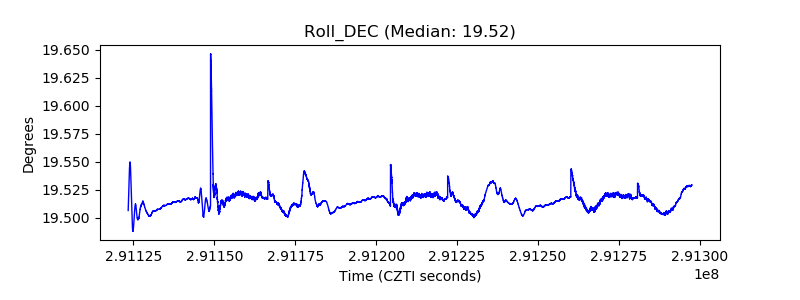 |
| _Roll_RA |  |
| Veto Counter |  |