| Param | Original file | Final file |
|---|---|---|
| Filename | modeM0/AS1T03_094T01_9000002816_18847cztM0_level2.evt | modeM0/AS1T03_094T01_9000002816_18847cztM0_level2_quad_clean.evt |
| Size (bytes) | 90,619,200 | 24,465,600 |
| Size | 86.4 MB | 23.3 MB |
| Events in quadrant A | 669,498 | 164,465 |
| Events in quadrant B | 669,188 | 167,975 |
| Events in quadrant C | 654,454 | 156,671 |
| Events in quadrant D | 660,944 | 154,858 |
| Mode M9 | |||
|---|---|---|---|
| Quadrant | BADHDUFLAG | Total packets | Discarded packets |
| A | 0 | 3 | 0 |
| B | 0 | 3 | 0 |
| C | 0 | 3 | 0 |
| D | 0 | 3 | 0 |
| Mode SS | |||
|---|---|---|---|
| Quadrant | BADHDUFLAG | Total packets | Discarded packets |
| A | 0 | 26 | 0 |
| B | 0 | 26 | 0 |
| C | 0 | 26 | 0 |
| D | 0 | 26 | 0 |
| Mode M0 | |||
|---|---|---|---|
| Quadrant | BADHDUFLAG | Total packets | Discarded packets |
| A | 0 | 2670 | 1 |
| B | 0 | 2683 | 1 |
| C | 0 | 2661 | 1 |
| D | 0 | 2728 | 2 |
| Quadrant | Total seconds | Saturated seconds | Saturation percentage |
|---|---|---|---|
| A | 1283 | 3 | 0.233827% |
| B | 1283 | 6 | 0.467654% |
| C | 1283 | 9 | 0.701481% |
| D | 1282 | 1 | 0.078003% |
Noise dominated data is calculated using 1-second bins in cleaned event files. If a bin has >2000 counts, and if more than 50% of those come from <1% of pixels, then it is considered to be noise-dominated and hence unusable.
| Quadrant | # 1 sec bins | Bins with >0 counts | Bins with >2000 counts | High rate bins dominated by noise | Noise dominated (total time) | Noise dominated (detector-on time) | Marked lightcurve |
|---|---|---|---|---|---|---|---|
| A | 1283 | 1283 | 0 | 0 | 0.00% | 0.00% | 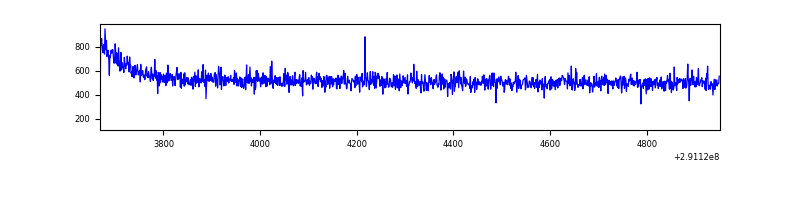 |
| B | 1283 | 1283 | 0 | 0 | 0.00% | 0.00% | 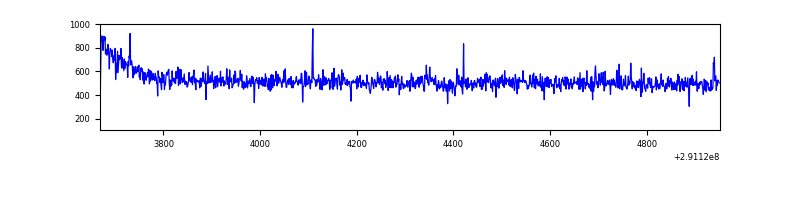 |
| C | 1283 | 1283 | 0 | 0 | 0.00% | 0.00% |  |
| D | 1282 | 1282 | 0 | 0 | 0.00% | 0.00% | 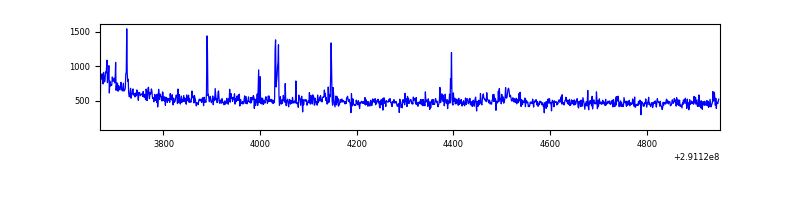 |
Top three noisy pixels from each quadrant. If the there are fewer than three noisy pixels in the level2.evt file, extra rows are filled as -1
| Pixel properties | Quadrant properties | ||||||
|---|---|---|---|---|---|---|---|
| Quadrant | DetID | PixID | Counts | Sigma | Mean | Median | Sigma |
| A | 13 | 254 | 1900 | 47.32 | 173 | 170 | 36.6 |
| A | 0 | 226 | 1530 | 37.2 | 173 | 170 | 36.6 |
| A | 3 | 137 | 1253 | 29.63 | 173 | 170 | 36.6 |
| B | 12 | 111 | 3746 | 103.83 | 170 | 167 | 34.5 |
| B | 11 | 111 | 3465 | 95.68 | 170 | 167 | 34.5 |
| B | 14 | 111 | 2985 | 81.75 | 170 | 167 | 34.5 |
| C | 14 | 238 | 25649 | 648.82 | 161 | 161 | 39.3 |
| C | 13 | 61 | 997 | 21.28 | 161 | 161 | 39.3 |
| C | 3 | 233 | 728 | 14.43 | 161 | 161 | 39.3 |
| D | 7 | 238 | 17330 | 412.82 | 165 | 160 | 41.6 |
| D | 14 | 34 | 5604 | 130.89 | 165 | 160 | 41.6 |
| D | 12 | 1 | 5378 | 125.46 | 165 | 160 | 41.6 |
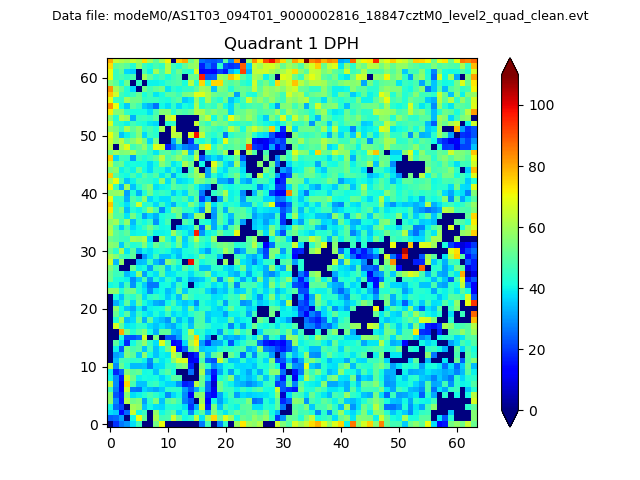
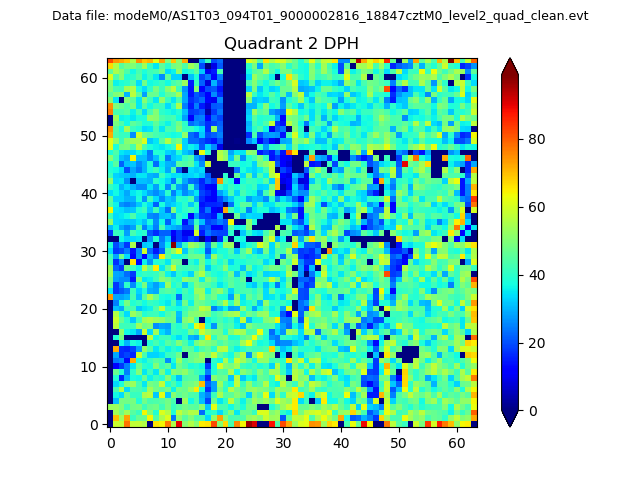
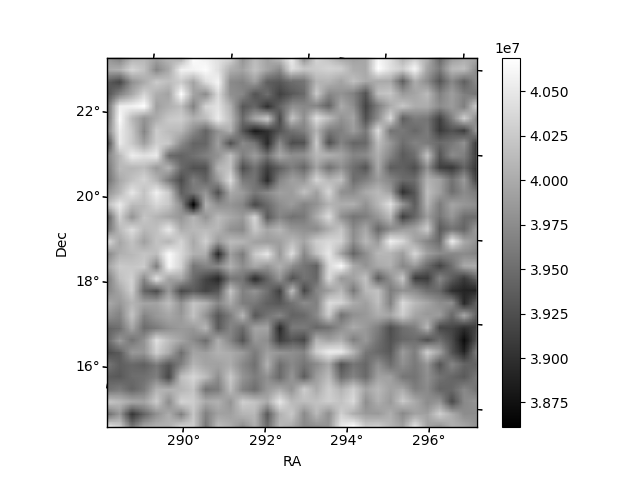
Histogram calculated using DETX and DETY for each event in the final _common_clean file
| Quadrant A | 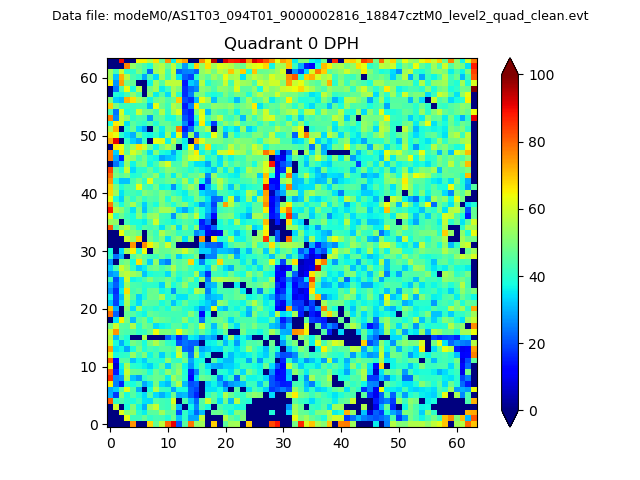 |
 |
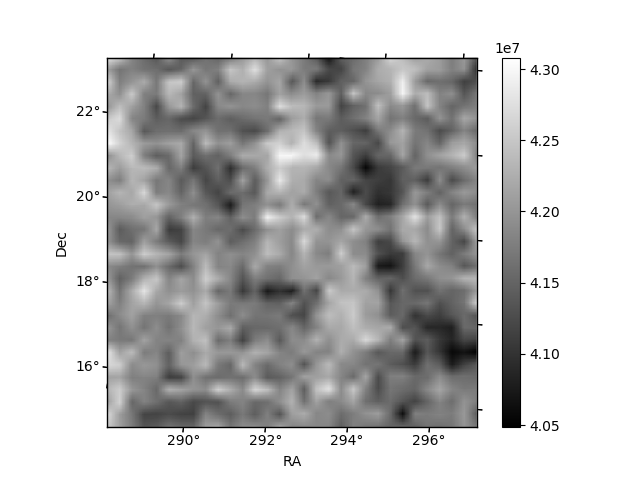
Quadrant B |
|---|---|---|---|
| Quadrant D |  |
 |
Quadrant C |
| Plot type | Count rate plots | Images |
|---|---|---|
| Comparison with Poisson distribution Blue bars denote a histogram of data divided into 1 sec bins. Red curve is a Poisson curve with rate = median count rate of data. |
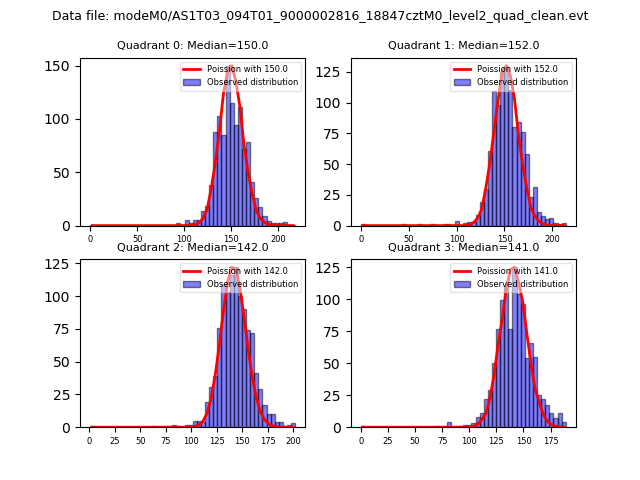 |
 |
| Quadrant-wise count rates Data is divided into 100 sec bins |
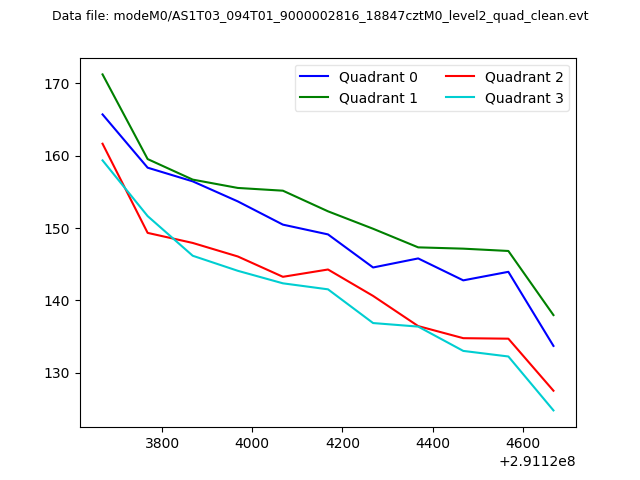 |
|
| Module-wise count rates for Quadrant A Data is divided into 100 sec bins |
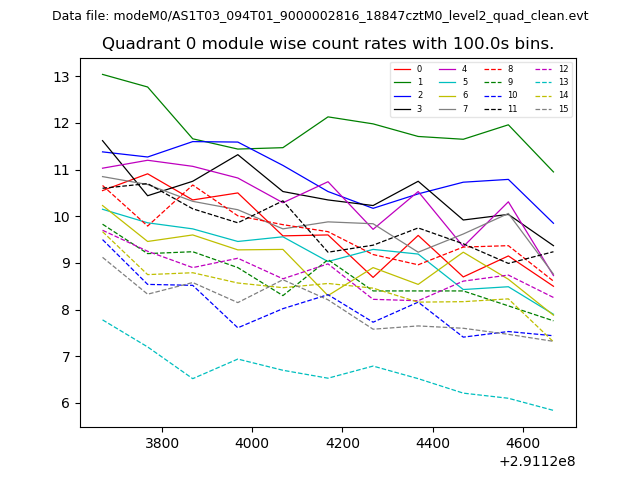 |
 |
| Module-wise count rates for Quadrant B Data is divided into 100 sec bins |
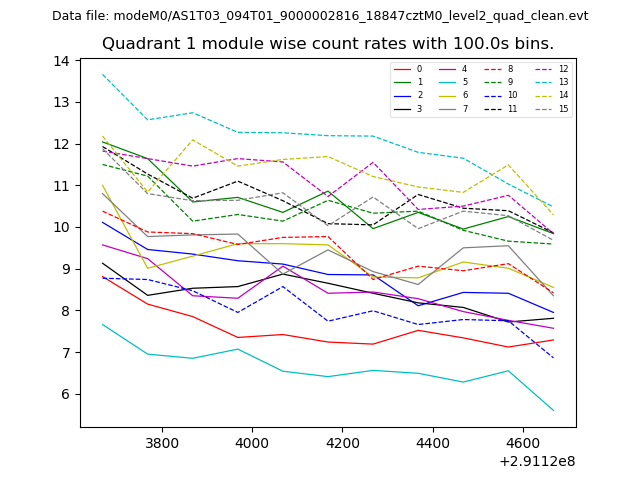 |
 |
| Module-wise count rates for Quadrant C Data is divided into 100 sec bins |
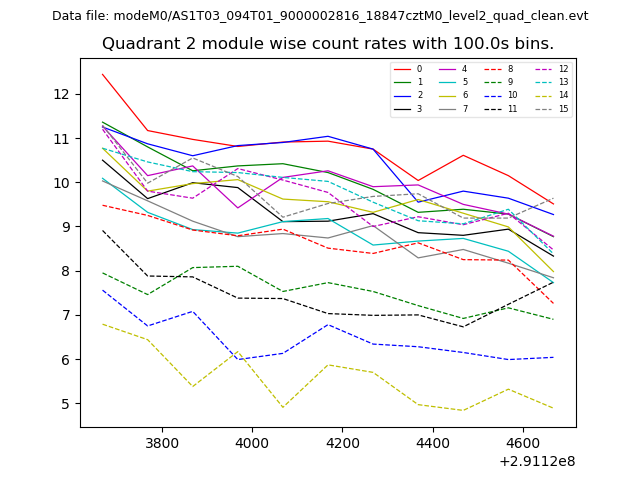 |
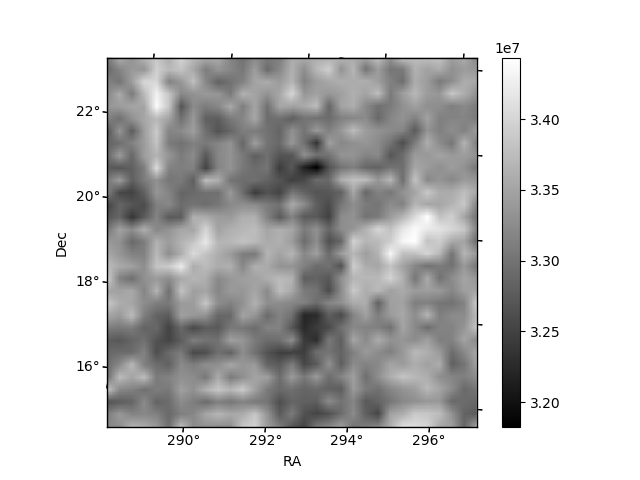 |
| Module-wise count rates for Quadrant D Data is divided into 100 sec bins |
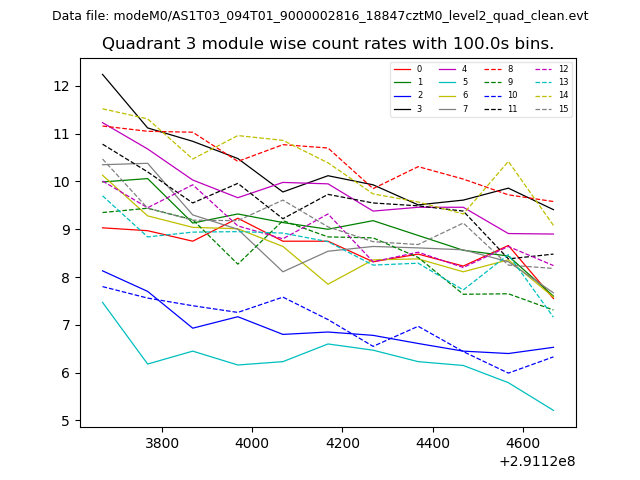 |
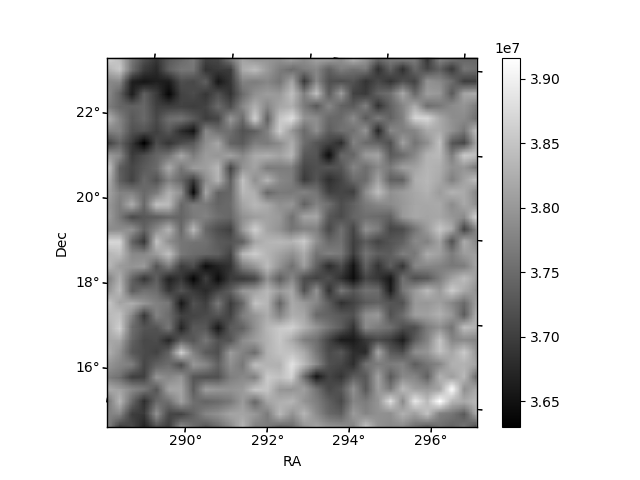 |
| Parameter | Plot |
|---|---|
| CZT HV Monitor | 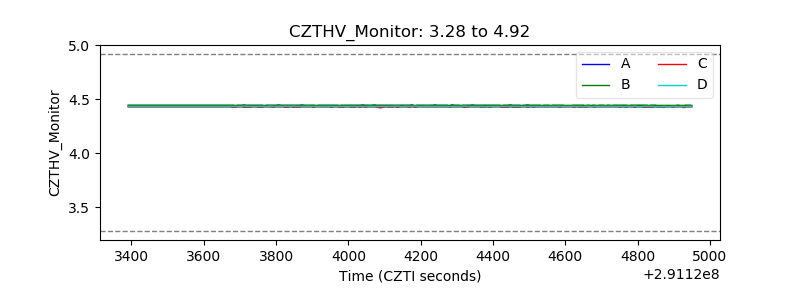 |
| D_VDD | 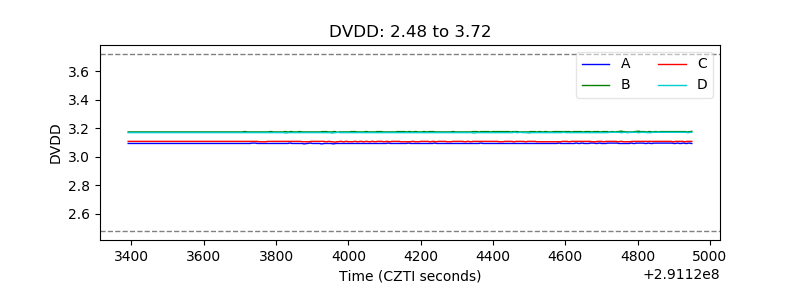 |
| Temperature 1 | 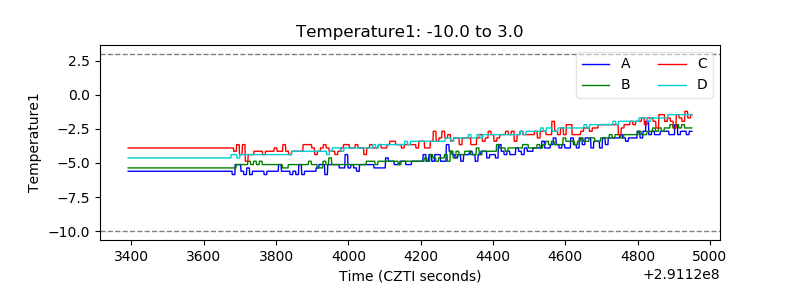 |
| Veto HV Monitor |  |
| Veto LLD | 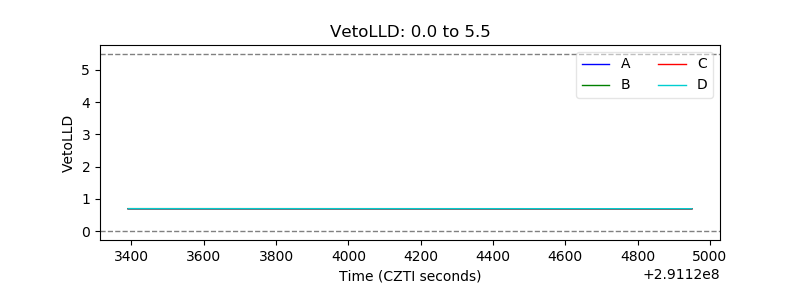 |
| Alpha Counter | 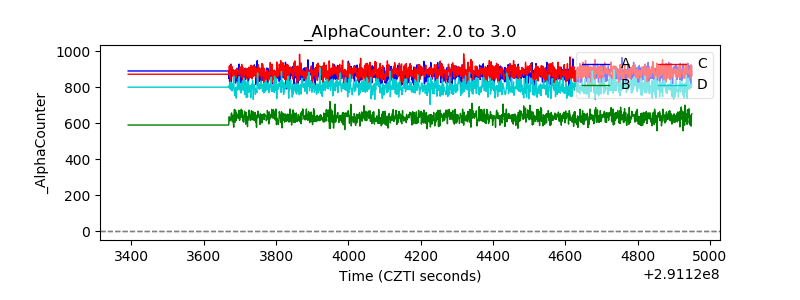 |
| _CPM_Rate | 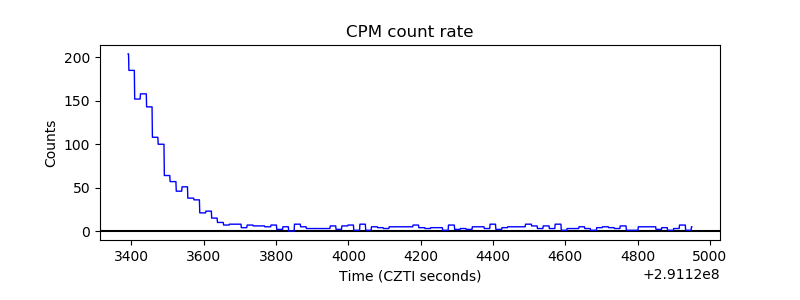 |
| CZT Counter |  |
| +2.5 Volts monitor |  |
| +5 Volts monitor | 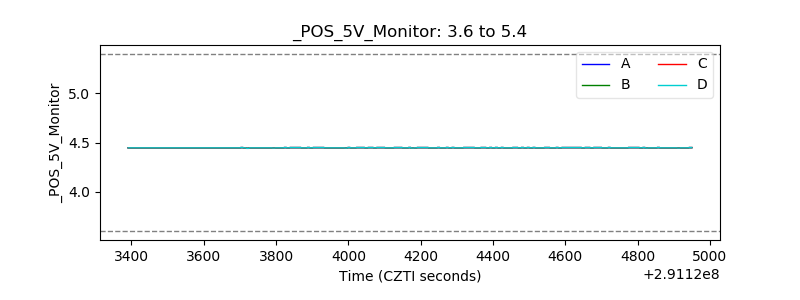 |
| _ROLL_ROT | 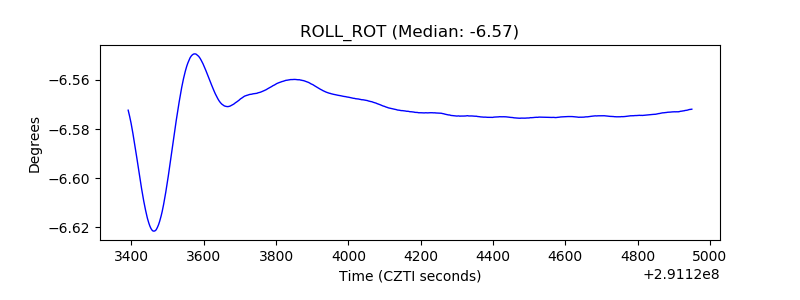 |
| _Roll_DEC | 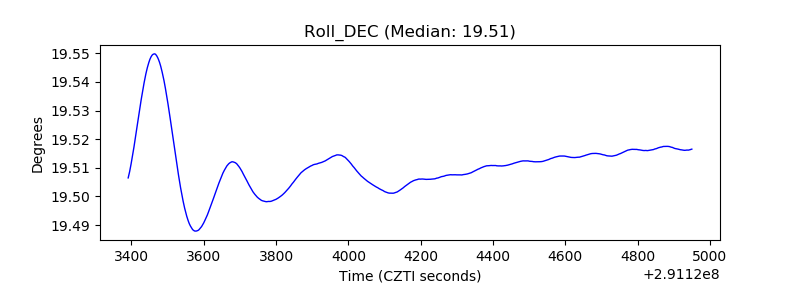 |
| _Roll_RA | 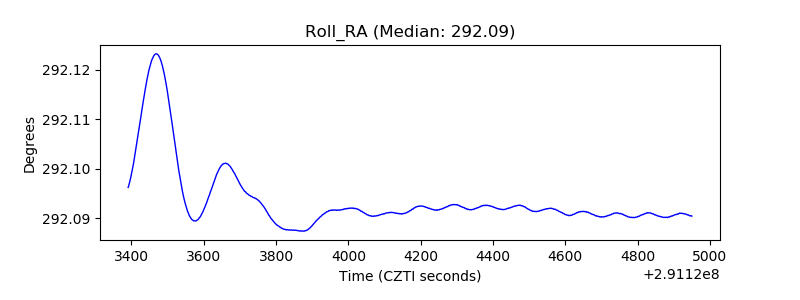 |
| Veto Counter | 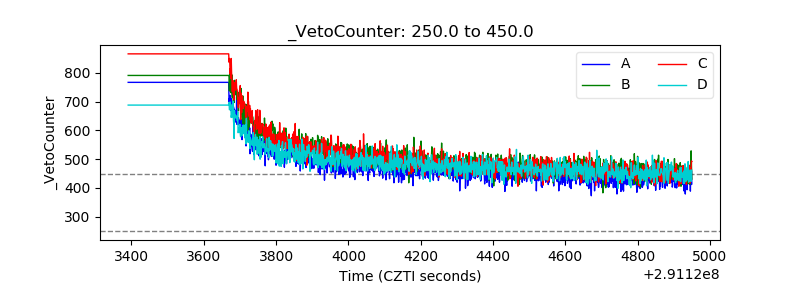 |