| Param | Original file | Final file |
|---|---|---|
| Filename | modeM0/AS1T03_094T01_9000002816_18848cztM0_level2.evt | modeM0/AS1T03_094T01_9000002816_18848cztM0_level2_quad_clean.evt |
| Size (bytes) | 454,921,920 | 79,407,360 |
| Size | 433.8 MB | 75.7 MB |
| Events in quadrant A | 3,236,774 | 496,492 |
| Events in quadrant B | 3,377,154 | 504,998 |
| Events in quadrant C | 3,292,942 | 479,609 |
| Events in quadrant D | 3,429,861 | 471,277 |
| Mode M9 | |||
|---|---|---|---|
| Quadrant | BADHDUFLAG | Total packets | Discarded packets |
| A | 0 | 8 | 0 |
| B | 0 | 8 | 0 |
| C | 0 | 8 | 0 |
| D | 0 | 8 | 0 |
| Mode SS | |||
|---|---|---|---|
| Quadrant | BADHDUFLAG | Total packets | Discarded packets |
| A | 0 | 132 | 0 |
| B | 0 | 132 | 0 |
| C | 0 | 132 | 0 |
| D | 0 | 132 | 0 |
| Mode M0 | |||
|---|---|---|---|
| Quadrant | BADHDUFLAG | Total packets | Discarded packets |
| A | 0 | 13338 | 1 |
| B | 0 | 13725 | 1 |
| C | 0 | 13508 | 1 |
| D | 0 | 14299 | 1 |
| Quadrant | Total seconds | Saturated seconds | Saturation percentage |
|---|---|---|---|
| A | 6480 | 110 | 1.697531% |
| B | 6481 | 116 | 1.789847% |
| C | 6481 | 149 | 2.299028% |
| D | 6480 | 116 | 1.790123% |
Noise dominated data is calculated using 1-second bins in cleaned event files. If a bin has >2000 counts, and if more than 50% of those come from <1% of pixels, then it is considered to be noise-dominated and hence unusable.
| Quadrant | # 1 sec bins | Bins with >0 counts | Bins with >2000 counts | High rate bins dominated by noise | Noise dominated (total time) | Noise dominated (detector-on time) | Marked lightcurve |
|---|---|---|---|---|---|---|---|
| A | 7335 | 6481 | 0 | 0 | 0.00% | 0.00% | 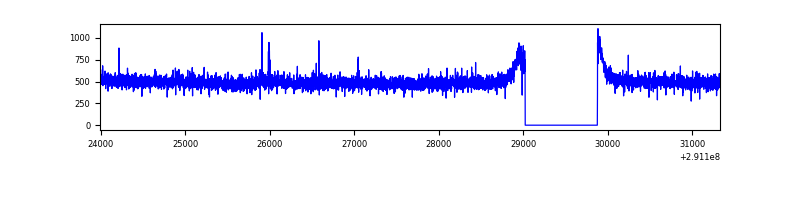 |
| B | 7336 | 6482 | 4 | 4 | 0.05% | 0.06% | 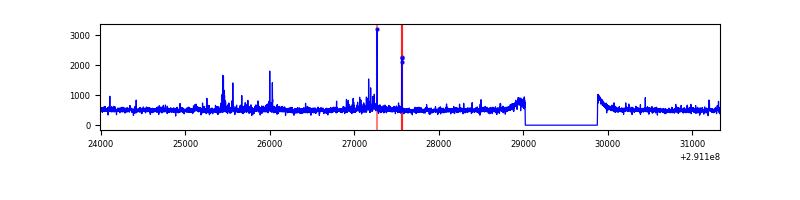 |
| C | 7336 | 6482 | 9 | 9 | 0.12% | 0.14% | 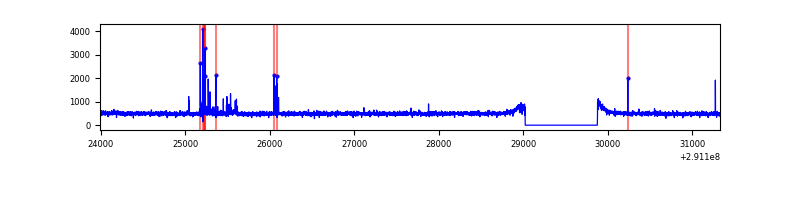 |
| D | 7335 | 6481 | 24 | 24 | 0.33% | 0.37% | 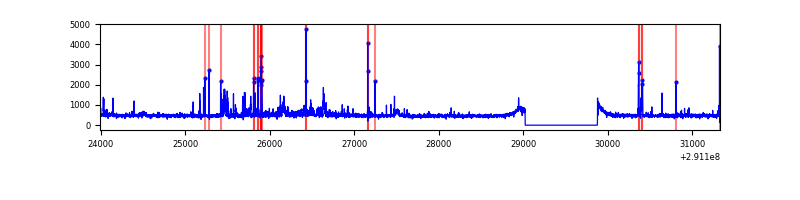 |
Top three noisy pixels from each quadrant. If the there are fewer than three noisy pixels in the level2.evt file, extra rows are filled as -1
| Pixel properties | Quadrant properties | ||||||
|---|---|---|---|---|---|---|---|
| Quadrant | DetID | PixID | Counts | Sigma | Mean | Median | Sigma |
| A | 0 | 254 | 12379 | 68.58 | 833 | 815 | 168.6 |
| A | 11 | 29 | 10258 | 56.0 | 833 | 815 | 168.6 |
| A | 13 | 254 | 9810 | 53.34 | 833 | 815 | 168.6 |
| B | 7 | 220 | 35344 | 219.13 | 825 | 806 | 157.6 |
| B | 0 | 229 | 26037 | 160.08 | 825 | 806 | 157.6 |
| B | 6 | 36 | 25259 | 155.15 | 825 | 806 | 157.6 |
| C | 14 | 238 | 124001 | 666.21 | 788 | 793 | 184.9 |
| C | 0 | 207 | 47487 | 252.48 | 788 | 793 | 184.9 |
| C | 3 | 233 | 42381 | 224.87 | 788 | 793 | 184.9 |
| D | 1 | 20 | 118378 | 600.07 | 804 | 781 | 196.0 |
| D | 1 | 52 | 76216 | 384.93 | 804 | 781 | 196.0 |
| D | 12 | 1 | 72834 | 367.67 | 804 | 781 | 196.0 |
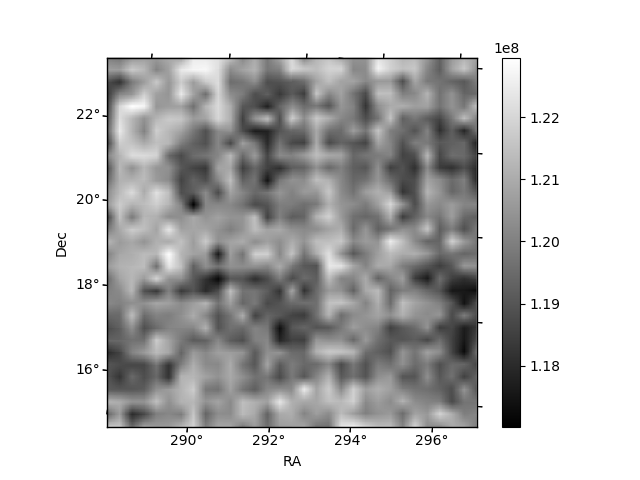
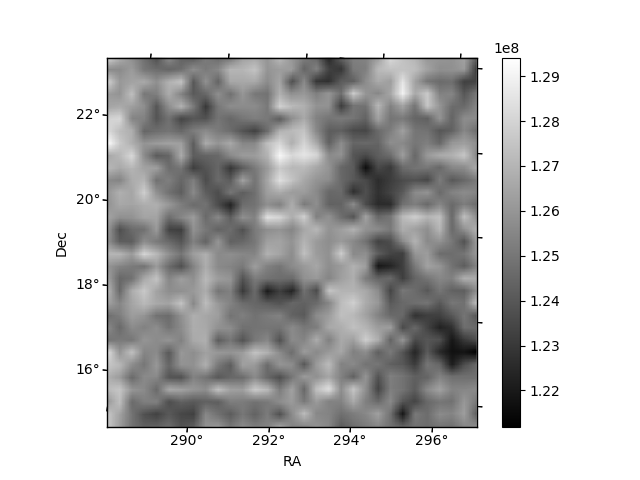
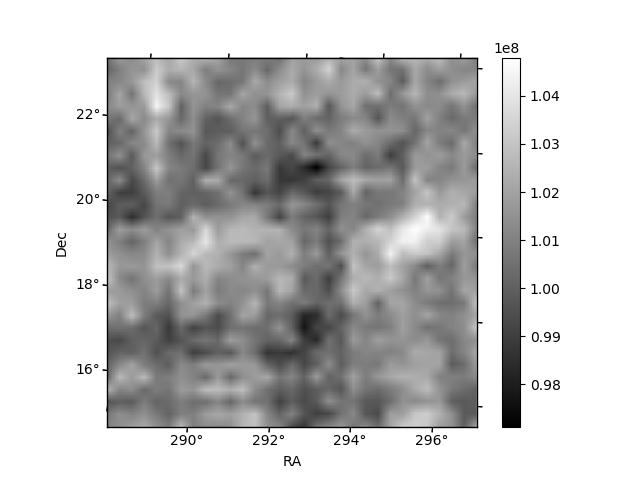
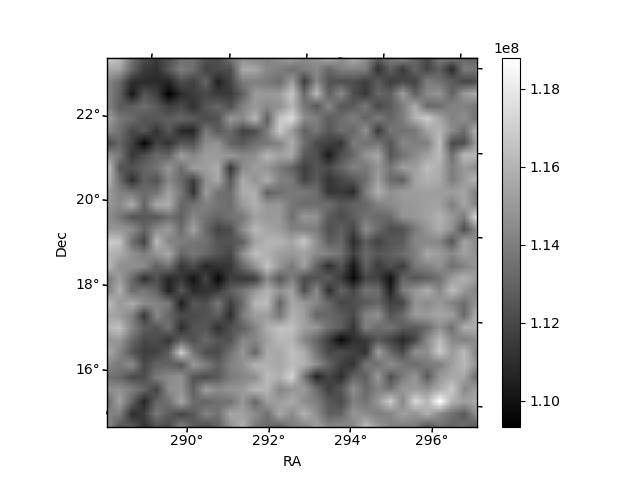
Histogram calculated using DETX and DETY for each event in the final _common_clean file
| Quadrant A | 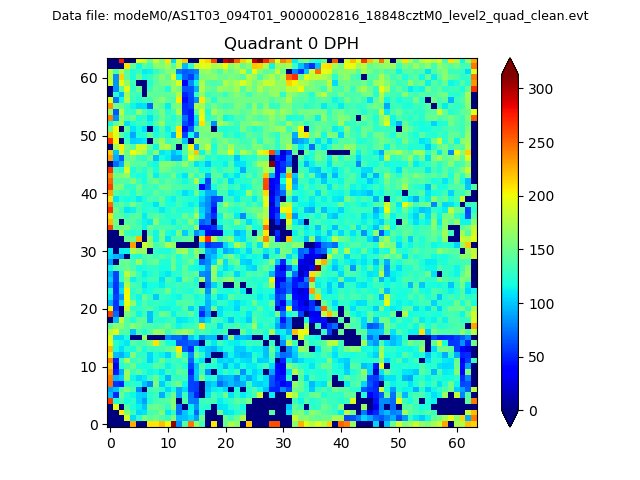 |
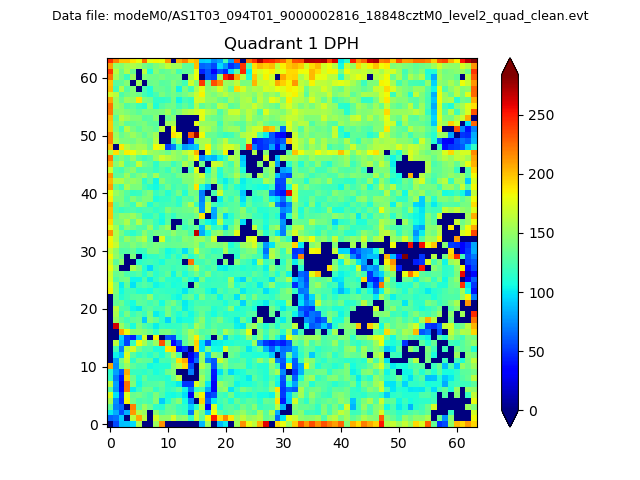 |
Quadrant B |
|---|---|---|---|
| Quadrant D | 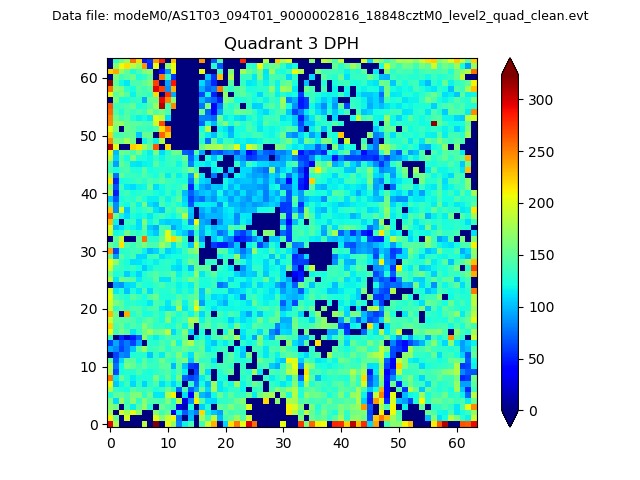 |
 |
Quadrant C |
| Plot type | Count rate plots | Images |
|---|---|---|
| Comparison with Poisson distribution Blue bars denote a histogram of data divided into 1 sec bins. Red curve is a Poisson curve with rate = median count rate of data. |
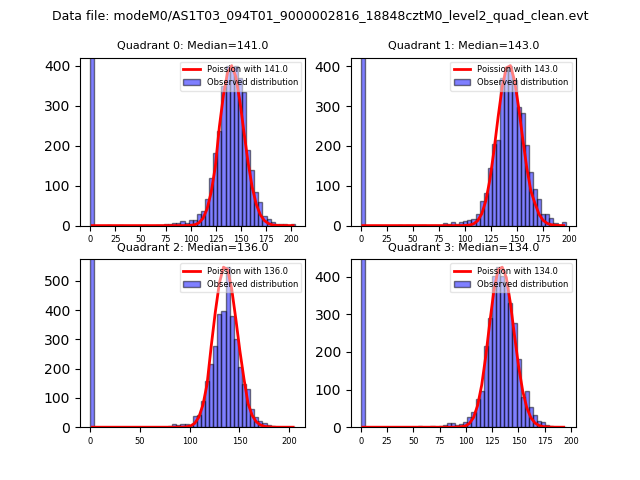 |
 |
| Quadrant-wise count rates Data is divided into 100 sec bins |
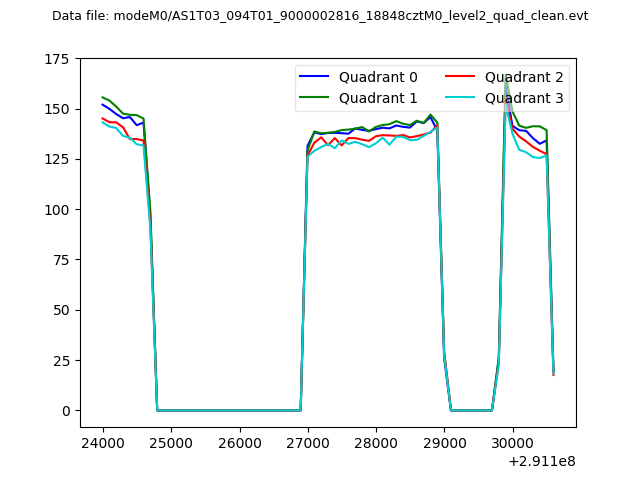 |
|
| Module-wise count rates for Quadrant A Data is divided into 100 sec bins |
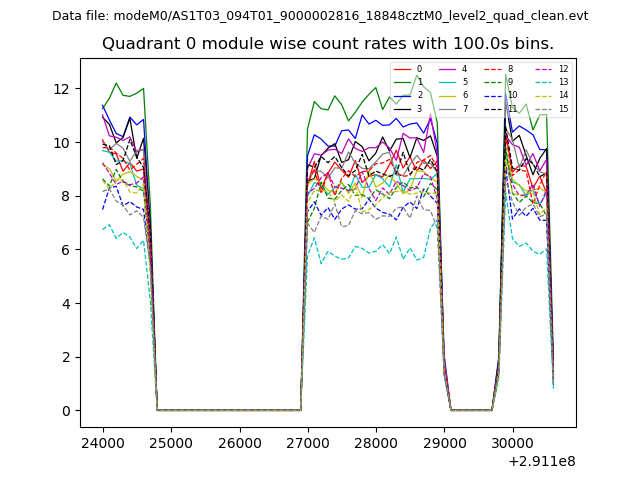 |
 |
| Module-wise count rates for Quadrant B Data is divided into 100 sec bins |
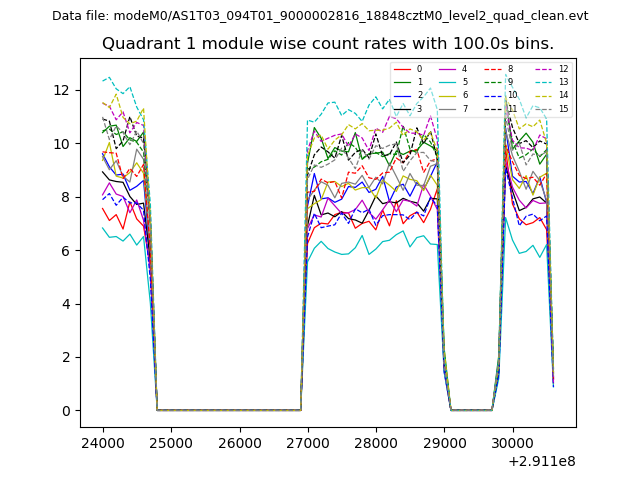 |
 |
| Module-wise count rates for Quadrant C Data is divided into 100 sec bins |
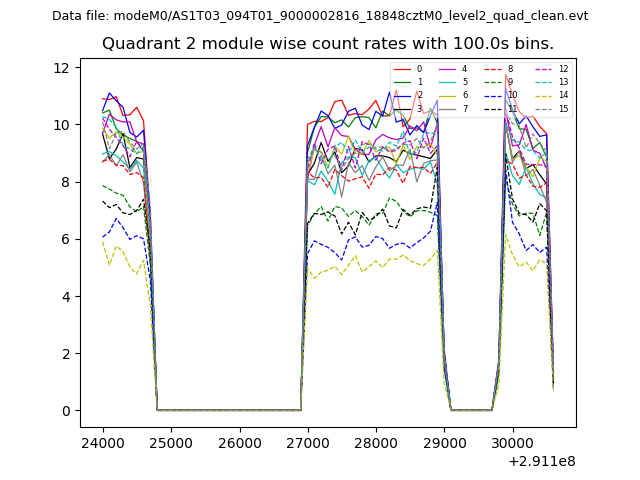 |
 |
| Module-wise count rates for Quadrant D Data is divided into 100 sec bins |
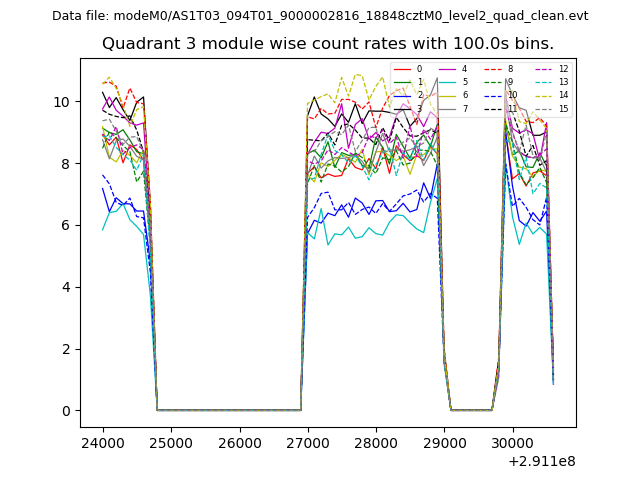 |
 |
| Parameter | Plot |
|---|---|
| CZT HV Monitor | 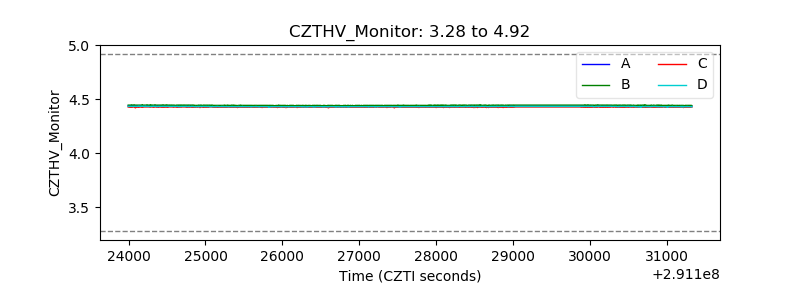 |
| D_VDD | 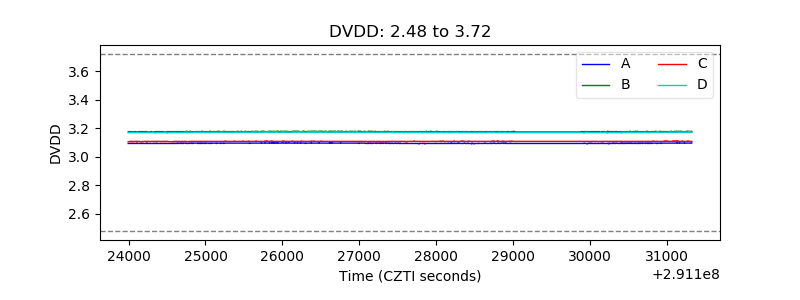 |
| Temperature 1 | 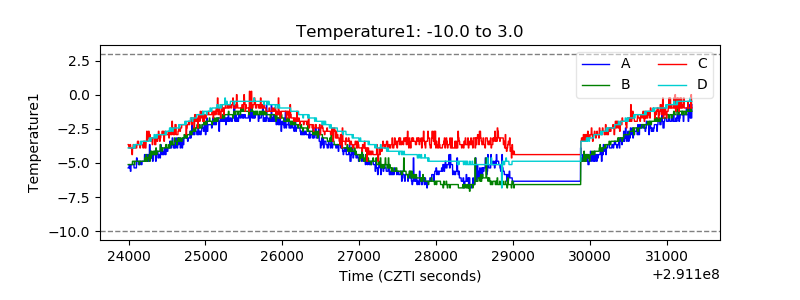 |
| Veto HV Monitor | 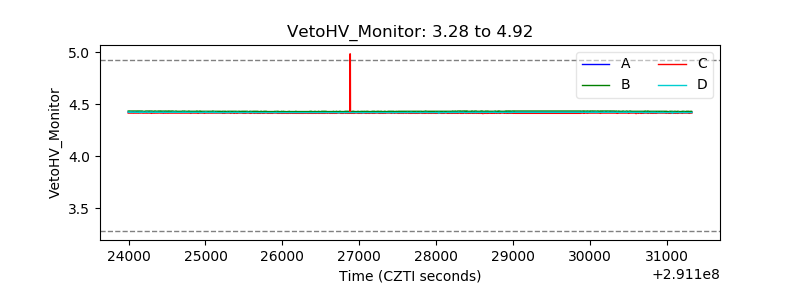 |
| Veto LLD | 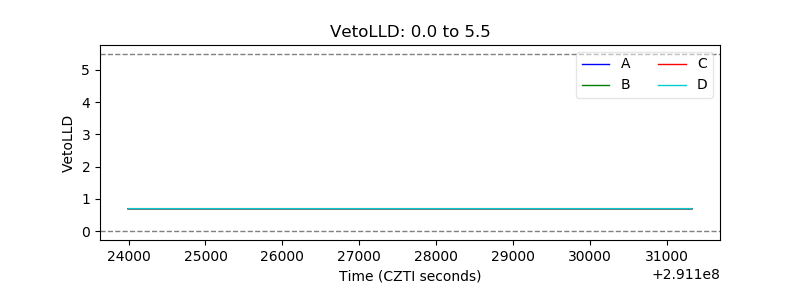 |
| Alpha Counter | 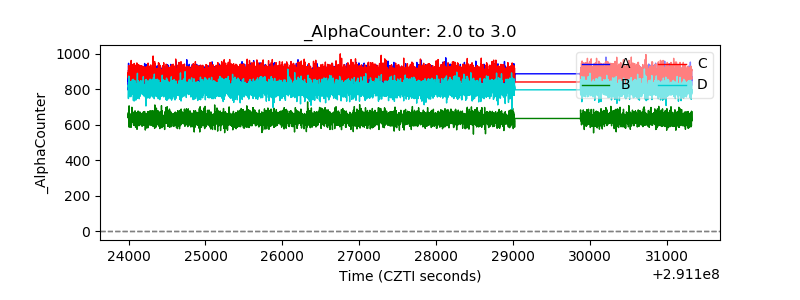 |
| _CPM_Rate | 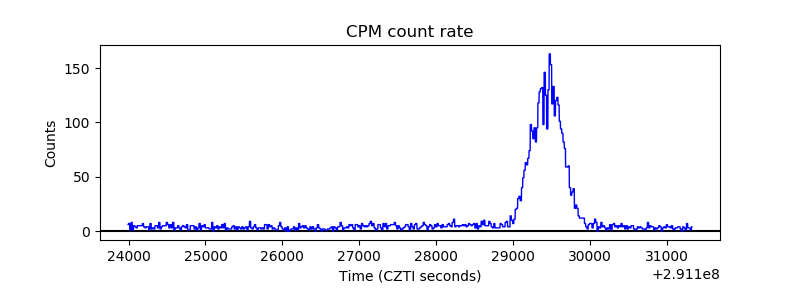 |
| CZT Counter | 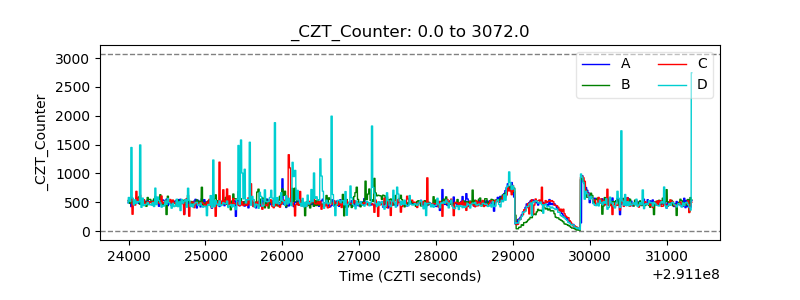 |
| +2.5 Volts monitor |  |
| +5 Volts monitor |  |
| _ROLL_ROT | 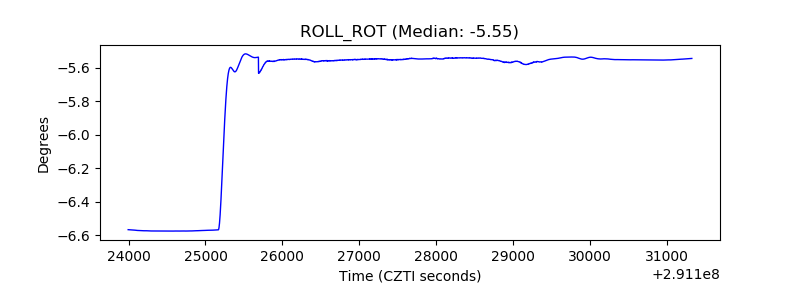 |
| _Roll_DEC | 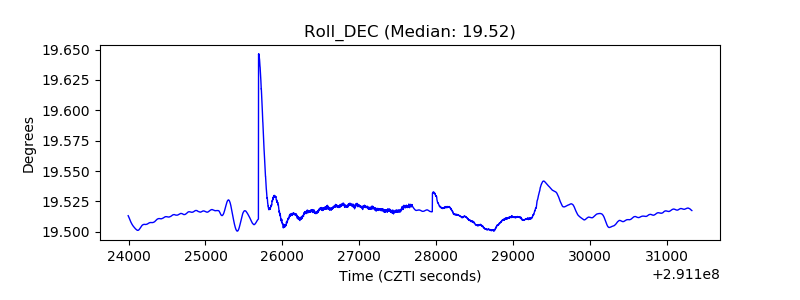 |
| _Roll_RA |  |
| Veto Counter | 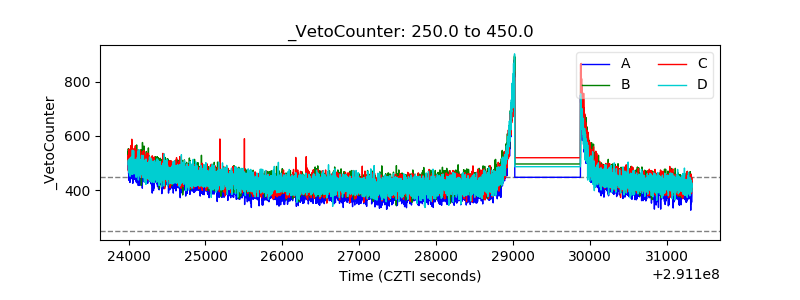 |