| Param | Original file | Final file |
|---|---|---|
| Filename | modeM0/AS1T03_094T01_9000002816_18849cztM0_level2.evt | modeM0/AS1T03_094T01_9000002816_18849cztM0_level2_quad_clean.evt |
| Size (bytes) | 538,133,760 | 81,218,880 |
| Size | 513.2 MB | 77.5 MB |
| Events in quadrant A | 3,819,306 | 497,868 |
| Events in quadrant B | 3,909,522 | 503,350 |
| Events in quadrant C | 3,612,865 | 482,593 |
| Events in quadrant D | 4,464,908 | 471,834 |
| Mode M9 | |||
|---|---|---|---|
| Quadrant | BADHDUFLAG | Total packets | Discarded packets |
| A | 0 | 5 | 0 |
| B | 0 | 5 | 0 |
| C | 0 | 5 | 0 |
| D | 0 | 5 | 0 |
| Mode SS | |||
|---|---|---|---|
| Quadrant | BADHDUFLAG | Total packets | Discarded packets |
| A | 0 | 146 | 0 |
| B | 0 | 146 | 0 |
| C | 0 | 146 | 0 |
| D | 0 | 146 | 0 |
| Mode M0 | |||
|---|---|---|---|
| Quadrant | BADHDUFLAG | Total packets | Discarded packets |
| A | 0 | 15762 | 2 |
| B | 0 | 15911 | 1 |
| C | 0 | 15086 | 1 |
| D | 0 | 17930 | 1 |
| Quadrant | Total seconds | Saturated seconds | Saturation percentage |
|---|---|---|---|
| A | 7232 | 128 | 1.769912% |
| B | 7233 | 170 | 2.350339% |
| C | 7233 | 162 | 2.239735% |
| D | 7233 | 333 | 4.603899% |
Noise dominated data is calculated using 1-second bins in cleaned event files. If a bin has >2000 counts, and if more than 50% of those come from <1% of pixels, then it is considered to be noise-dominated and hence unusable.
| Quadrant | # 1 sec bins | Bins with >0 counts | Bins with >2000 counts | High rate bins dominated by noise | Noise dominated (total time) | Noise dominated (detector-on time) | Marked lightcurve |
|---|---|---|---|---|---|---|---|
| A | 7692 | 7233 | 2 | 2 | 0.03% | 0.03% | 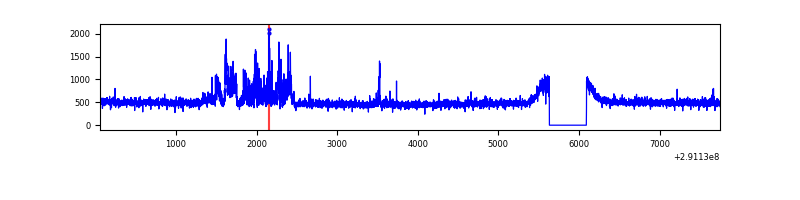 |
| B | 7693 | 7234 | 18 | 18 | 0.23% | 0.25% | 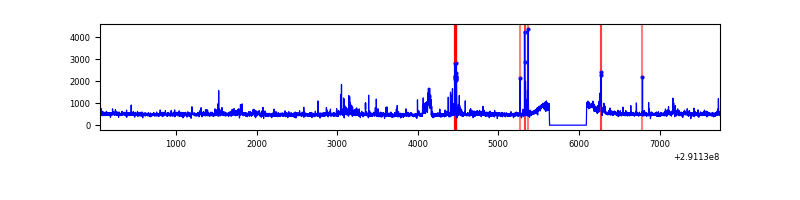 |
| C | 7693 | 7234 | 6 | 6 | 0.08% | 0.08% | 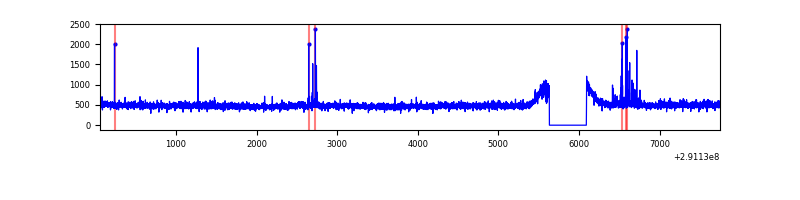 |
| D | 7693 | 7234 | 157 | 157 | 2.04% | 2.17% | 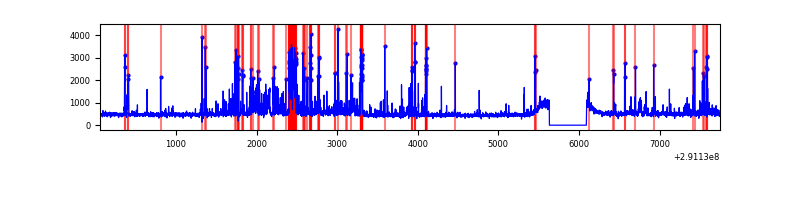 |
Top three noisy pixels from each quadrant. If the there are fewer than three noisy pixels in the level2.evt file, extra rows are filled as -1
| Pixel properties | Quadrant properties | ||||||
|---|---|---|---|---|---|---|---|
| Quadrant | DetID | PixID | Counts | Sigma | Mean | Median | Sigma |
| A | 6 | 16 | 277105 | 1485.66 | 912 | 891 | 185.9 |
| A | 4 | 2 | 15685 | 79.57 | 912 | 891 | 185.9 |
| A | 13 | 254 | 11554 | 57.35 | 912 | 891 | 185.9 |
| B | 10 | 245 | 151898 | 854.37 | 906 | 884 | 176.8 |
| B | 0 | 229 | 87282 | 488.8 | 906 | 884 | 176.8 |
| B | 5 | 250 | 25385 | 138.62 | 906 | 884 | 176.8 |
| C | 14 | 238 | 134349 | 650.61 | 869 | 874 | 205.2 |
| C | 0 | 207 | 49304 | 236.07 | 869 | 874 | 205.2 |
| C | 3 | 233 | 34133 | 162.12 | 869 | 874 | 205.2 |
| D | 1 | 52 | 621523 | 2906.66 | 876 | 850 | 213.5 |
| D | 12 | 1 | 226254 | 1055.59 | 876 | 850 | 213.5 |
| D | 1 | 20 | 207776 | 969.05 | 876 | 850 | 213.5 |
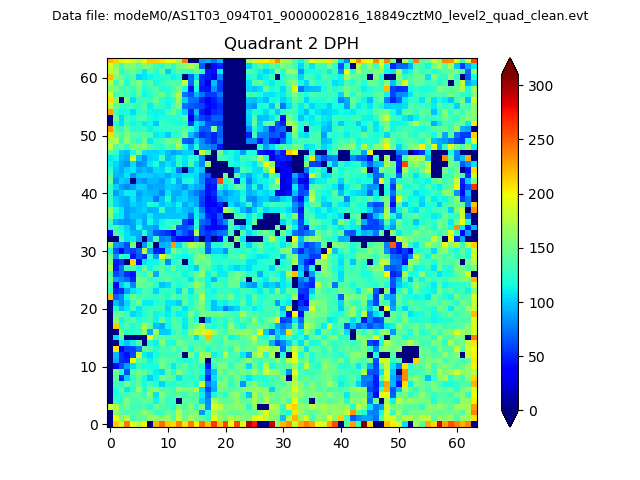
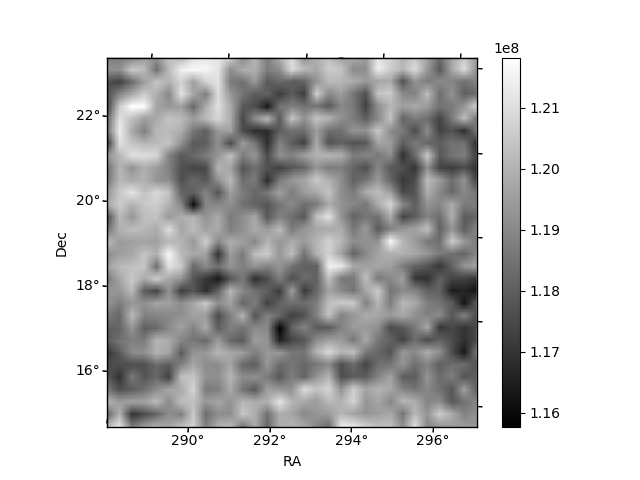
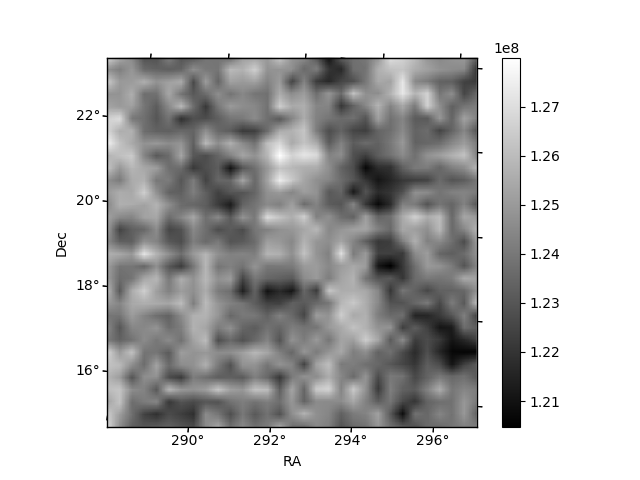
Histogram calculated using DETX and DETY for each event in the final _common_clean file
| Quadrant A |  |
 |
Quadrant B |
|---|---|---|---|
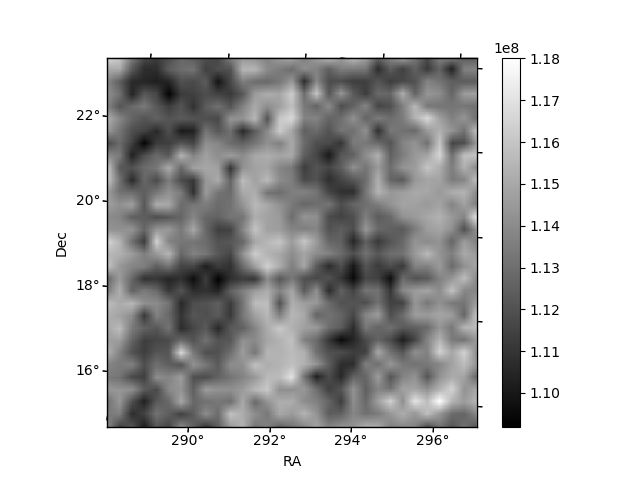
| Quadrant D |  |
 |
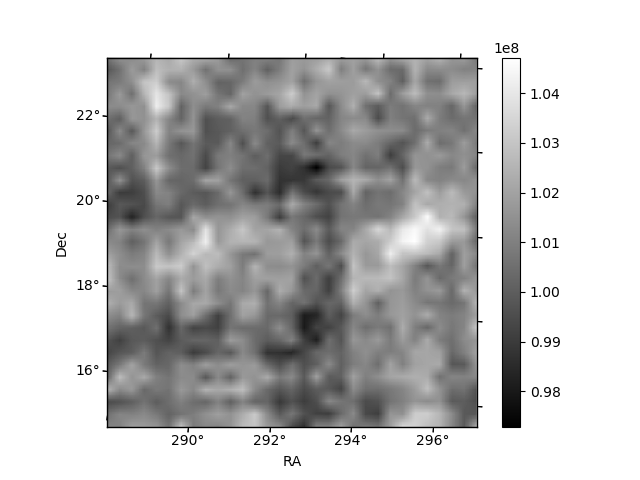
Quadrant C |
| Plot type | Count rate plots | Images |
|---|---|---|
| Comparison with Poisson distribution Blue bars denote a histogram of data divided into 1 sec bins. Red curve is a Poisson curve with rate = median count rate of data. |
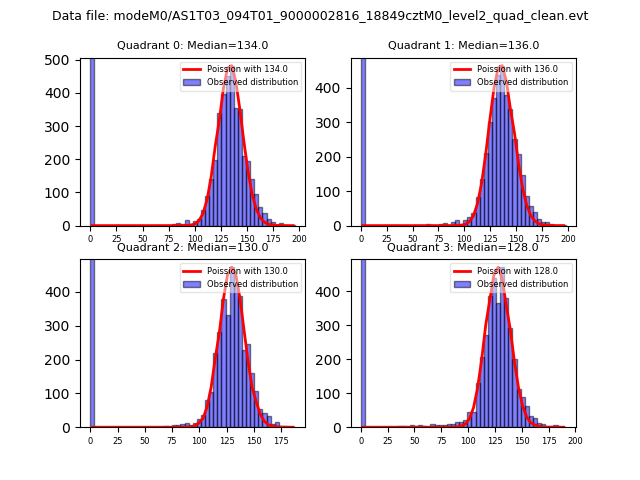 |
 |
| Quadrant-wise count rates Data is divided into 100 sec bins |
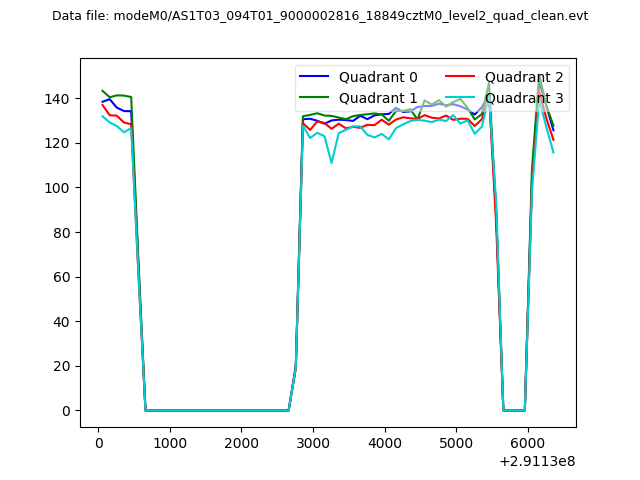 |
|
| Module-wise count rates for Quadrant A Data is divided into 100 sec bins |
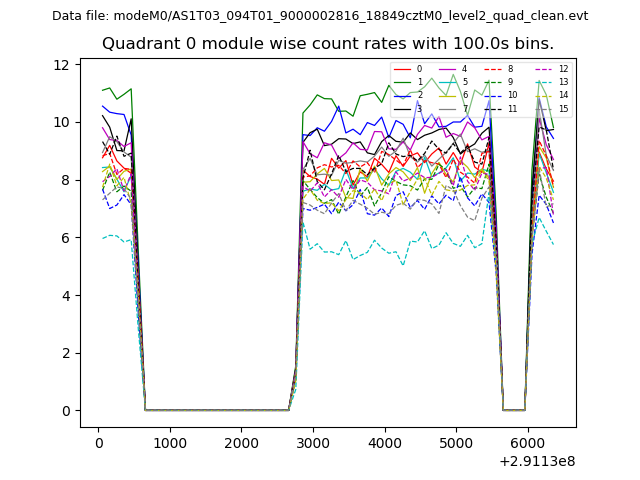 |
 |
| Module-wise count rates for Quadrant B Data is divided into 100 sec bins |
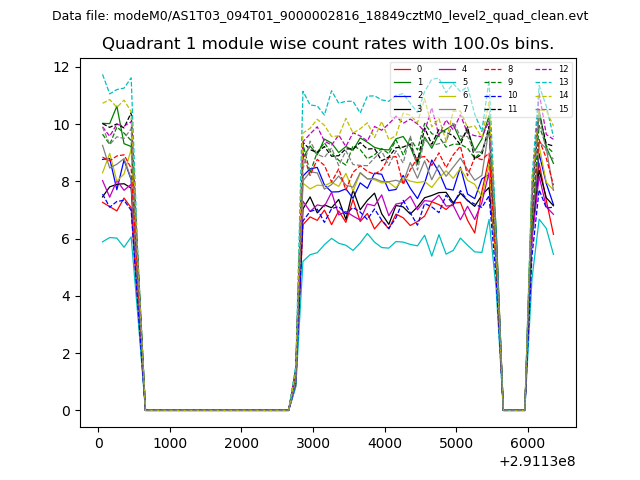 |
 |
| Module-wise count rates for Quadrant C Data is divided into 100 sec bins |
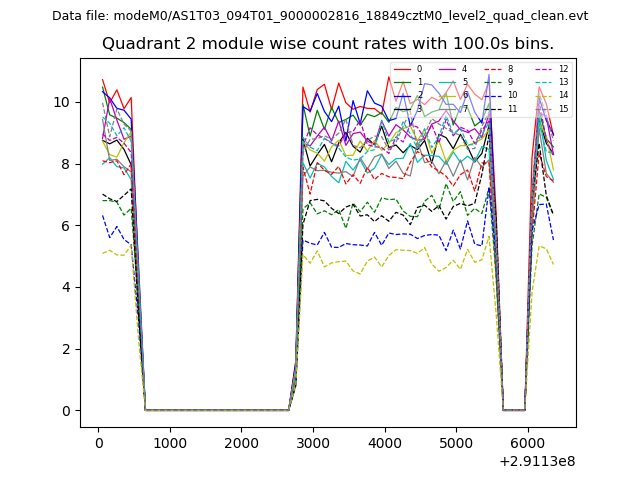 |
 |
| Module-wise count rates for Quadrant D Data is divided into 100 sec bins |
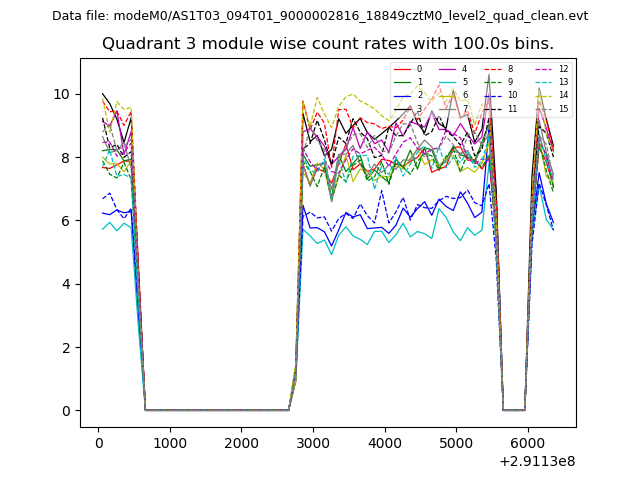 |
 |
| Parameter | Plot |
|---|---|
| CZT HV Monitor | 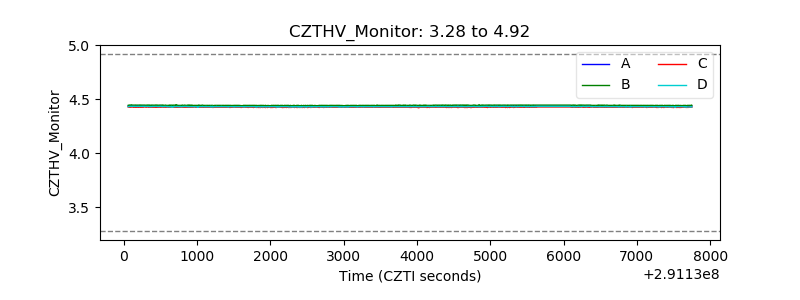 |
| D_VDD | 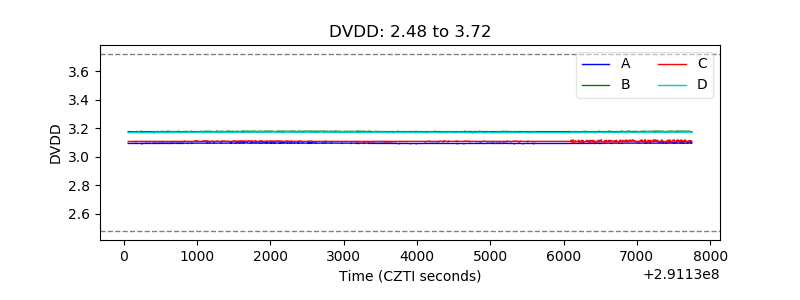 |
| Temperature 1 | 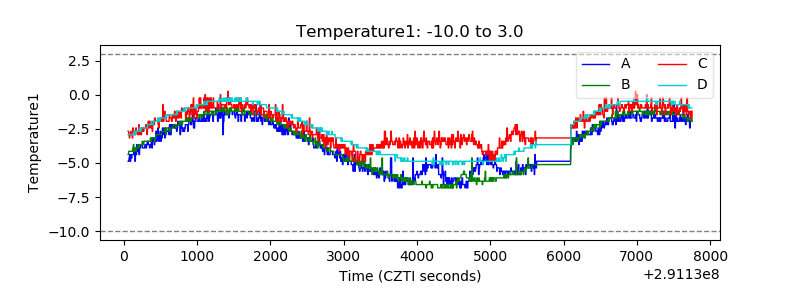 |
| Veto HV Monitor |  |
| Veto LLD | 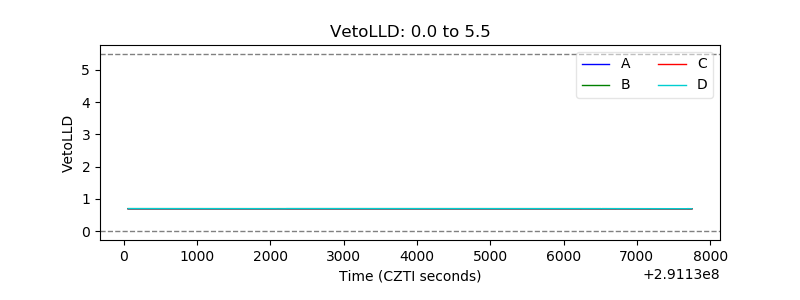 |
| Alpha Counter | 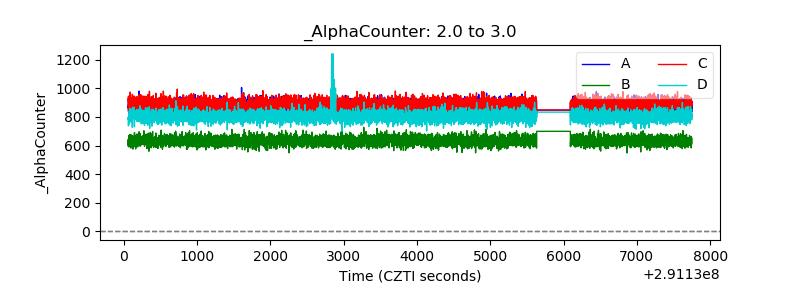 |
| _CPM_Rate | 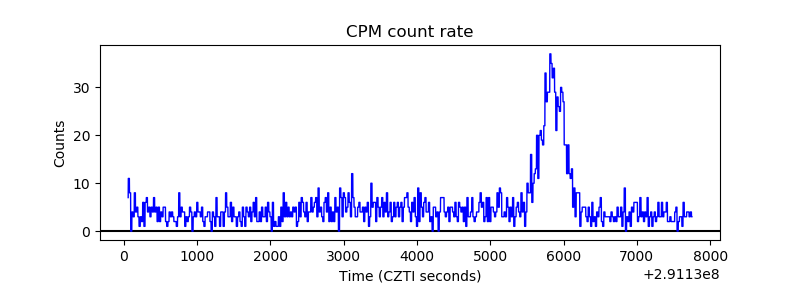 |
| CZT Counter |  |
| +2.5 Volts monitor |  |
| +5 Volts monitor |  |
| _ROLL_ROT | 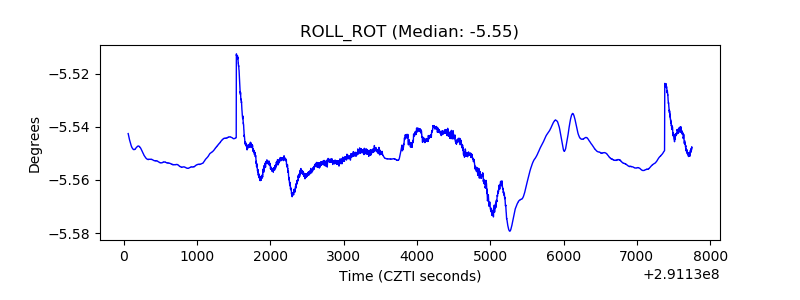 |
| _Roll_DEC | 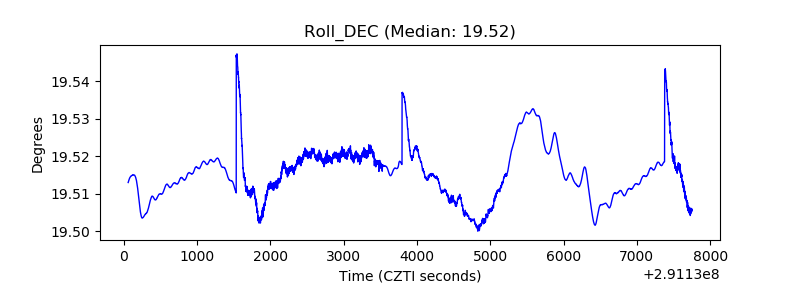 |
| _Roll_RA | 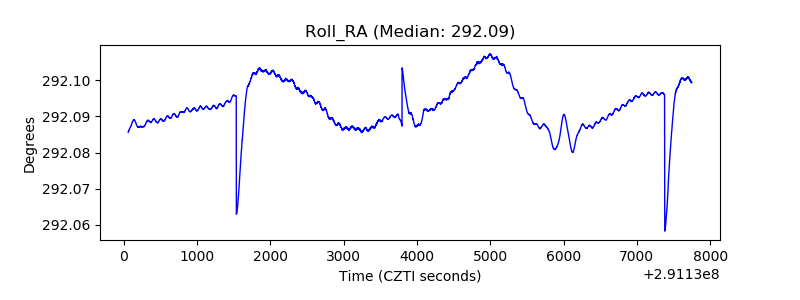 |
| Veto Counter | 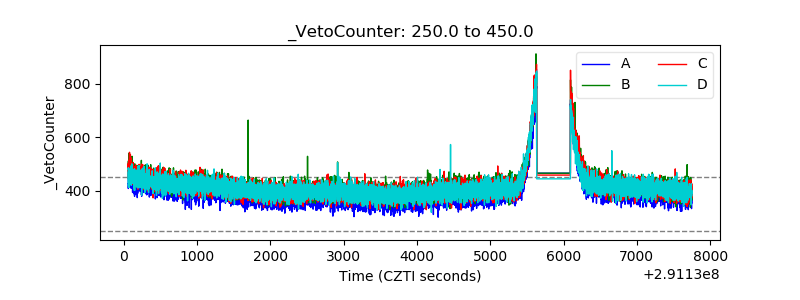 |