| Param | Original file | Final file |
|---|---|---|
| Filename | modeM0/AS1T03_094T01_9000002816_18851cztM0_level2.evt | modeM0/AS1T03_094T01_9000002816_18851cztM0_level2_quad_clean.evt |
| Size (bytes) | 552,646,080 | 80,709,120 |
| Size | 527.0 MB | 77.0 MB |
| Events in quadrant A | 3,819,217 | 484,727 |
| Events in quadrant B | 4,198,227 | 488,842 |
| Events in quadrant C | 3,890,097 | 471,774 |
| Events in quadrant D | 4,306,241 | 462,437 |
| Mode M9 | |||
|---|---|---|---|
| Quadrant | BADHDUFLAG | Total packets | Discarded packets |
| A | 0 | 6 | 0 |
| B | 0 | 6 | 0 |
| C | 0 | 6 | 0 |
| D | 0 | 6 | 0 |
| Mode SS | |||
|---|---|---|---|
| Quadrant | BADHDUFLAG | Total packets | Discarded packets |
| A | 0 | 158 | 0 |
| B | 0 | 158 | 0 |
| C | 0 | 158 | 0 |
| D | 0 | 158 | 0 |
| Mode M0 | |||
|---|---|---|---|
| Quadrant | BADHDUFLAG | Total packets | Discarded packets |
| A | 0 | 16193 | 2 |
| B | 0 | 17251 | 2 |
| C | 0 | 16309 | 2 |
| D | 0 | 17974 | 2 |
| Quadrant | Total seconds | Saturated seconds | Saturation percentage |
|---|---|---|---|
| A | 7709 | 194 | 2.516539% |
| B | 7709 | 251 | 3.255935% |
| C | 7709 | 266 | 3.450512% |
| D | 7709 | 229 | 2.970554% |
Noise dominated data is calculated using 1-second bins in cleaned event files. If a bin has >2000 counts, and if more than 50% of those come from <1% of pixels, then it is considered to be noise-dominated and hence unusable.
| Quadrant | # 1 sec bins | Bins with >0 counts | Bins with >2000 counts | High rate bins dominated by noise | Noise dominated (total time) | Noise dominated (detector-on time) | Marked lightcurve |
|---|---|---|---|---|---|---|---|
| A | 8279 | 7711 | 0 | 0 | 0.00% | 0.00% | 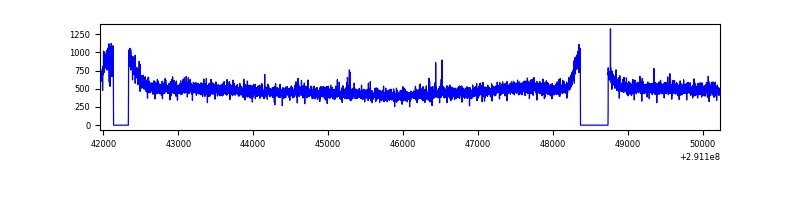 |
| B | 8279 | 7711 | 30 | 30 | 0.36% | 0.39% | 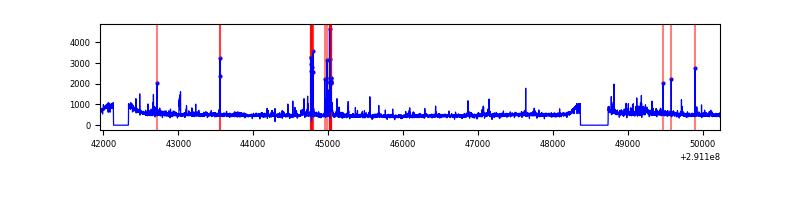 |
| C | 8279 | 7711 | 1 | 1 | 0.01% | 0.01% | 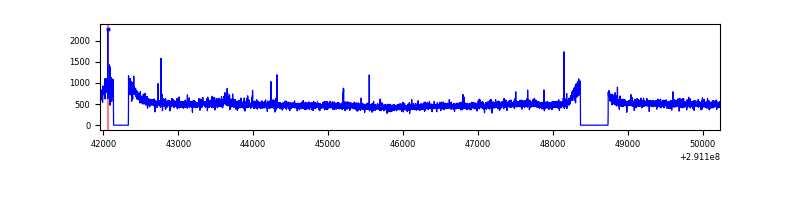 |
| D | 8279 | 7711 | 28 | 28 | 0.34% | 0.36% | 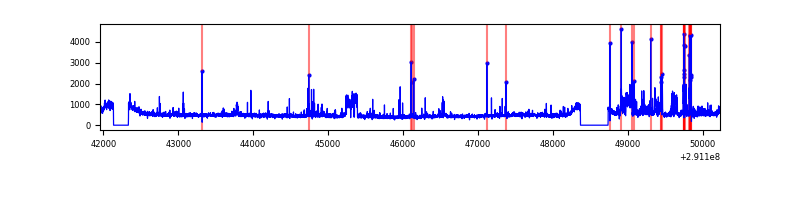 |
Top three noisy pixels from each quadrant. If the there are fewer than three noisy pixels in the level2.evt file, extra rows are filled as -1
| Pixel properties | Quadrant properties | ||||||
|---|---|---|---|---|---|---|---|
| Quadrant | DetID | PixID | Counts | Sigma | Mean | Median | Sigma |
| A | 13 | 254 | 13126 | 60.57 | 984 | 963 | 200.8 |
| A | 15 | 191 | 10046 | 45.23 | 984 | 963 | 200.8 |
| A | 0 | 226 | 8838 | 39.22 | 984 | 963 | 200.8 |
| B | 7 | 220 | 113168 | 589.03 | 976 | 951 | 190.5 |
| B | 10 | 245 | 76165 | 394.8 | 976 | 951 | 190.5 |
| B | 4 | 216 | 74291 | 384.96 | 976 | 951 | 190.5 |
| C | 14 | 238 | 144003 | 644.03 | 938 | 941 | 222.1 |
| C | 3 | 233 | 64831 | 287.62 | 938 | 941 | 222.1 |
| C | 5 | 112 | 13869 | 58.2 | 938 | 941 | 222.1 |
| D | 1 | 52 | 226813 | 951.14 | 959 | 929 | 237.5 |
| D | 1 | 20 | 212711 | 891.76 | 959 | 929 | 237.5 |
| D | 14 | 34 | 139939 | 585.34 | 959 | 929 | 237.5 |
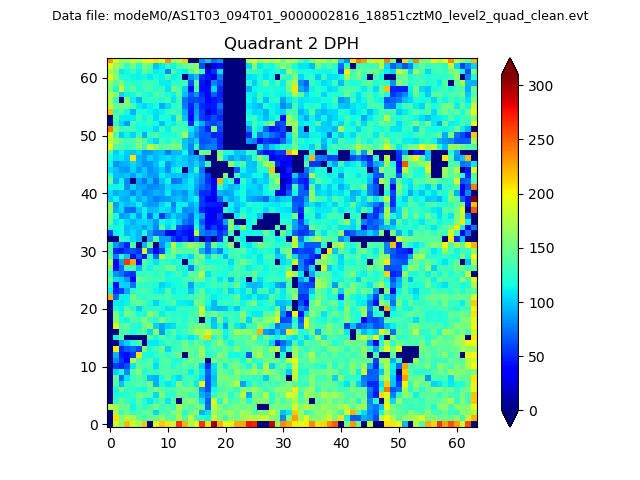
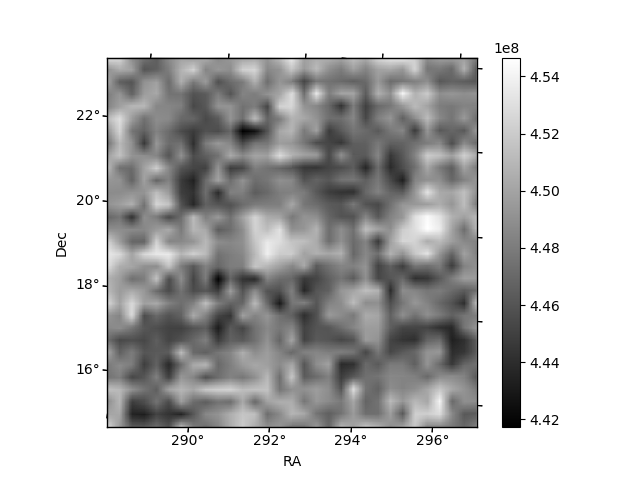
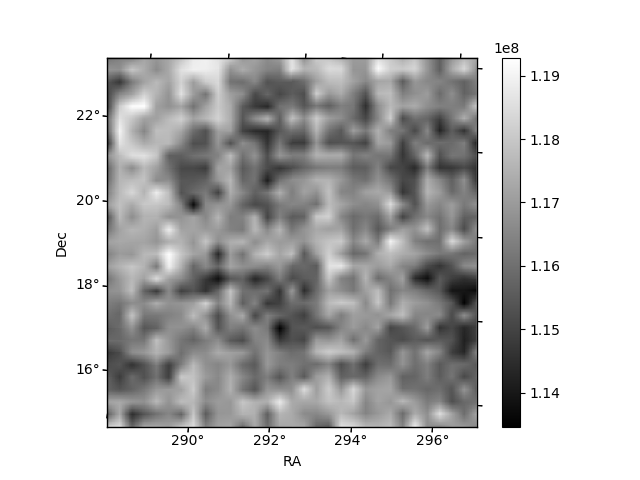
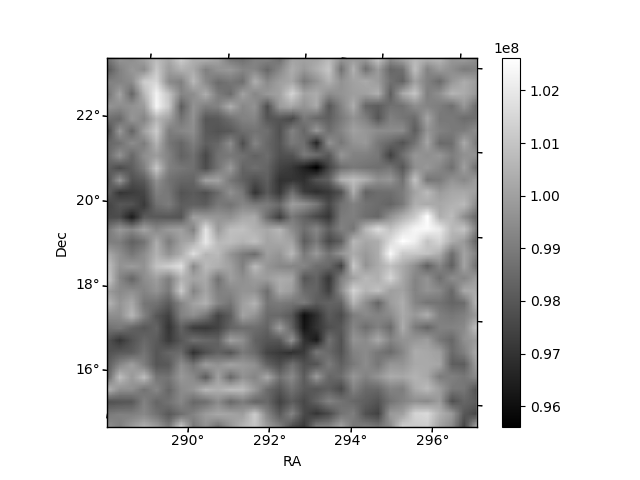
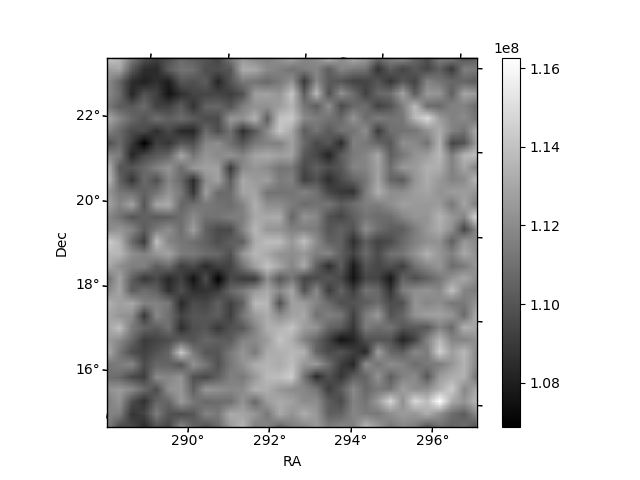
Histogram calculated using DETX and DETY for each event in the final _common_clean file
| Quadrant A | 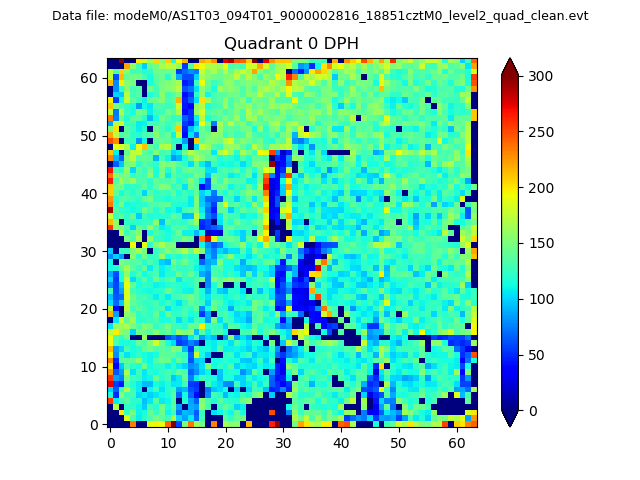 |
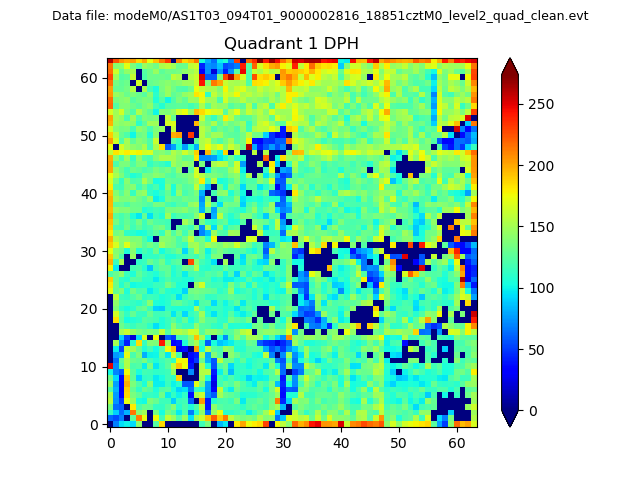 |
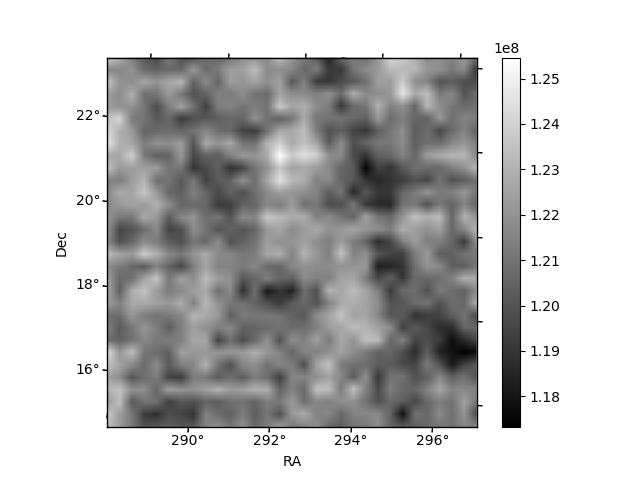
Quadrant B |
|---|---|---|---|
| Quadrant D | 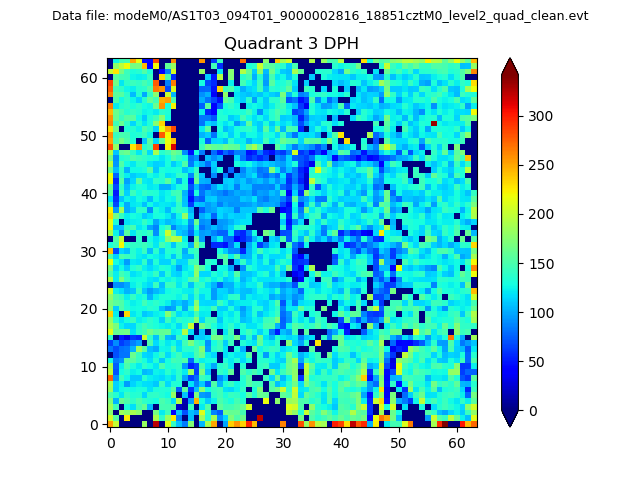 |
 |
Quadrant C |
| Plot type | Count rate plots | Images |
|---|---|---|
| Comparison with Poisson distribution Blue bars denote a histogram of data divided into 1 sec bins. Red curve is a Poisson curve with rate = median count rate of data. |
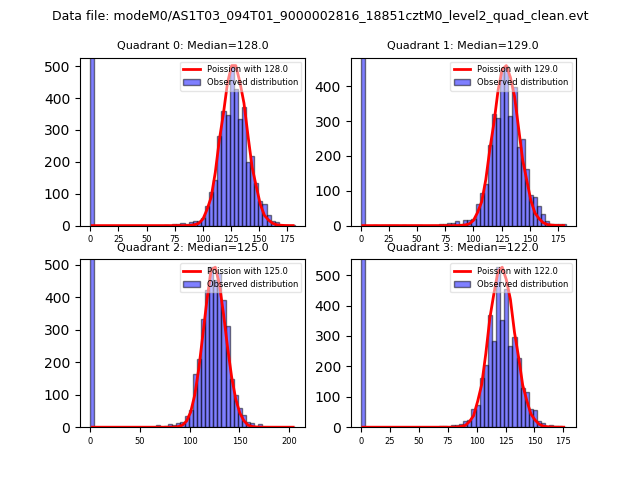 |
 |
| Quadrant-wise count rates Data is divided into 100 sec bins |
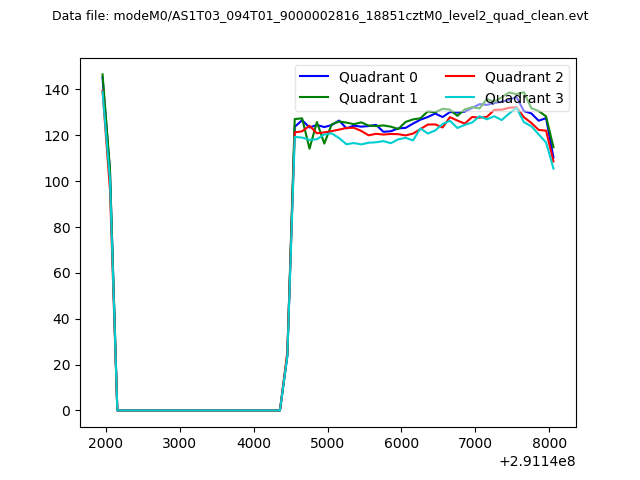 |
|
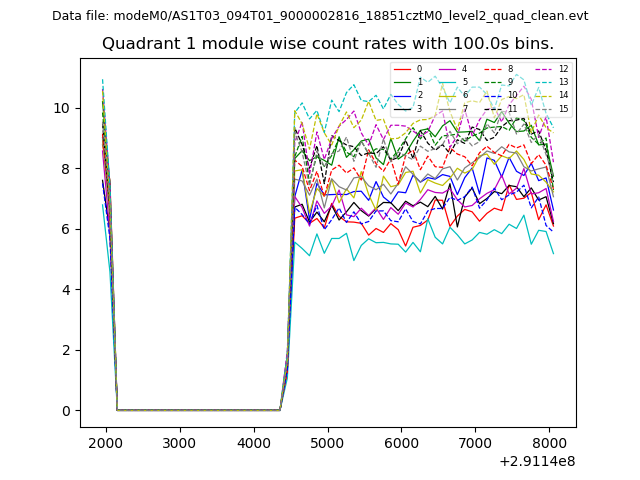
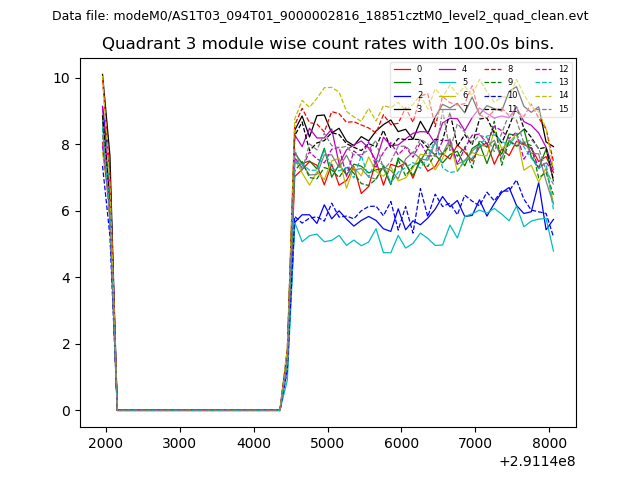
| Module-wise count rates for Quadrant A Data is divided into 100 sec bins |
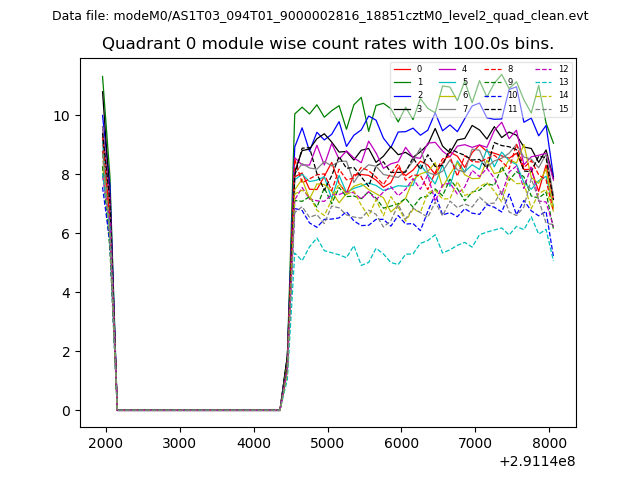 |
 |
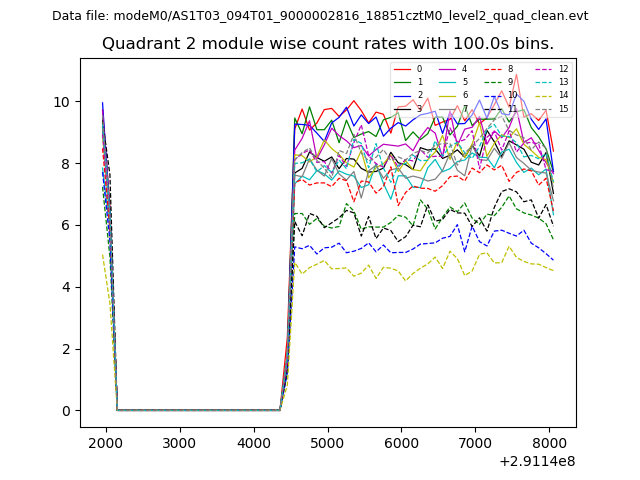
| Module-wise count rates for Quadrant B Data is divided into 100 sec bins |
 |
 |
| Module-wise count rates for Quadrant C Data is divided into 100 sec bins |
 |
 |
| Module-wise count rates for Quadrant D Data is divided into 100 sec bins |
 |
 |
| Parameter | Plot |
|---|---|
| CZT HV Monitor | 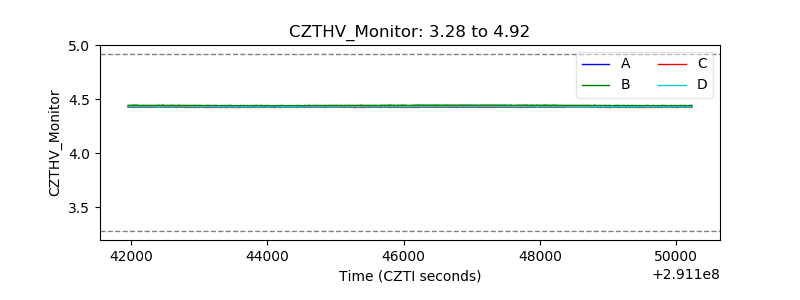 |
| D_VDD | 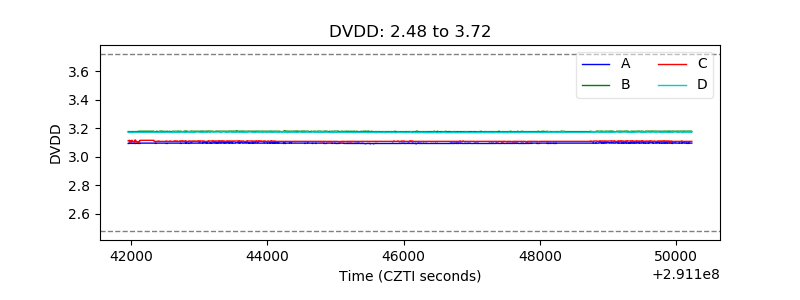 |
| Temperature 1 | 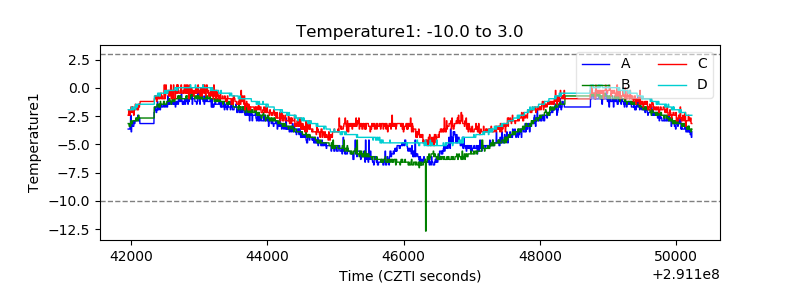 |
| Veto HV Monitor |  |
| Veto LLD | 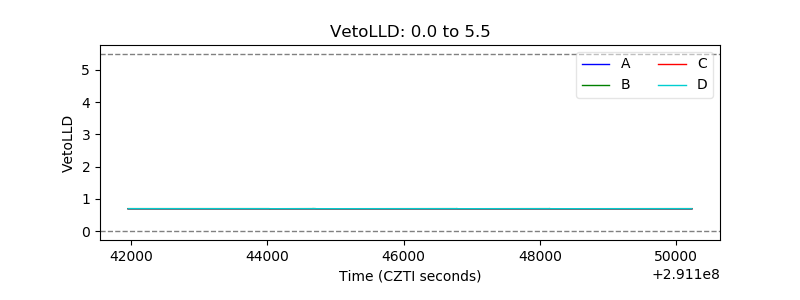 |
| Alpha Counter | 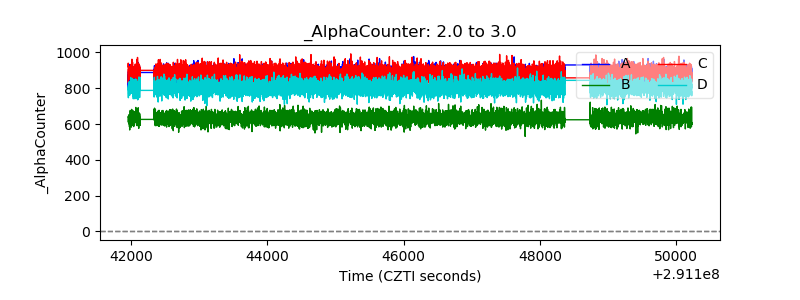 |
| _CPM_Rate |  |
| CZT Counter | 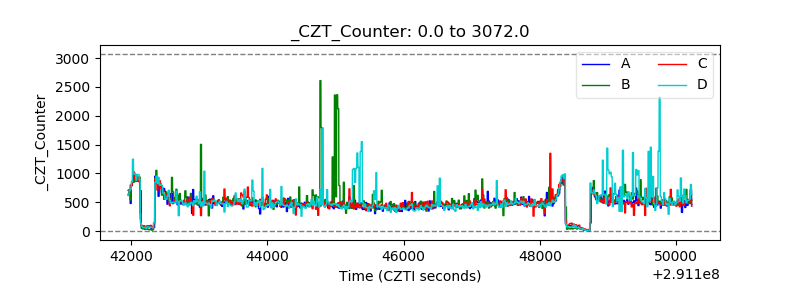 |
| +2.5 Volts monitor | 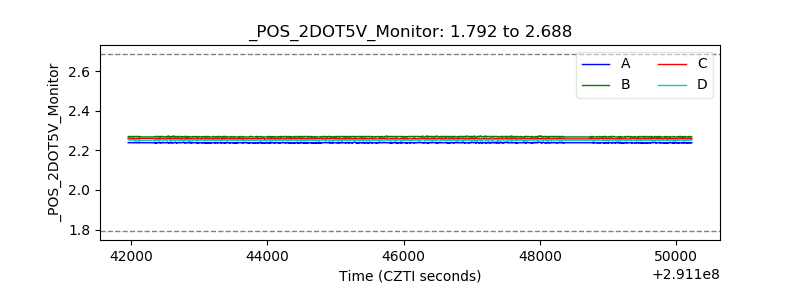 |
| +5 Volts monitor |  |
| _ROLL_ROT | 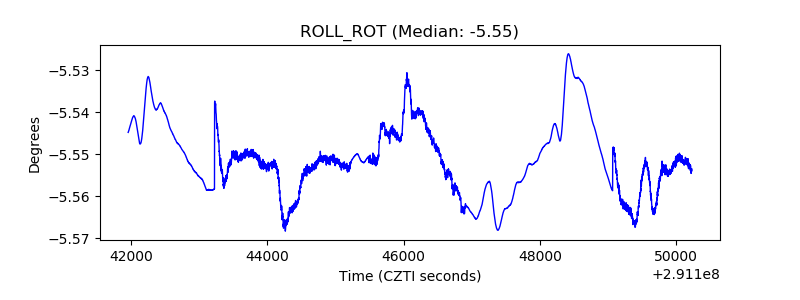 |
| _Roll_DEC | 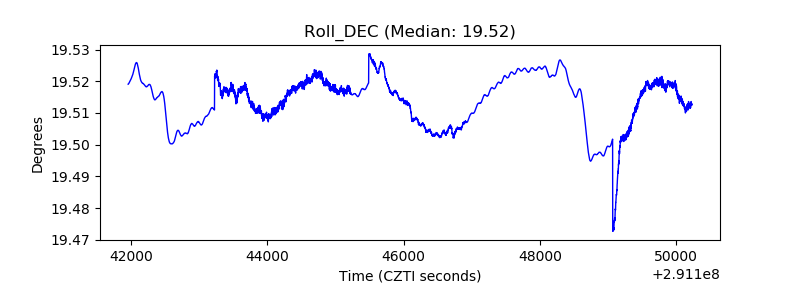 |
| _Roll_RA | 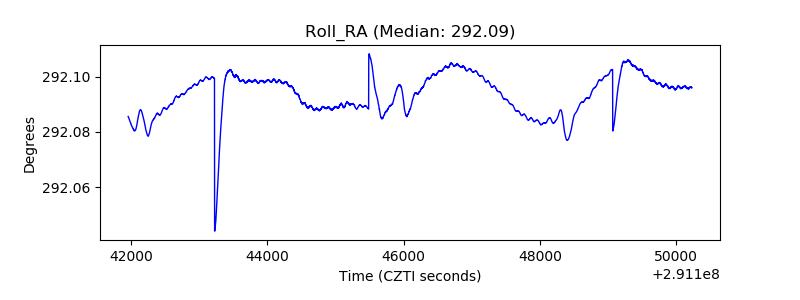 |
| Veto Counter | 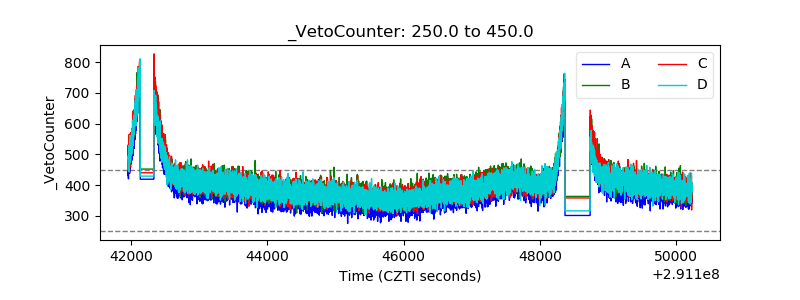 |