| Param | Original file | Final file |
|---|---|---|
| Filename | modeM0/AS1T03_094T01_9000002816_18855cztM0_level2.evt | modeM0/AS1T03_094T01_9000002816_18855cztM0_level2_quad_clean.evt |
| Size (bytes) | 1,646,167,680 | 310,884,480 |
| Size | 1.5 GB | 296.5 MB |
| Events in quadrant A | 10,860,650 | 1,992,885 |
| Events in quadrant B | 11,625,359 | 2,017,698 |
| Events in quadrant C | 11,230,373 | 1,941,528 |
| Events in quadrant D | 14,585,205 | 1,882,685 |
| Mode M9 | |||
|---|---|---|---|
| Quadrant | BADHDUFLAG | Total packets | Discarded packets |
| A | 0 | 30 | 0 |
| B | 0 | 30 | 0 |
| C | 0 | 30 | 0 |
| D | 0 | 30 | 0 |
| Mode SS | |||
|---|---|---|---|
| Quadrant | BADHDUFLAG | Total packets | Discarded packets |
| A | 0 | 468 | 0 |
| B | 0 | 468 | 0 |
| C | 0 | 468 | 0 |
| D | 0 | 468 | 0 |
| Mode M0 | |||
|---|---|---|---|
| Quadrant | BADHDUFLAG | Total packets | Discarded packets |
| A | 0 | 47339 | 4 |
| B | 0 | 49718 | 4 |
| C | 0 | 47935 | 4 |
| D | 0 | 59128 | 4 |
| Quadrant | Total seconds | Saturated seconds | Saturation percentage |
|---|---|---|---|
| A | 22981 | 146 | 0.635307% |
| B | 22982 | 302 | 1.314072% |
| C | 22982 | 283 | 1.231398% |
| D | 22982 | 1276 | 5.552171% |
Noise dominated data is calculated using 1-second bins in cleaned event files. If a bin has >2000 counts, and if more than 50% of those come from <1% of pixels, then it is considered to be noise-dominated and hence unusable.
| Quadrant | # 1 sec bins | Bins with >0 counts | Bins with >2000 counts | High rate bins dominated by noise | Noise dominated (total time) | Noise dominated (detector-on time) | Marked lightcurve |
|---|---|---|---|---|---|---|---|
| A | 26016 | 22985 | 8 | 8 | 0.03% | 0.03% | 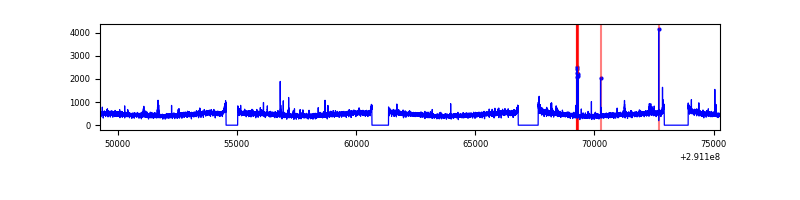 |
| B | 26017 | 22986 | 36 | 36 | 0.14% | 0.16% | 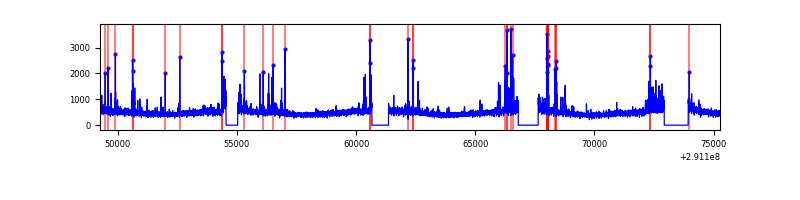 |
| C | 26017 | 22986 | 2 | 2 | 0.01% | 0.01% | 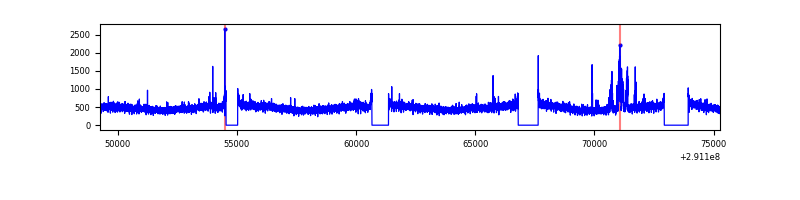 |
| D | 26017 | 22986 | 890 | 890 | 3.42% | 3.87% | 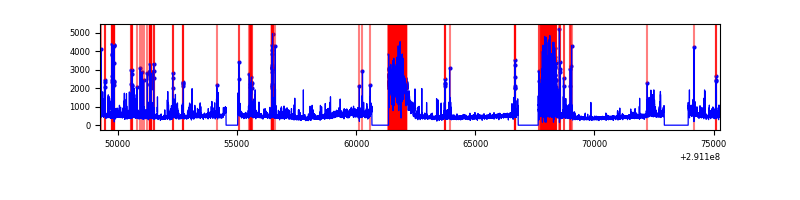 |
Top three noisy pixels from each quadrant. If the there are fewer than three noisy pixels in the level2.evt file, extra rows are filled as -1
| Pixel properties | Quadrant properties | ||||||
|---|---|---|---|---|---|---|---|
| Quadrant | DetID | PixID | Counts | Sigma | Mean | Median | Sigma |
| A | 9 | 143 | 85573 | 147.49 | 2780 | 2719 | 561.8 |
| A | 4 | 2 | 47725 | 80.11 | 2780 | 2719 | 561.8 |
| A | 13 | 254 | 38672 | 64.0 | 2780 | 2719 | 561.8 |
| B | 7 | 220 | 353863 | 666.12 | 2778 | 2707 | 527.2 |
| B | 4 | 216 | 98869 | 182.41 | 2778 | 2707 | 527.2 |
| B | 12 | 111 | 62313 | 113.07 | 2778 | 2707 | 527.2 |
| C | 14 | 238 | 413091 | 658.32 | 2664 | 2682 | 623.4 |
| C | 3 | 233 | 379462 | 604.37 | 2664 | 2682 | 623.4 |
| C | 0 | 207 | 29108 | 42.39 | 2664 | 2682 | 623.4 |
| D | 7 | 38 | 1789609 | 2792.37 | 2630 | 2558 | 640.0 |
| D | 9 | 1 | 1031389 | 1607.61 | 2630 | 2558 | 640.0 |
| D | 1 | 52 | 961339 | 1498.15 | 2630 | 2558 | 640.0 |
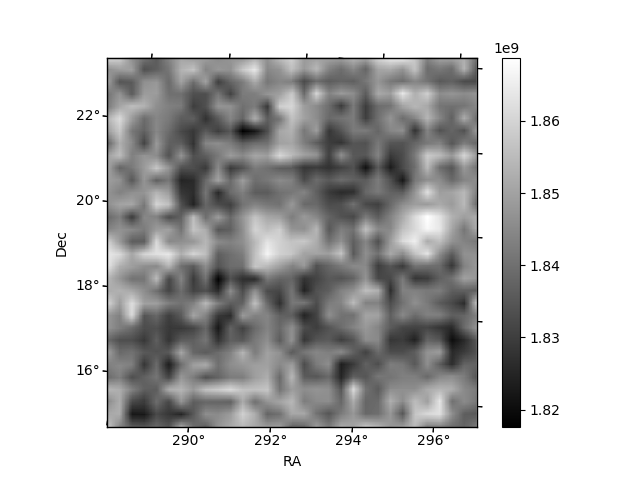
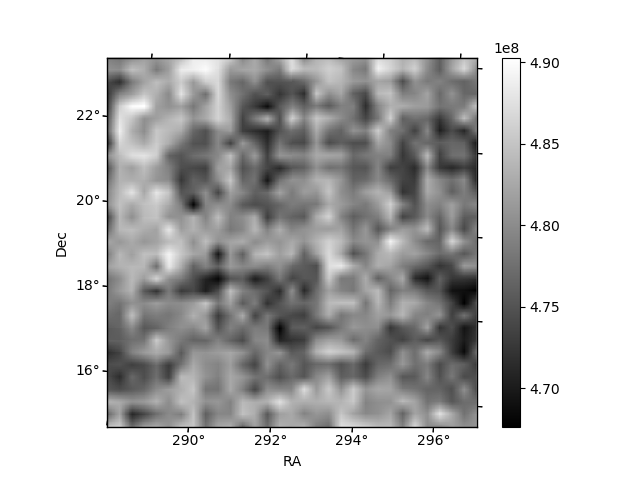
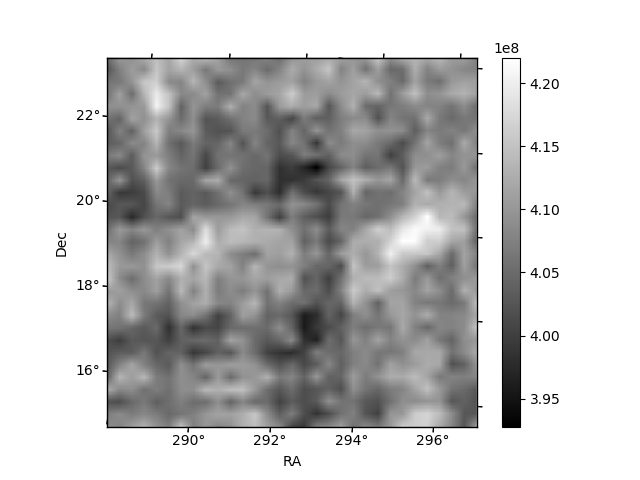
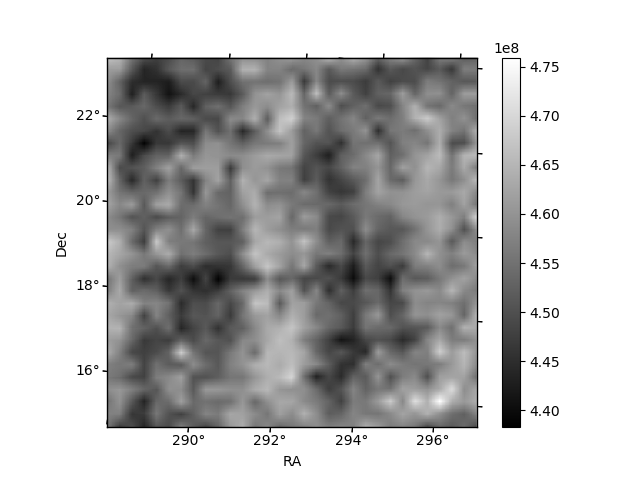
Histogram calculated using DETX and DETY for each event in the final _common_clean file
| Quadrant A | 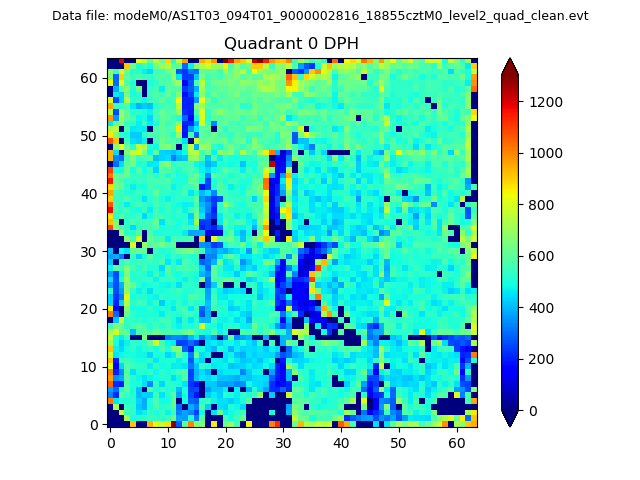 |
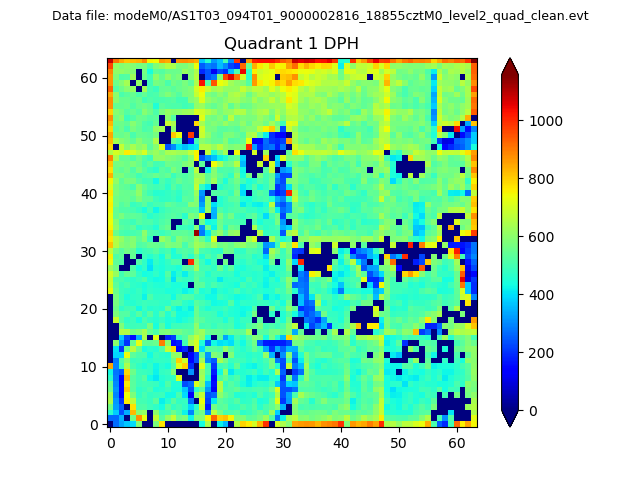 |
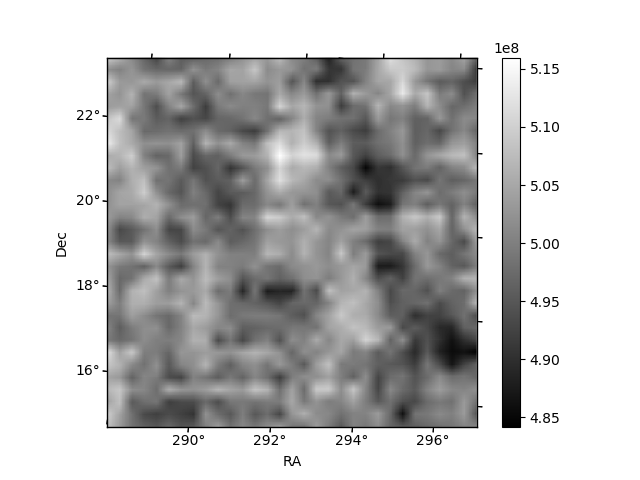
Quadrant B |
|---|---|---|---|
| Quadrant D | 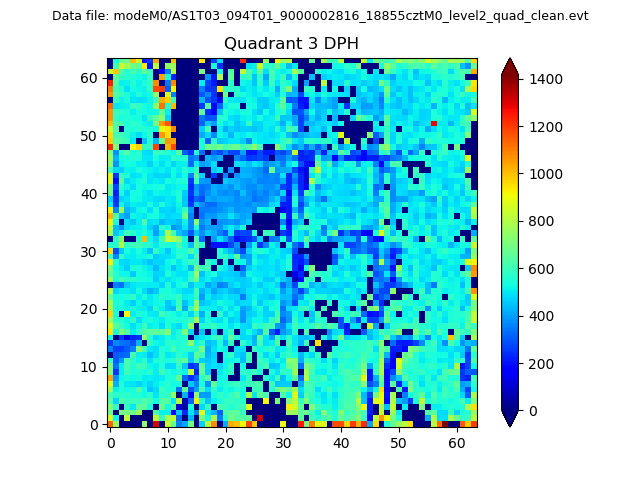 |
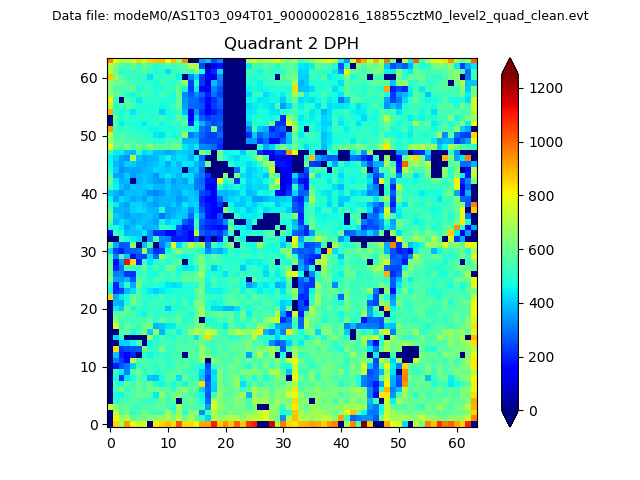 |
Quadrant C |
| Plot type | Count rate plots | Images |
|---|---|---|
| Comparison with Poisson distribution Blue bars denote a histogram of data divided into 1 sec bins. Red curve is a Poisson curve with rate = median count rate of data. |
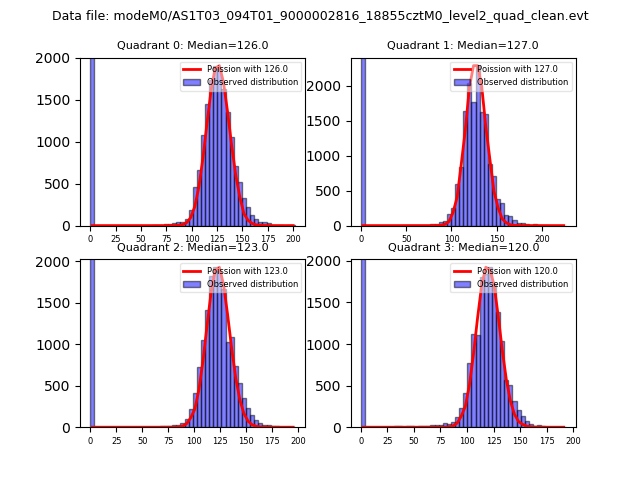 |
 |
| Quadrant-wise count rates Data is divided into 100 sec bins |
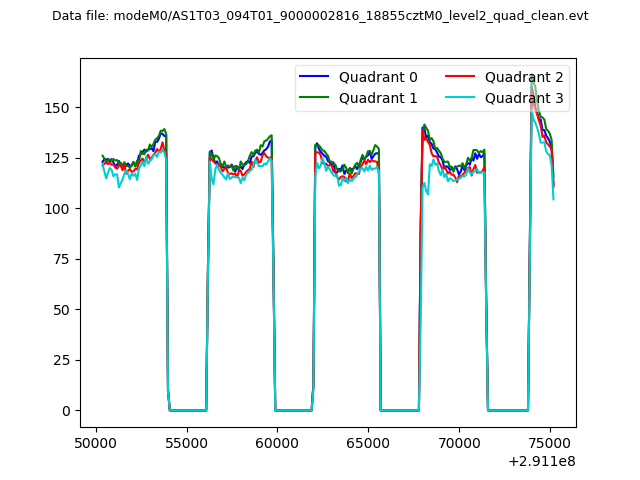 |
|
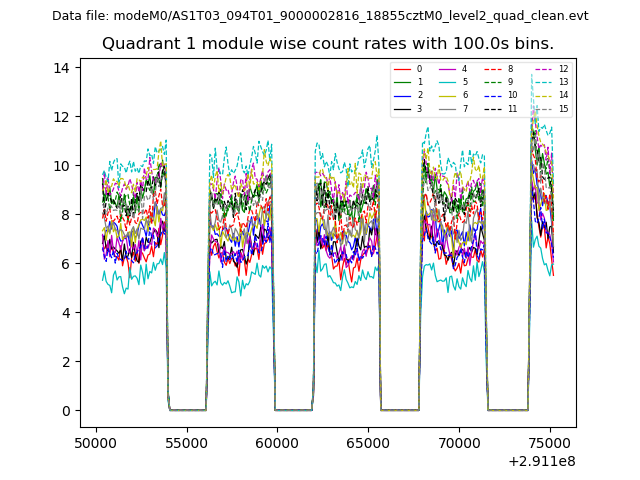
| Module-wise count rates for Quadrant A Data is divided into 100 sec bins |
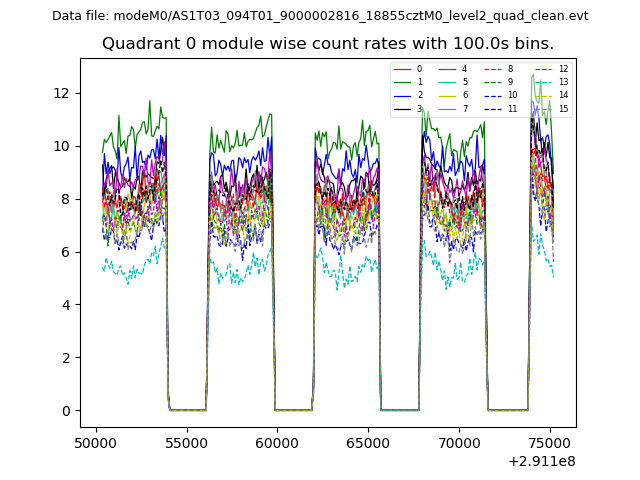 |
 |
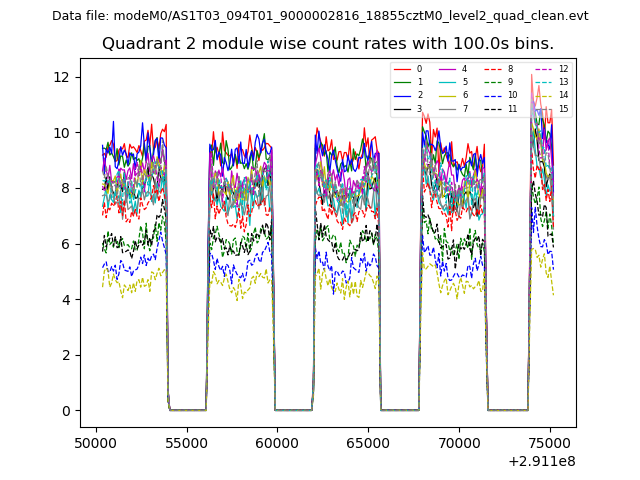
| Module-wise count rates for Quadrant B Data is divided into 100 sec bins |
 |
 |
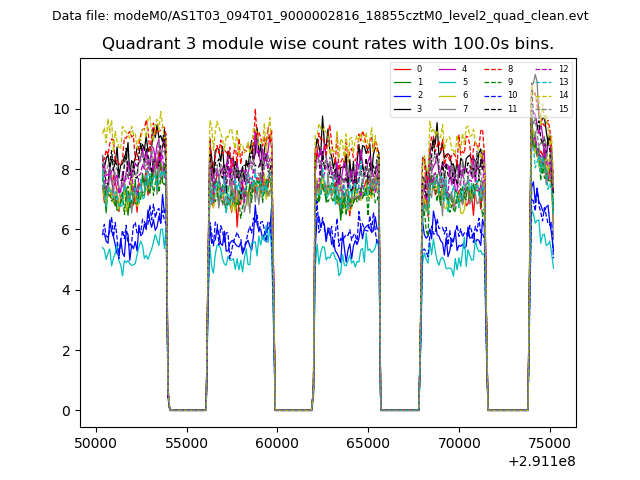
| Module-wise count rates for Quadrant C Data is divided into 100 sec bins |
 |
 |
| Module-wise count rates for Quadrant D Data is divided into 100 sec bins |
 |
 |
| Parameter | Plot |
|---|---|
| CZT HV Monitor | 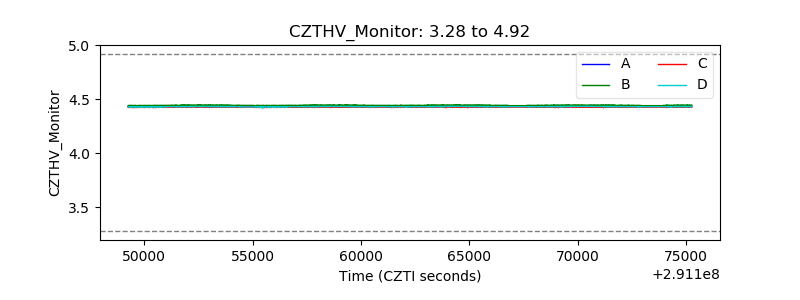 |
| D_VDD | 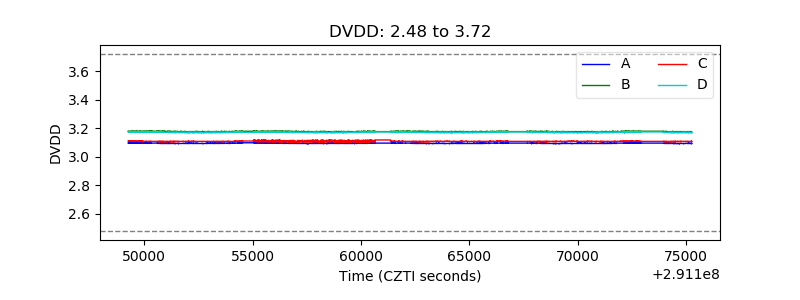 |
| Temperature 1 | 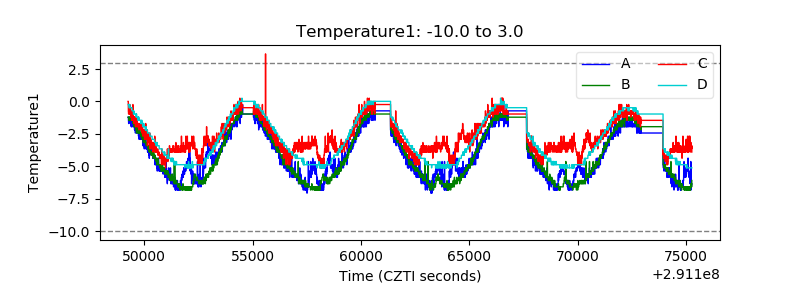 |
| Veto HV Monitor |  |
| Veto LLD | 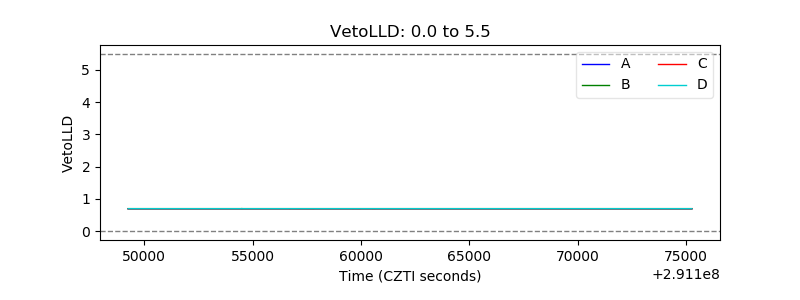 |
| Alpha Counter | 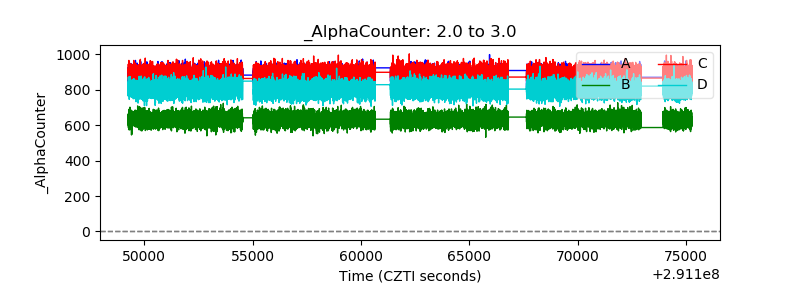 |
| _CPM_Rate | 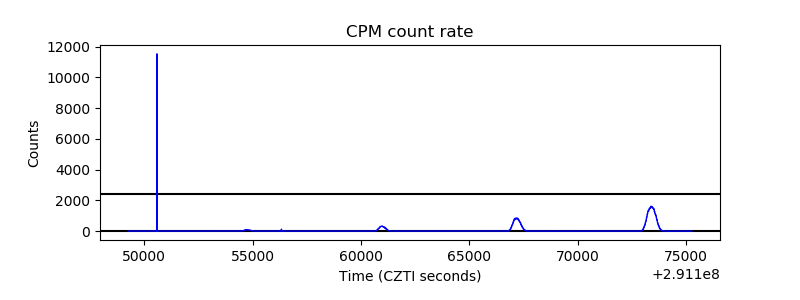 |
| CZT Counter | 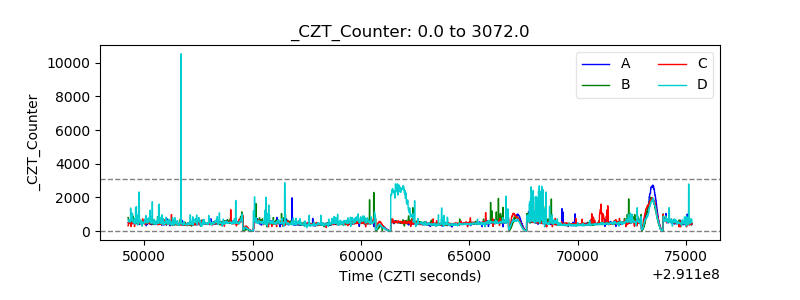 |
| +2.5 Volts monitor | 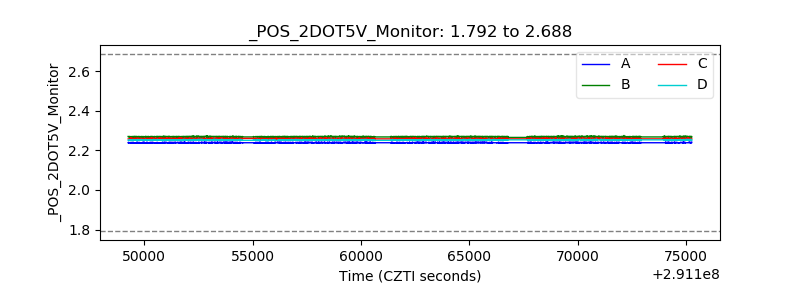 |
| +5 Volts monitor |  |
| _ROLL_ROT | 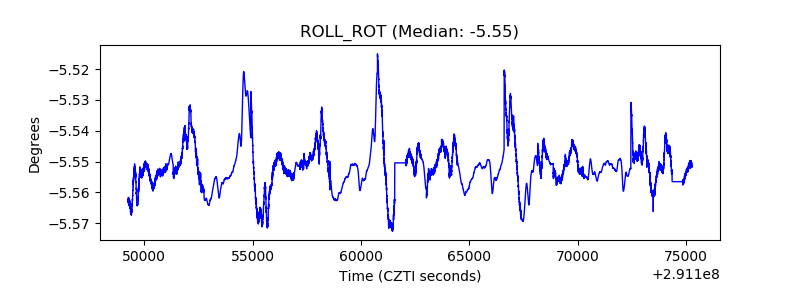 |
| _Roll_DEC | 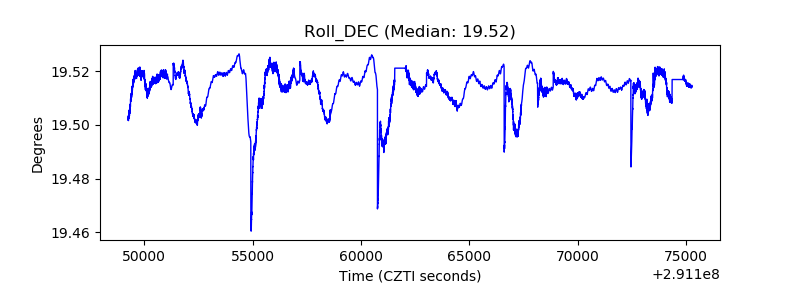 |
| _Roll_RA | 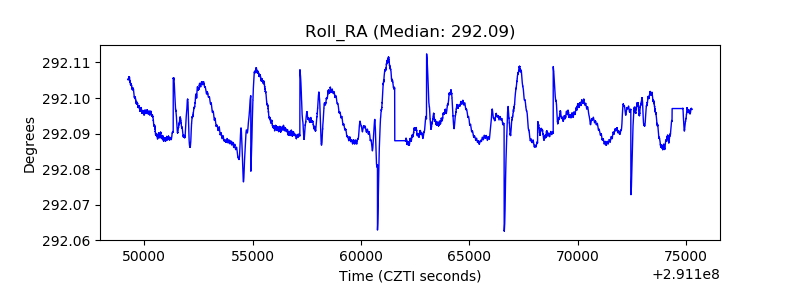 |
| Veto Counter | 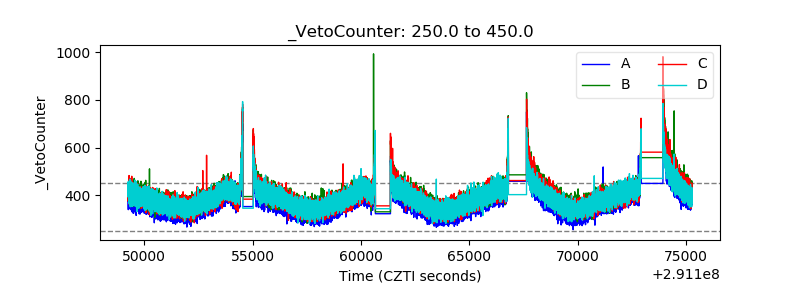 |