| Param | Original file | Final file |
|---|---|---|
| Filename | modeM0/AS1T03_094T01_9000002816_18857cztM0_level2.evt | modeM0/AS1T03_094T01_9000002816_18857cztM0_level2_quad_clean.evt |
| Size (bytes) | 468,668,160 | 102,047,040 |
| Size | 447.0 MB | 97.3 MB |
| Events in quadrant A | 3,141,578 | 668,305 |
| Events in quadrant B | 3,376,068 | 688,350 |
| Events in quadrant C | 3,159,692 | 651,282 |
| Events in quadrant D | 4,071,254 | 625,648 |
| Mode M9 | |||
|---|---|---|---|
| Quadrant | BADHDUFLAG | Total packets | Discarded packets |
| A | 0 | 12 | 0 |
| B | 0 | 12 | 0 |
| C | 0 | 12 | 0 |
| D | 0 | 12 | 0 |
| Mode SS | |||
|---|---|---|---|
| Quadrant | BADHDUFLAG | Total packets | Discarded packets |
| A | 0 | 132 | 0 |
| B | 0 | 132 | 0 |
| C | 0 | 132 | 0 |
| D | 0 | 132 | 0 |
| Mode M0 | |||
|---|---|---|---|
| Quadrant | BADHDUFLAG | Total packets | Discarded packets |
| A | 0 | 13559 | 1 |
| B | 0 | 14385 | 1 |
| C | 0 | 13627 | 1 |
| D | 0 | 16453 | 1 |
| Quadrant | Total seconds | Saturated seconds | Saturation percentage |
|---|---|---|---|
| A | 6556 | 10 | 0.152532% |
| B | 6557 | 46 | 0.701540% |
| C | 6557 | 36 | 0.549032% |
| D | 6557 | 79 | 1.204819% |
Noise dominated data is calculated using 1-second bins in cleaned event files. If a bin has >2000 counts, and if more than 50% of those come from <1% of pixels, then it is considered to be noise-dominated and hence unusable.
| Quadrant | # 1 sec bins | Bins with >0 counts | Bins with >2000 counts | High rate bins dominated by noise | Noise dominated (total time) | Noise dominated (detector-on time) | Marked lightcurve |
|---|---|---|---|---|---|---|---|
| A | 7706 | 6557 | 3 | 3 | 0.04% | 0.05% | 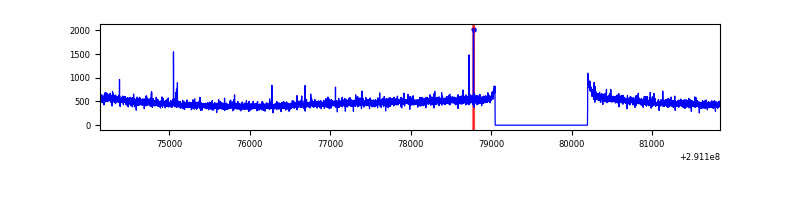 |
| B | 7707 | 6558 | 14 | 14 | 0.18% | 0.21% | 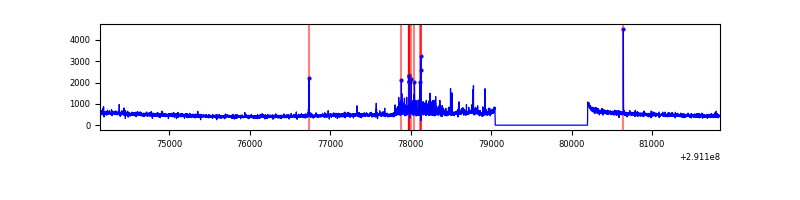 |
| C | 7707 | 6558 | 0 | 0 | 0.00% | 0.00% |  |
| D | 7707 | 6558 | 52 | 52 | 0.67% | 0.79% | 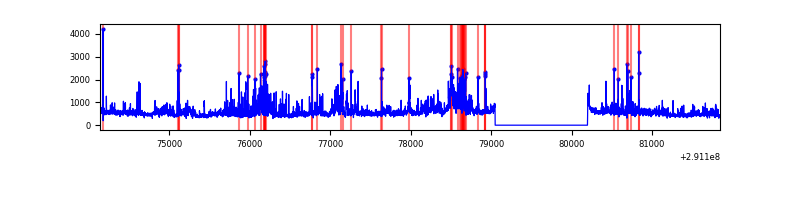 |
Top three noisy pixels from each quadrant. If the there are fewer than three noisy pixels in the level2.evt file, extra rows are filled as -1
| Pixel properties | Quadrant properties | ||||||
|---|---|---|---|---|---|---|---|
| Quadrant | DetID | PixID | Counts | Sigma | Mean | Median | Sigma |
| A | 14 | 4 | 16576 | 96.56 | 805 | 789 | 163.5 |
| A | 11 | 29 | 13910 | 80.26 | 805 | 789 | 163.5 |
| A | 9 | 143 | 11506 | 65.55 | 805 | 789 | 163.5 |
| B | 7 | 220 | 149449 | 956.98 | 810 | 791 | 155.3 |
| B | 4 | 216 | 28410 | 177.8 | 810 | 791 | 155.3 |
| B | 0 | 230 | 18072 | 111.25 | 810 | 791 | 155.3 |
| C | 14 | 238 | 120712 | 665.87 | 771 | 776 | 180.1 |
| C | 3 | 233 | 21261 | 113.73 | 771 | 776 | 180.1 |
| C | 0 | 207 | 10707 | 55.14 | 771 | 776 | 180.1 |
| D | 7 | 238 | 601526 | 3227.45 | 769 | 747 | 186.1 |
| D | 1 | 52 | 293793 | 1574.28 | 769 | 747 | 186.1 |
| D | 9 | 1 | 146941 | 785.37 | 769 | 747 | 186.1 |
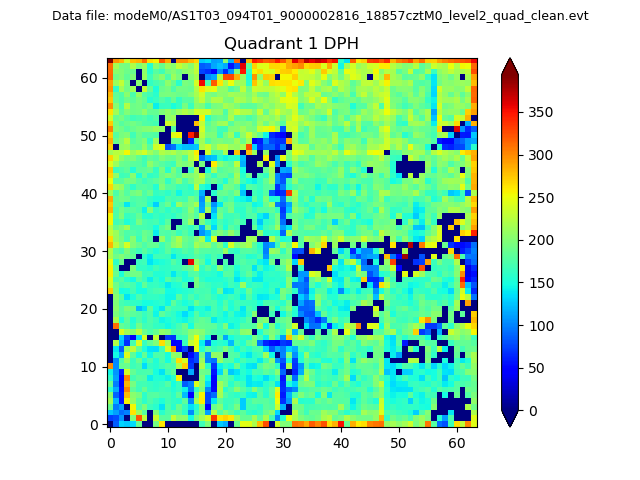
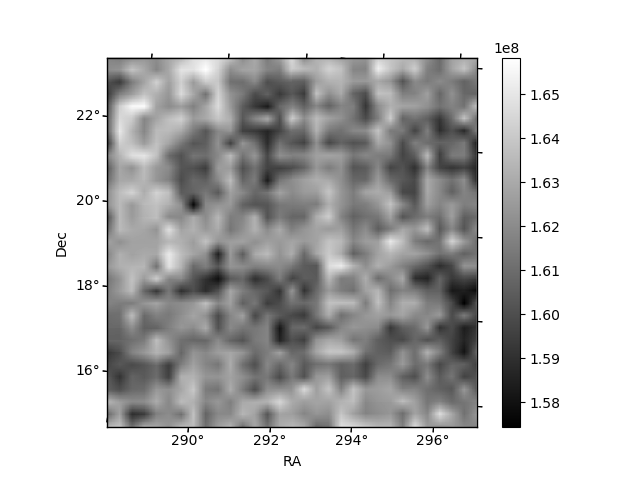
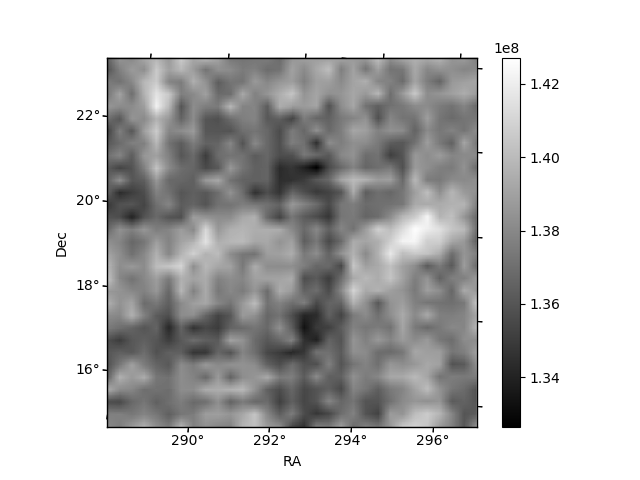
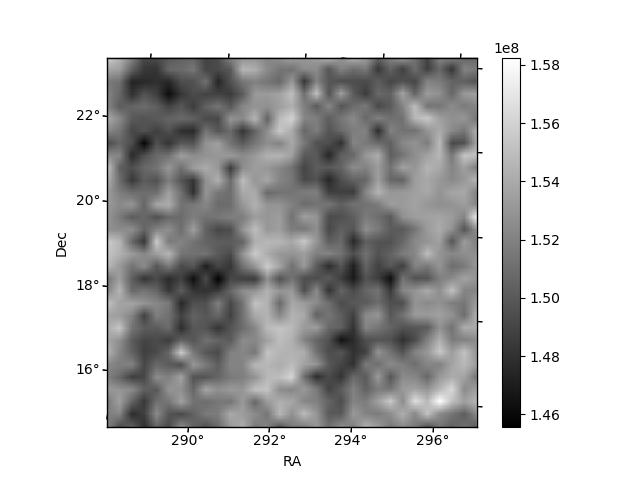
Histogram calculated using DETX and DETY for each event in the final _common_clean file
| Quadrant A |  |
 |
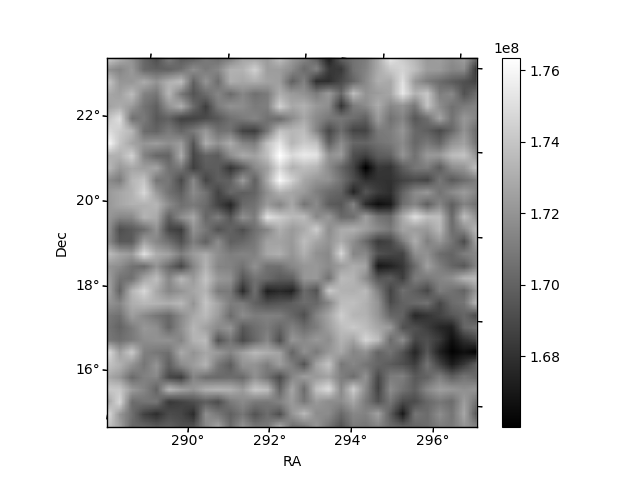
Quadrant B |
|---|---|---|---|
| Quadrant D | 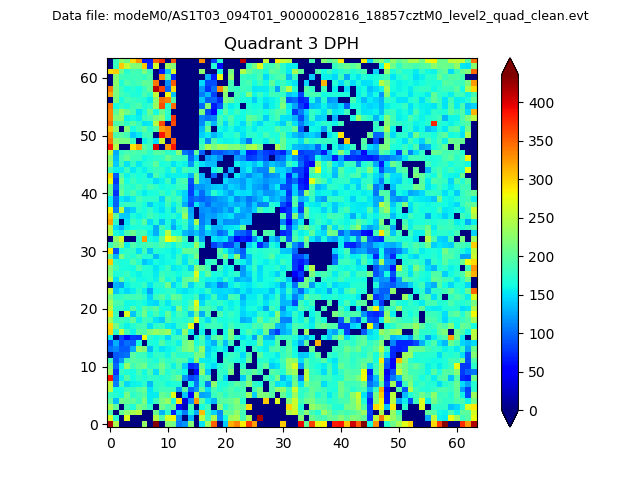 |
 |
Quadrant C |
| Plot type | Count rate plots | Images |
|---|---|---|
| Comparison with Poisson distribution Blue bars denote a histogram of data divided into 1 sec bins. Red curve is a Poisson curve with rate = median count rate of data. |
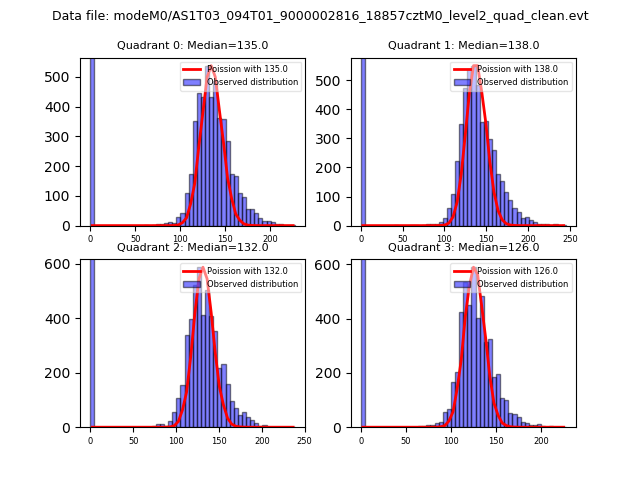 |
 |
| Quadrant-wise count rates Data is divided into 100 sec bins |
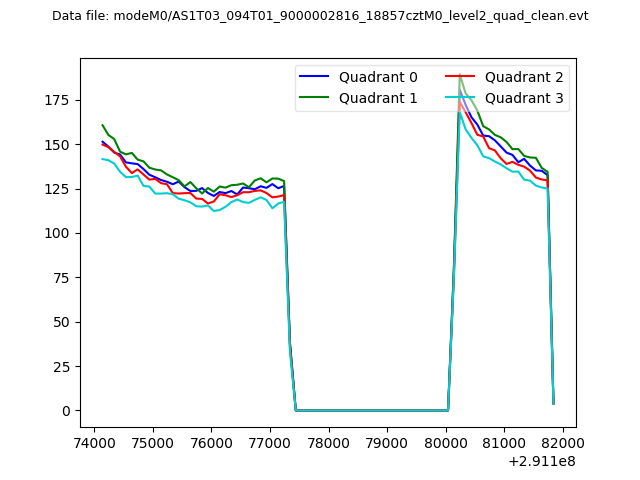 |
|
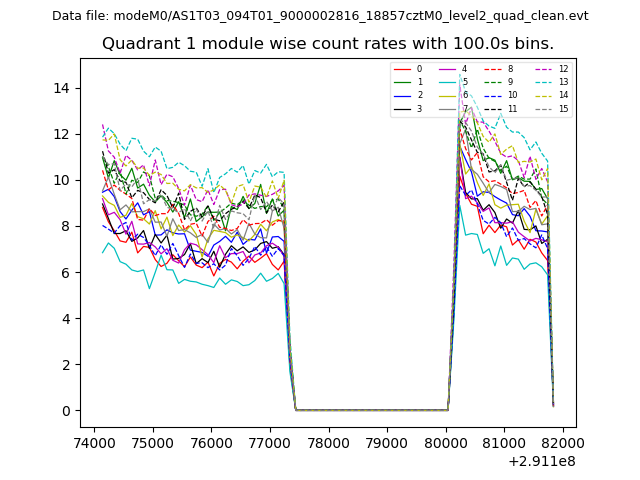
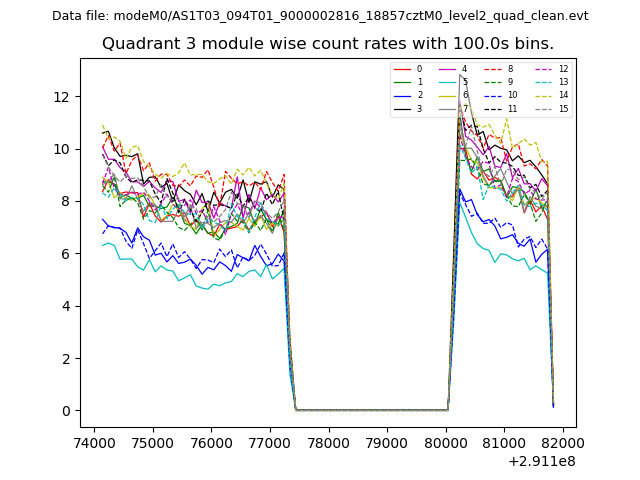
| Module-wise count rates for Quadrant A Data is divided into 100 sec bins |
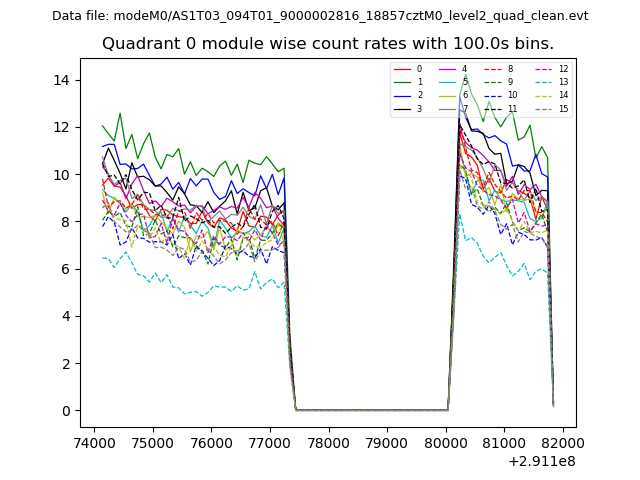 |
 |
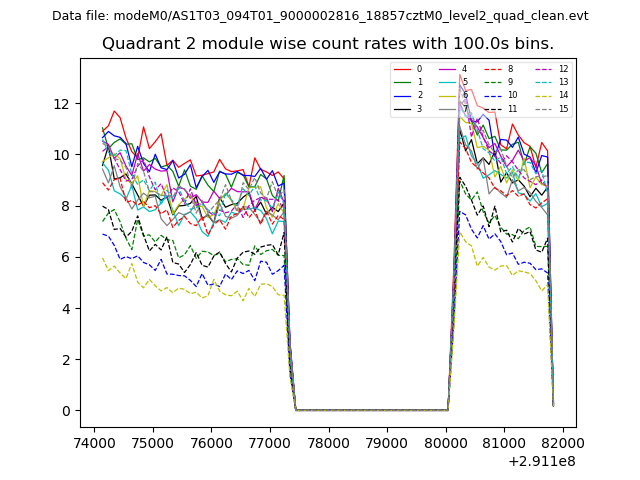
| Module-wise count rates for Quadrant B Data is divided into 100 sec bins |
 |
 |
| Module-wise count rates for Quadrant C Data is divided into 100 sec bins |
 |
 |
| Module-wise count rates for Quadrant D Data is divided into 100 sec bins |
 |
 |
| Parameter | Plot |
|---|---|
| CZT HV Monitor |  |
| D_VDD | 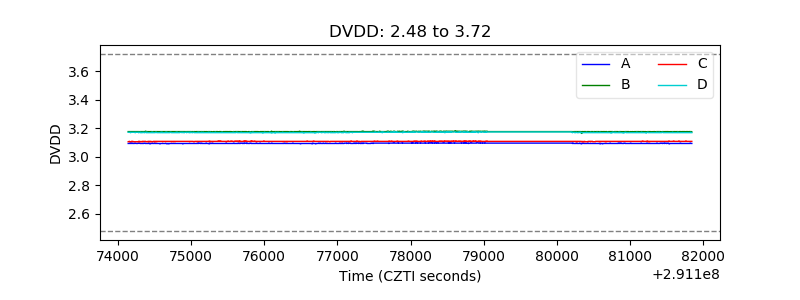 |
| Temperature 1 | 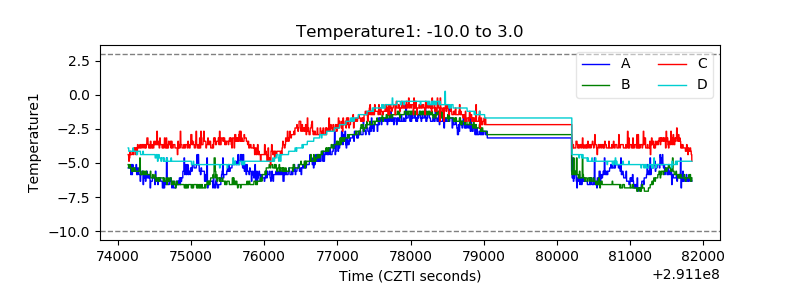 |
| Veto HV Monitor | 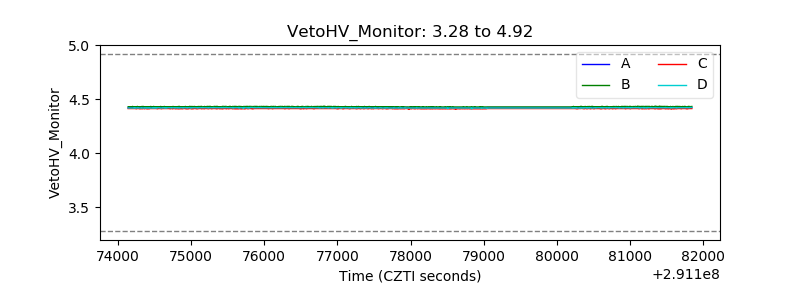 |
| Veto LLD | 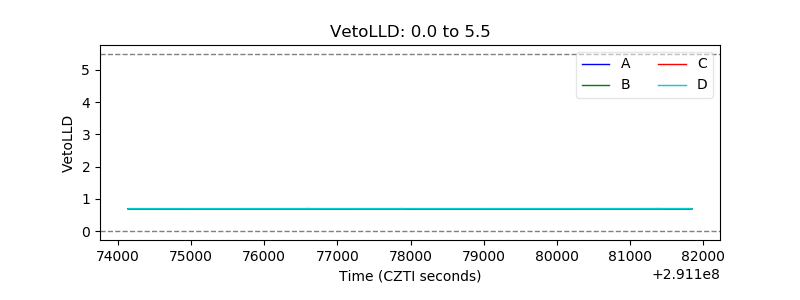 |
| Alpha Counter | 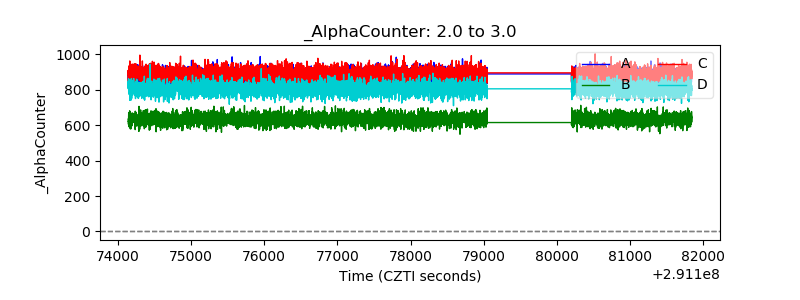 |
| _CPM_Rate | 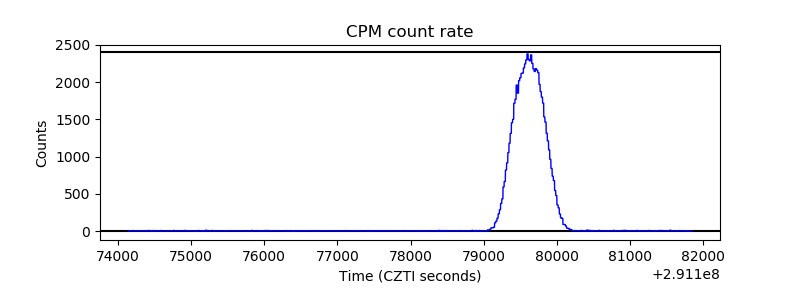 |
| CZT Counter |  |
| +2.5 Volts monitor |  |
| +5 Volts monitor |  |
| _ROLL_ROT | 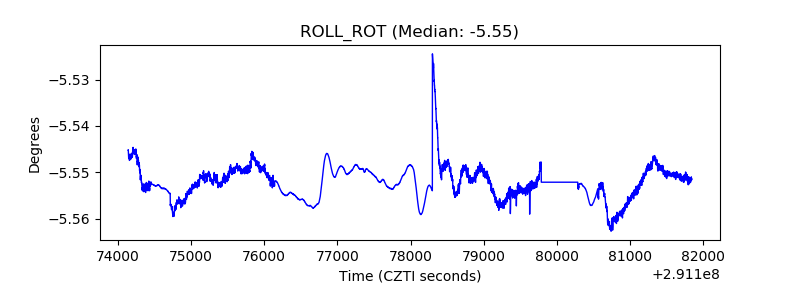 |
| _Roll_DEC | 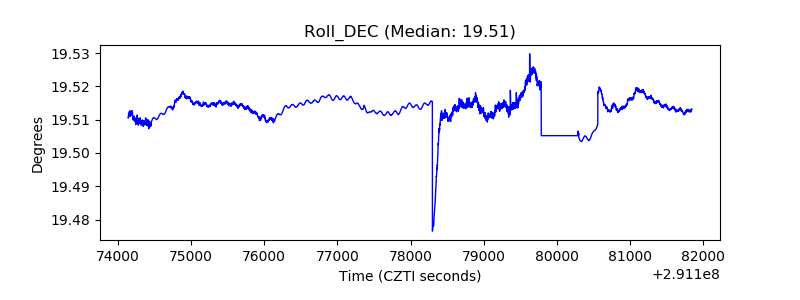 |
| _Roll_RA | 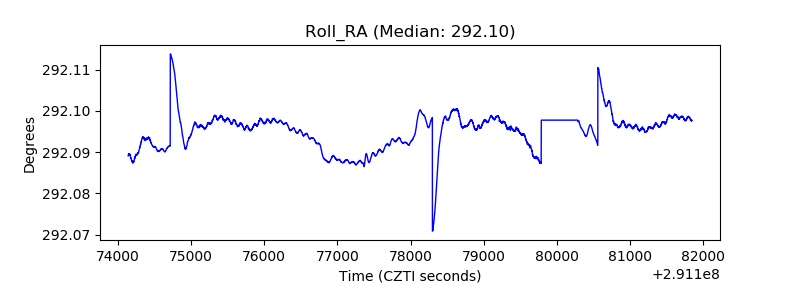 |
| Veto Counter | 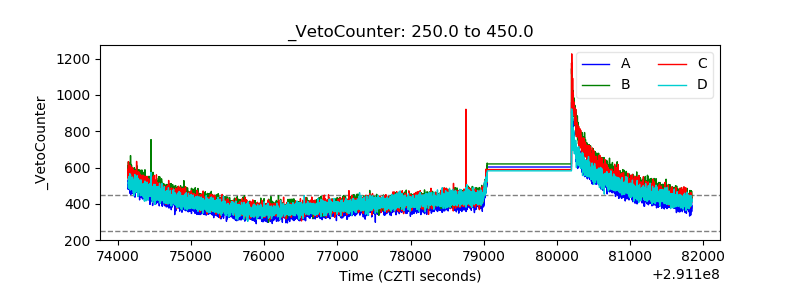 |