| Param | Original file | Final file |
|---|---|---|
| Filename | modeM0/AS1T03_094T01_9000002816_18858cztM0_level2.evt | modeM0/AS1T03_094T01_9000002816_18858cztM0_level2_quad_clean.evt |
| Size (bytes) | 509,636,160 | 98,755,200 |
| Size | 486.0 MB | 94.2 MB |
| Events in quadrant A | 3,177,643 | 656,642 |
| Events in quadrant B | 3,556,171 | 680,868 |
| Events in quadrant C | 3,273,160 | 637,105 |
| Events in quadrant D | 4,988,110 | 564,363 |
| Mode M9 | |||
|---|---|---|---|
| Quadrant | BADHDUFLAG | Total packets | Discarded packets |
| A | 0 | 12 | 0 |
| B | 0 | 12 | 0 |
| C | 0 | 12 | 0 |
| D | 0 | 12 | 0 |
| Mode SS | |||
|---|---|---|---|
| Quadrant | BADHDUFLAG | Total packets | Discarded packets |
| A | 0 | 134 | 0 |
| B | 0 | 134 | 0 |
| C | 0 | 134 | 0 |
| D | 0 | 134 | 0 |
| Mode M0 | |||
|---|---|---|---|
| Quadrant | BADHDUFLAG | Total packets | Discarded packets |
| A | 0 | 13413 | 2 |
| B | 0 | 14711 | 2 |
| C | 0 | 13736 | 2 |
| D | 0 | 19135 | 2 |
| Quadrant | Total seconds | Saturated seconds | Saturation percentage |
|---|---|---|---|
| A | 6465 | 19 | 0.293890% |
| B | 6465 | 108 | 1.670534% |
| C | 6465 | 59 | 0.912606% |
| D | 6465 | 614 | 9.497293% |
Noise dominated data is calculated using 1-second bins in cleaned event files. If a bin has >2000 counts, and if more than 50% of those come from <1% of pixels, then it is considered to be noise-dominated and hence unusable.
| Quadrant | # 1 sec bins | Bins with >0 counts | Bins with >2000 counts | High rate bins dominated by noise | Noise dominated (total time) | Noise dominated (detector-on time) | Marked lightcurve |
|---|---|---|---|---|---|---|---|
| A | 7715 | 6466 | 0 | 0 | 0.00% | 0.00% | 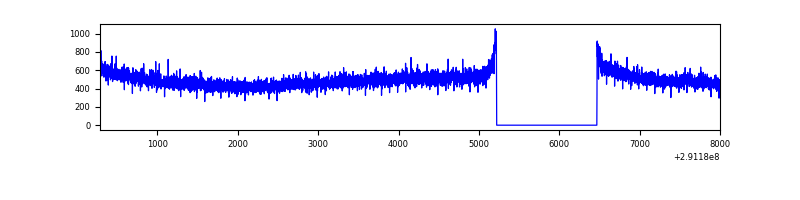 |
| B | 7715 | 6466 | 41 | 41 | 0.53% | 0.63% | 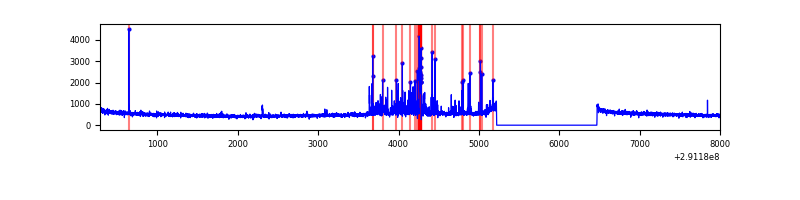 |
| C | 7715 | 6466 | 9 | 9 | 0.12% | 0.14% | 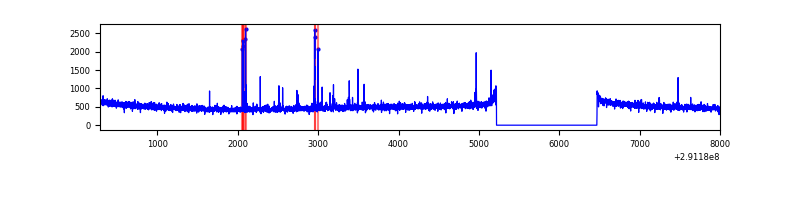 |
| D | 7715 | 6466 | 464 | 464 | 6.01% | 7.18% | 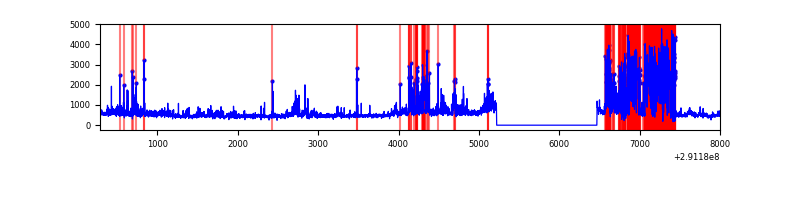 |
Top three noisy pixels from each quadrant. If the there are fewer than three noisy pixels in the level2.evt file, extra rows are filled as -1
| Pixel properties | Quadrant properties | ||||||
|---|---|---|---|---|---|---|---|
| Quadrant | DetID | PixID | Counts | Sigma | Mean | Median | Sigma |
| A | 11 | 29 | 11520 | 65.18 | 822 | 806 | 164.4 |
| A | 13 | 254 | 10644 | 59.85 | 822 | 806 | 164.4 |
| A | 0 | 226 | 7295 | 39.48 | 822 | 806 | 164.4 |
| B | 7 | 220 | 299654 | 1936.09 | 822 | 803 | 154.4 |
| B | 12 | 111 | 17804 | 110.14 | 822 | 803 | 154.4 |
| B | 11 | 111 | 14980 | 91.84 | 822 | 803 | 154.4 |
| C | 14 | 238 | 124480 | 679.36 | 785 | 792 | 182.1 |
| C | 5 | 112 | 55550 | 300.76 | 785 | 792 | 182.1 |
| C | 0 | 207 | 24767 | 131.68 | 785 | 792 | 182.1 |
| D | 7 | 238 | 1541327 | 8444.8 | 750 | 729 | 182.4 |
| D | 7 | 38 | 238918 | 1305.64 | 750 | 729 | 182.4 |
| D | 1 | 52 | 227270 | 1241.79 | 750 | 729 | 182.4 |
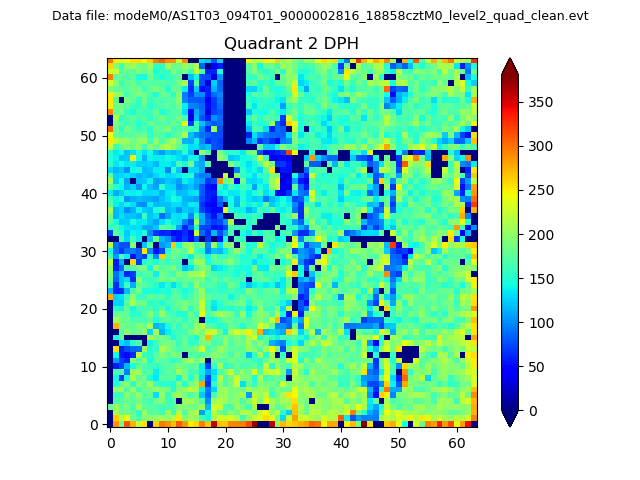
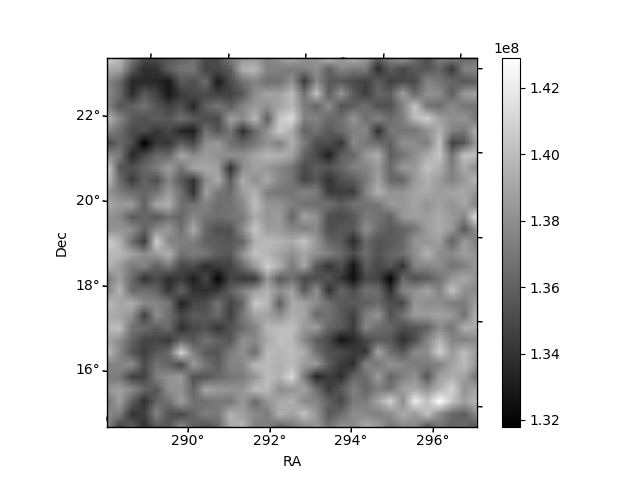
Histogram calculated using DETX and DETY for each event in the final _common_clean file
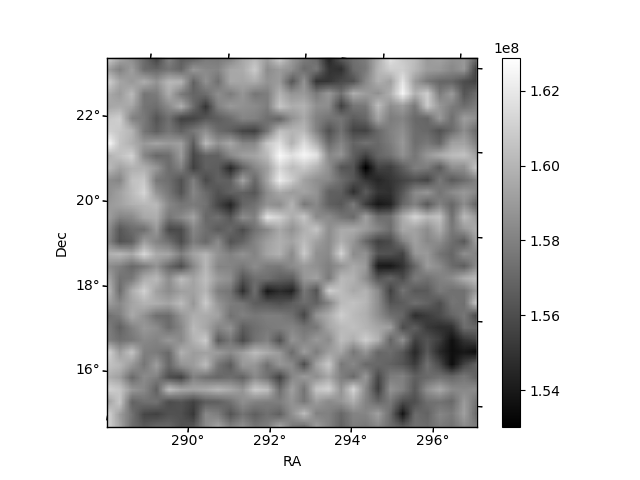
| Quadrant A | 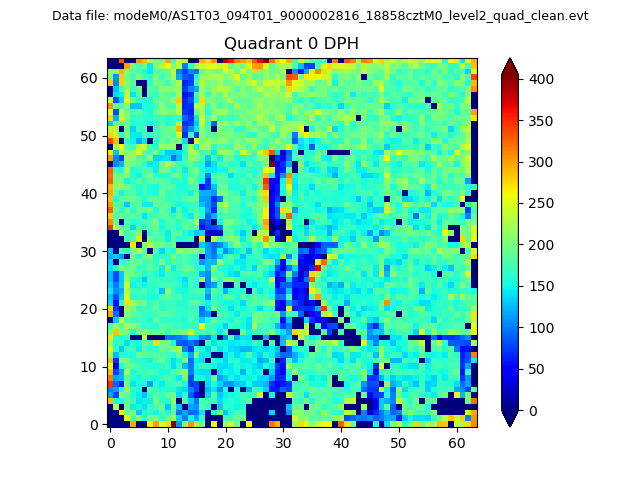 |
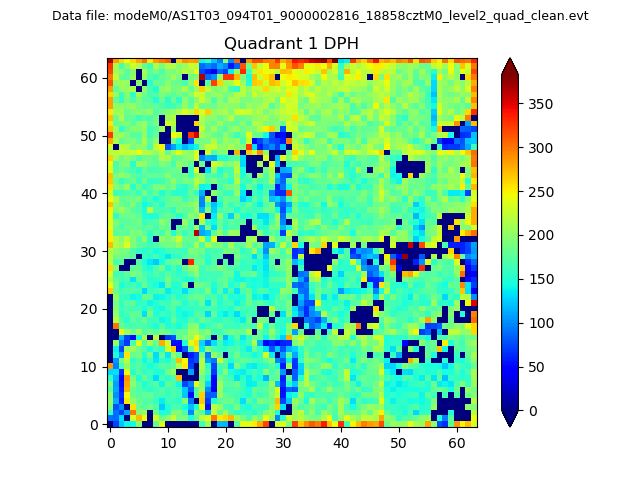 |
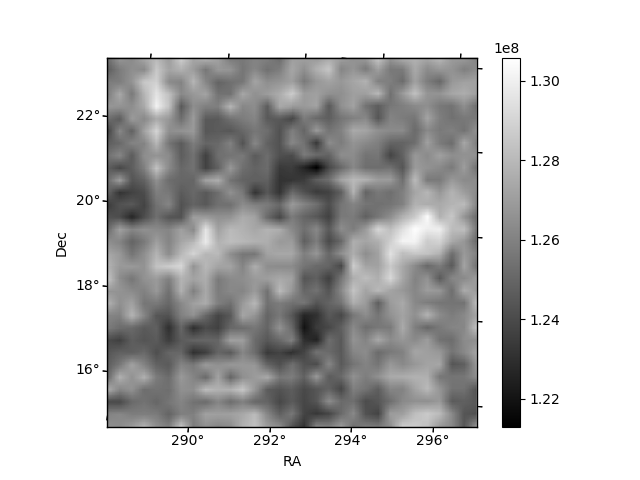
Quadrant B |
|---|---|---|---|
| Quadrant D | 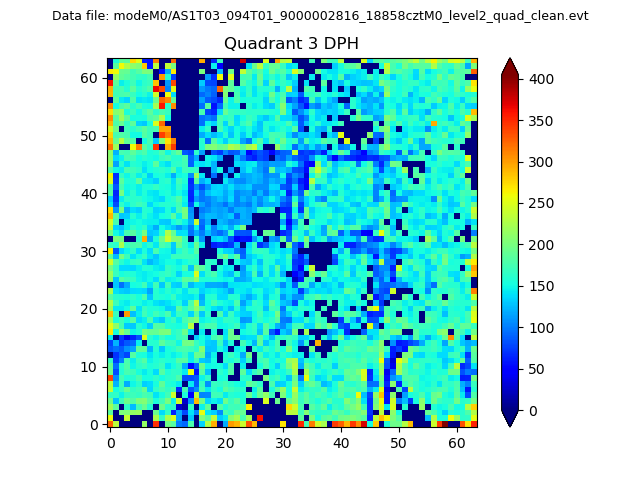 |
 |
Quadrant C |
| Plot type | Count rate plots | Images |
|---|---|---|
| Comparison with Poisson distribution Blue bars denote a histogram of data divided into 1 sec bins. Red curve is a Poisson curve with rate = median count rate of data. |
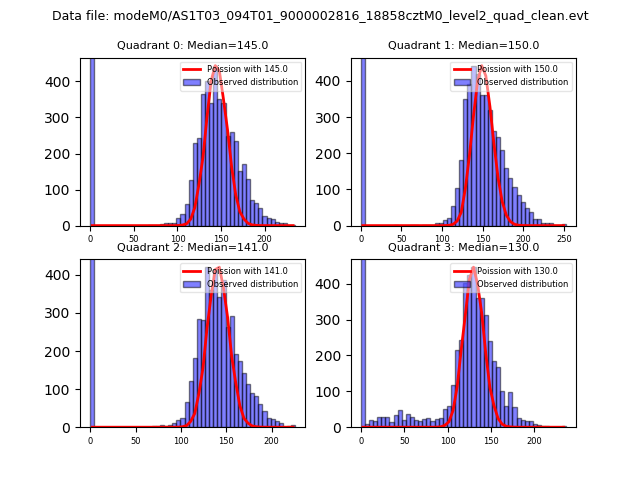 |
 |
| Quadrant-wise count rates Data is divided into 100 sec bins |
 |
|
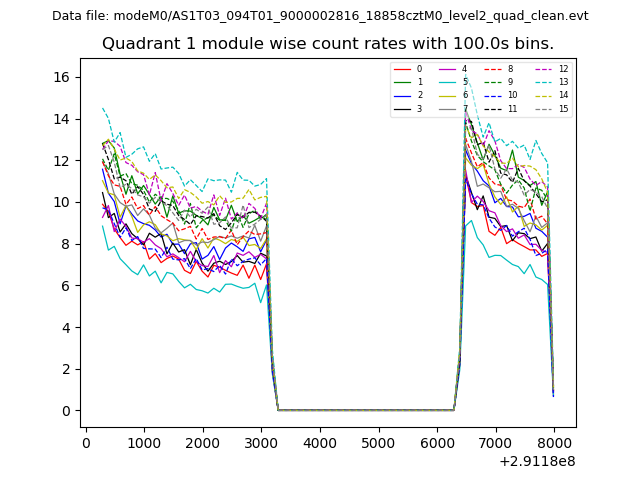
| Module-wise count rates for Quadrant A Data is divided into 100 sec bins |
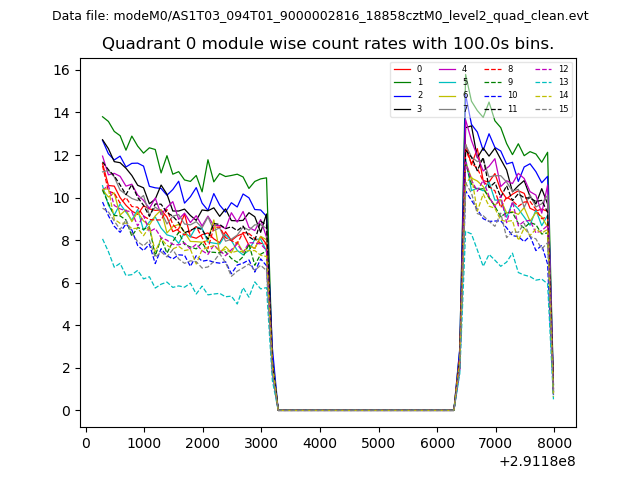 |
 |
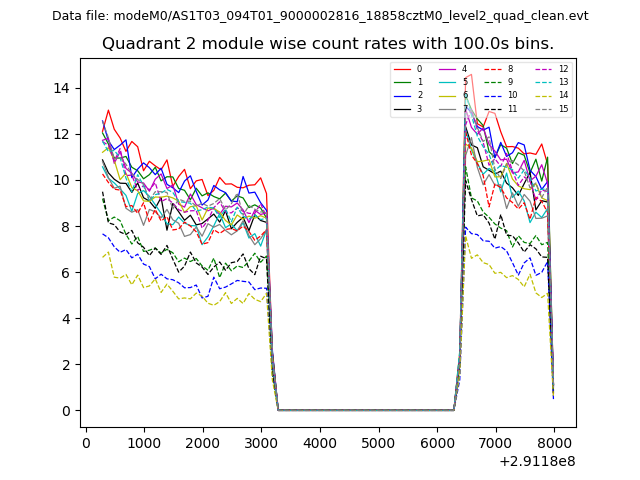
| Module-wise count rates for Quadrant B Data is divided into 100 sec bins |
 |
 |
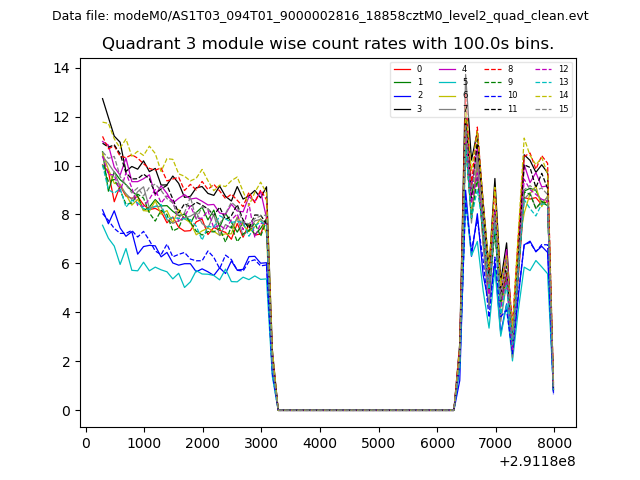
| Module-wise count rates for Quadrant C Data is divided into 100 sec bins |
 |
 |
| Module-wise count rates for Quadrant D Data is divided into 100 sec bins |
 |
 |
| Parameter | Plot |
|---|---|
| CZT HV Monitor | 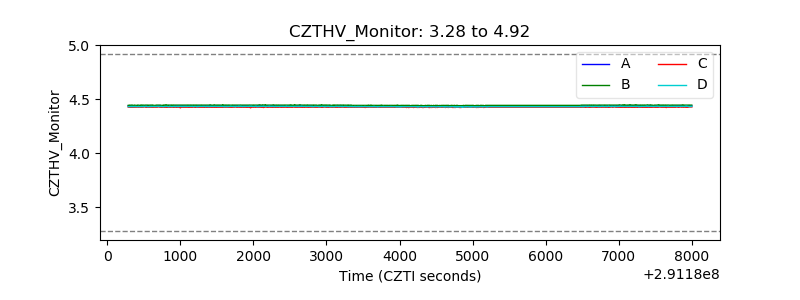 |
| D_VDD | 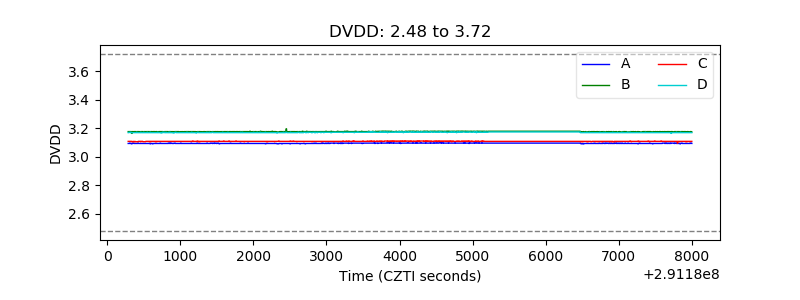 |
| Temperature 1 | 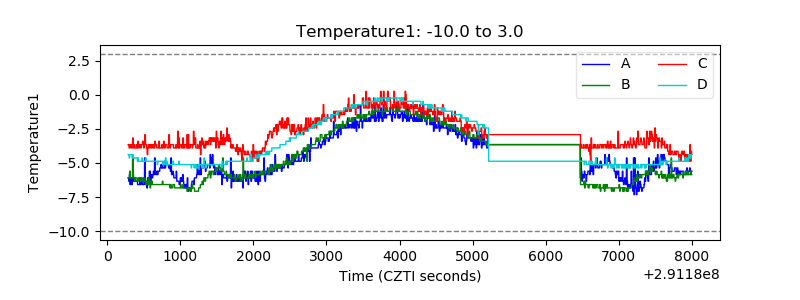 |
| Veto HV Monitor | 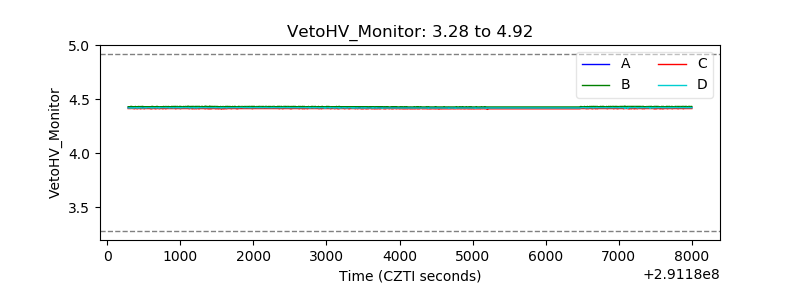 |
| Veto LLD | 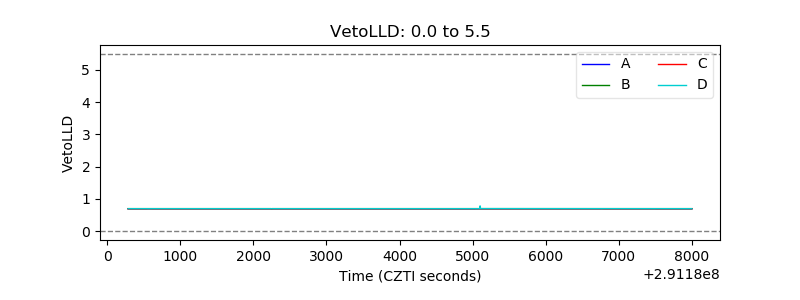 |
| Alpha Counter |  |
| _CPM_Rate | 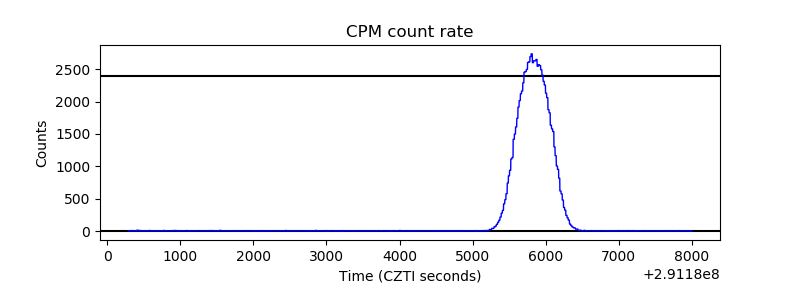 |
| CZT Counter | 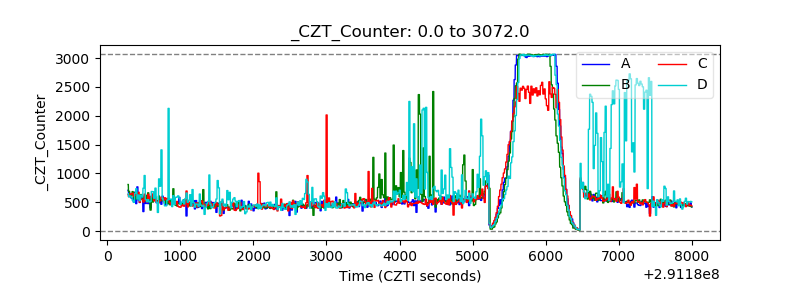 |
| +2.5 Volts monitor |  |
| +5 Volts monitor |  |
| _ROLL_ROT | 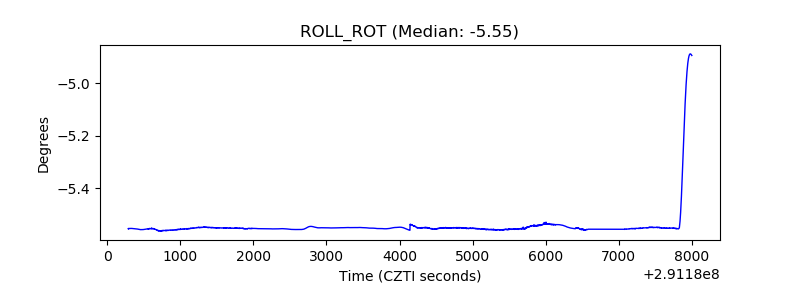 |
| _Roll_DEC | 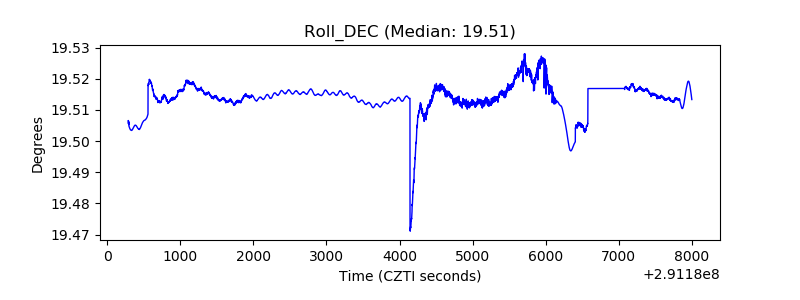 |
| _Roll_RA | 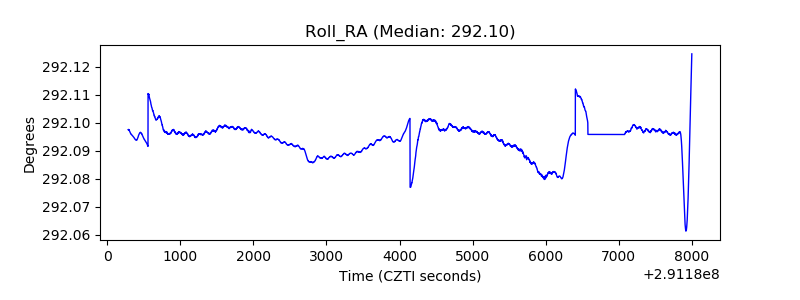 |
| Veto Counter | 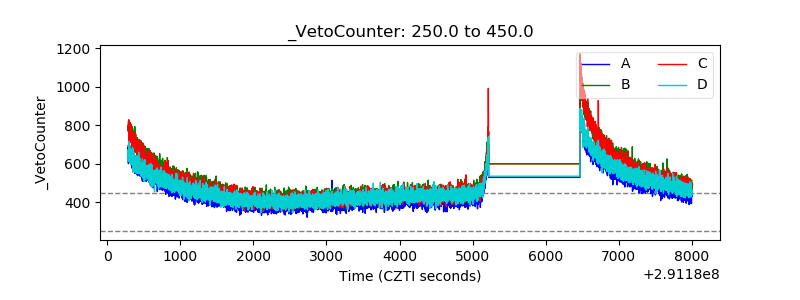 |