| Param | Original file | Final file |
|---|---|---|
| Filename | modeM0/AS1T03_094T01_9000002816_18859cztM0_level2.evt | modeM0/AS1T03_094T01_9000002816_18859cztM0_level2_quad_clean.evt |
| Size (bytes) | 504,924,480 | 84,513,600 |
| Size | 481.5 MB | 80.6 MB |
| Events in quadrant A | 2,984,202 | 555,139 |
| Events in quadrant B | 3,172,524 | 571,088 |
| Events in quadrant C | 3,112,190 | 537,050 |
| Events in quadrant D | 5,624,719 | 485,937 |
| Mode M9 | |||
|---|---|---|---|
| Quadrant | BADHDUFLAG | Total packets | Discarded packets |
| A | 0 | 13 | 0 |
| B | 0 | 13 | 0 |
| C | 0 | 13 | 0 |
| D | 0 | 13 | 0 |
| Mode SS | |||
|---|---|---|---|
| Quadrant | BADHDUFLAG | Total packets | Discarded packets |
| A | 0 | 120 | 0 |
| B | 0 | 120 | 0 |
| C | 0 | 120 | 0 |
| D | 0 | 120 | 0 |
| Mode M0 | |||
|---|---|---|---|
| Quadrant | BADHDUFLAG | Total packets | Discarded packets |
| A | 0 | 12297 | 1 |
| B | 0 | 12997 | 1 |
| C | 0 | 12690 | 1 |
| D | 0 | 20629 | 1 |
| Quadrant | Total seconds | Saturated seconds | Saturation percentage |
|---|---|---|---|
| A | 5864 | 52 | 0.886767% |
| B | 5864 | 71 | 1.210778% |
| C | 5864 | 78 | 1.330150% |
| D | 5864 | 988 | 16.848568% |
Noise dominated data is calculated using 1-second bins in cleaned event files. If a bin has >2000 counts, and if more than 50% of those come from <1% of pixels, then it is considered to be noise-dominated and hence unusable.
| Quadrant | # 1 sec bins | Bins with >0 counts | Bins with >2000 counts | High rate bins dominated by noise | Noise dominated (total time) | Noise dominated (detector-on time) | Marked lightcurve |
|---|---|---|---|---|---|---|---|
| A | 7174 | 5865 | 1 | 1 | 0.01% | 0.02% | 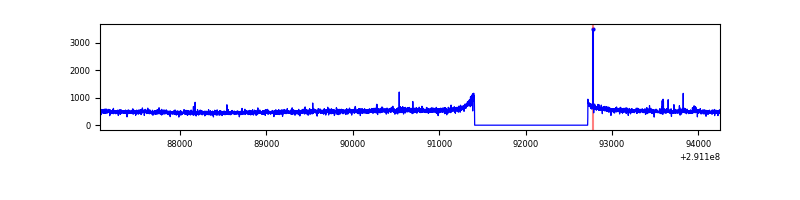 |
| B | 7174 | 5865 | 3 | 3 | 0.04% | 0.05% | 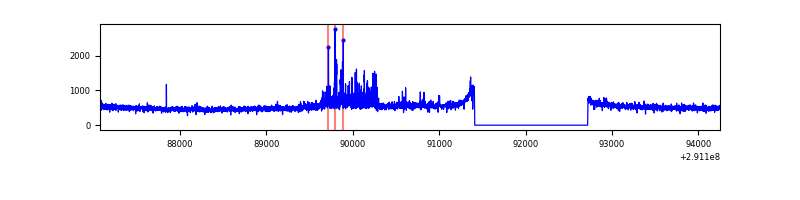 |
| C | 7174 | 5865 | 0 | 0 | 0.00% | 0.00% | 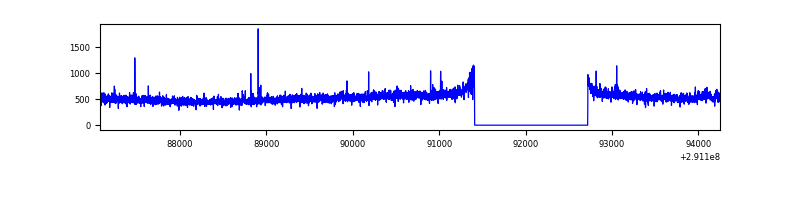 |
| D | 7174 | 5865 | 728 | 728 | 10.15% | 12.41% | 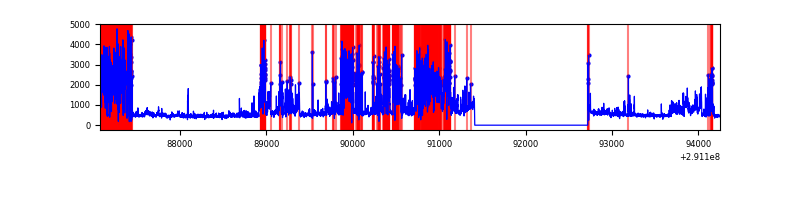 |
Top three noisy pixels from each quadrant. If the there are fewer than three noisy pixels in the level2.evt file, extra rows are filled as -1
| Pixel properties | Quadrant properties | ||||||
|---|---|---|---|---|---|---|---|
| Quadrant | DetID | PixID | Counts | Sigma | Mean | Median | Sigma |
| A | 4 | 2 | 12042 | 73.07 | 768 | 754 | 154.5 |
| A | 11 | 29 | 9711 | 57.98 | 768 | 754 | 154.5 |
| A | 13 | 254 | 9615 | 57.36 | 768 | 754 | 154.5 |
| B | 7 | 220 | 126769 | 876.78 | 765 | 749 | 143.7 |
| B | 12 | 111 | 15862 | 105.15 | 765 | 749 | 143.7 |
| B | 4 | 216 | 13705 | 90.14 | 765 | 749 | 143.7 |
| C | 3 | 233 | 136848 | 806.6 | 728 | 734 | 168.8 |
| C | 14 | 238 | 114693 | 675.31 | 728 | 734 | 168.8 |
| C | 5 | 112 | 14080 | 79.09 | 728 | 734 | 168.8 |
| D | 7 | 238 | 2685044 | 16146.24 | 678 | 657 | 166.3 |
| D | 1 | 52 | 167981 | 1006.43 | 678 | 657 | 166.3 |
| D | 14 | 34 | 64841 | 386.06 | 678 | 657 | 166.3 |
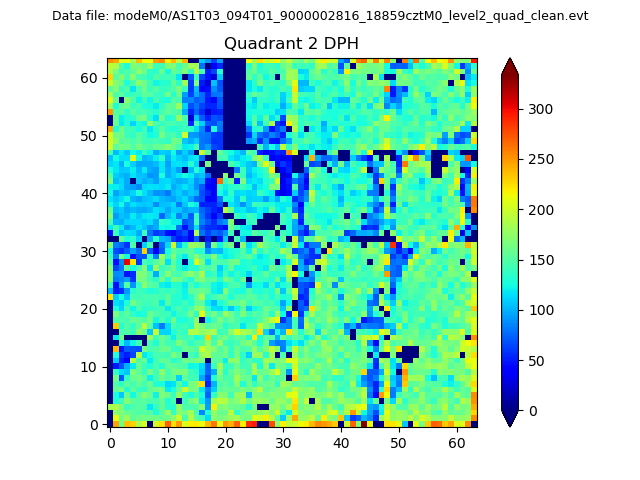
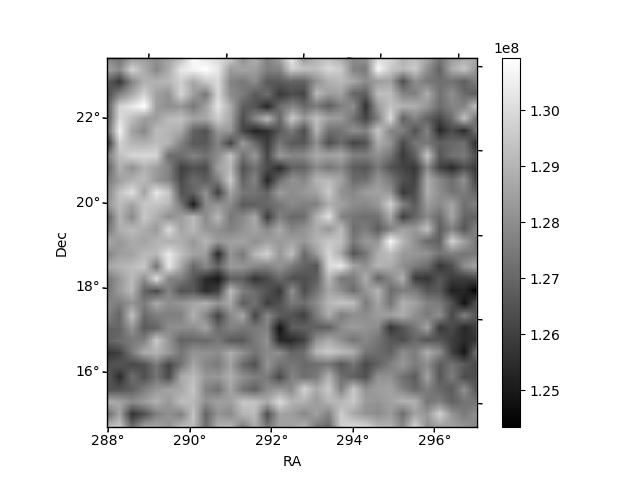
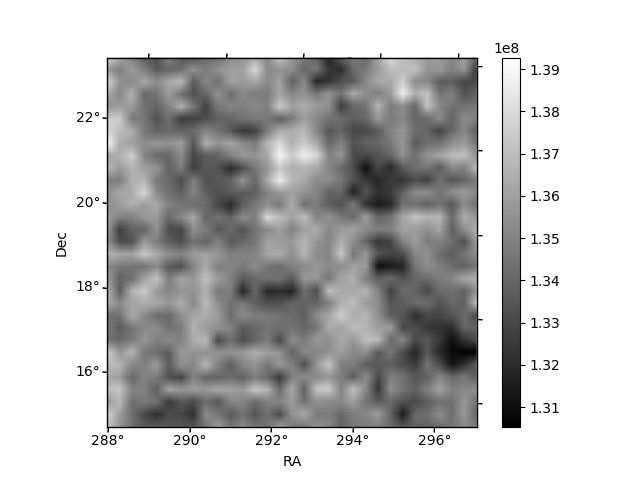
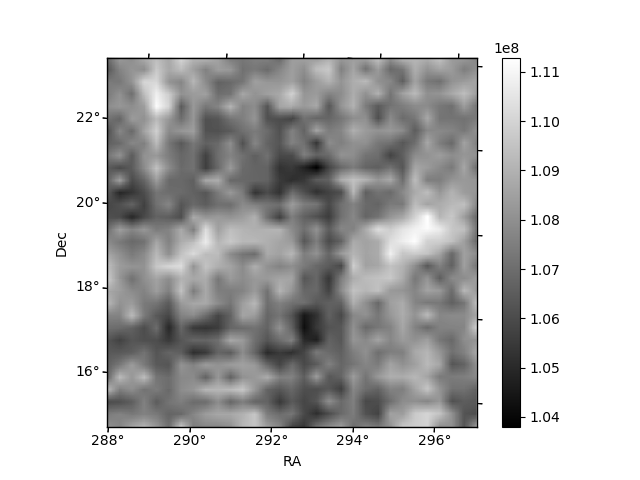
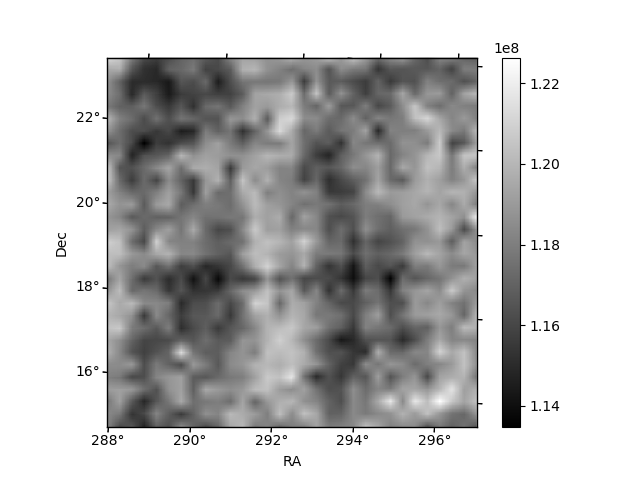
Histogram calculated using DETX and DETY for each event in the final _common_clean file
| Quadrant A | 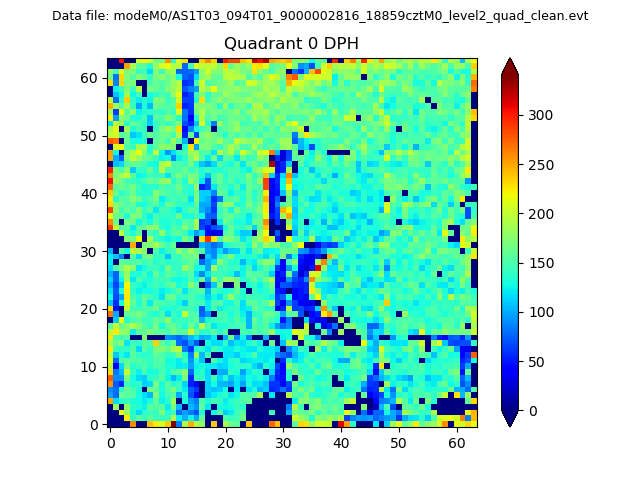 |
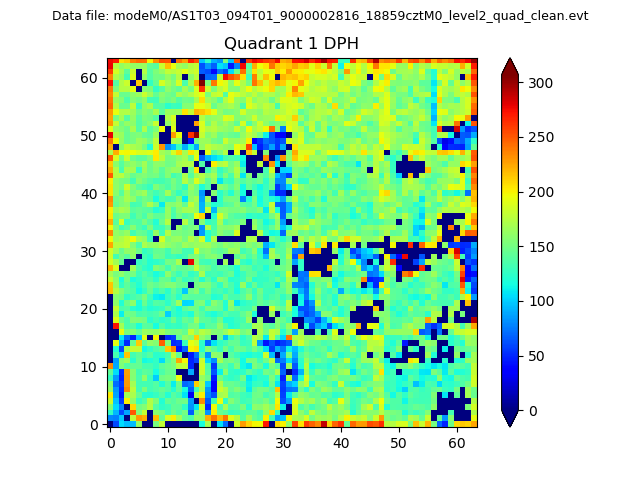 |
Quadrant B |
|---|---|---|---|
| Quadrant D | 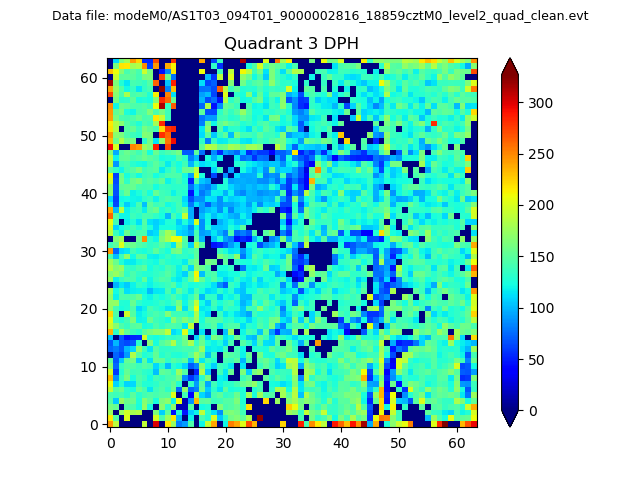 |
 |
Quadrant C |
| Plot type | Count rate plots | Images |
|---|---|---|
| Comparison with Poisson distribution Blue bars denote a histogram of data divided into 1 sec bins. Red curve is a Poisson curve with rate = median count rate of data. |
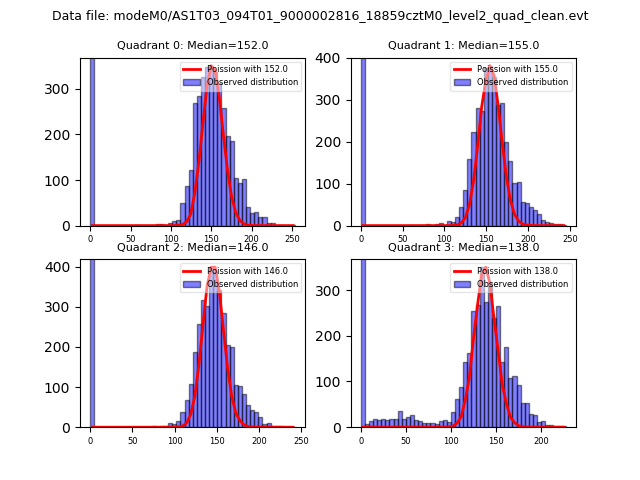 |
 |
| Quadrant-wise count rates Data is divided into 100 sec bins |
 |
|
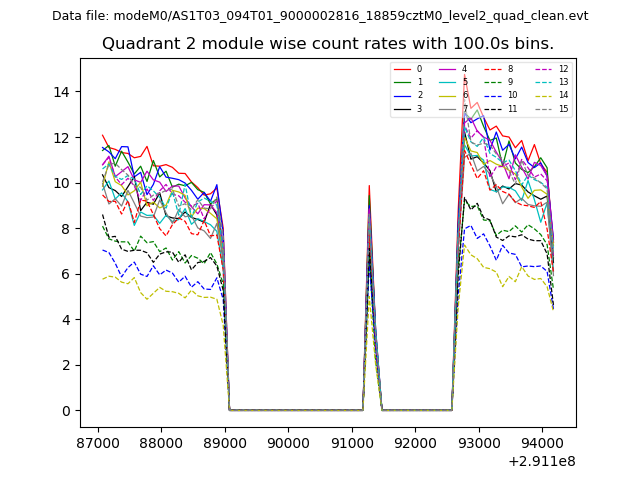
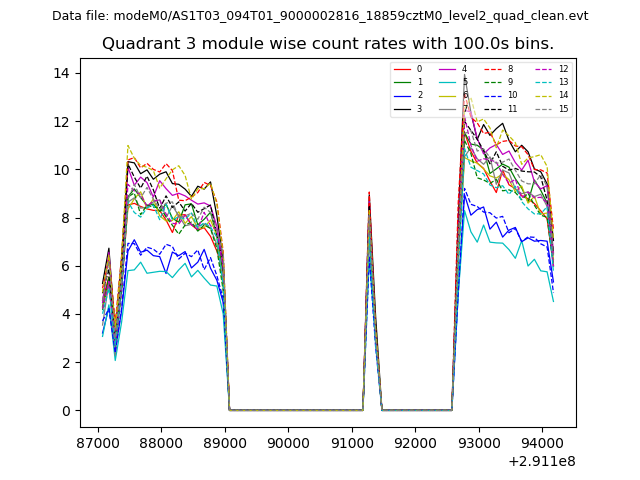
| Module-wise count rates for Quadrant A Data is divided into 100 sec bins |
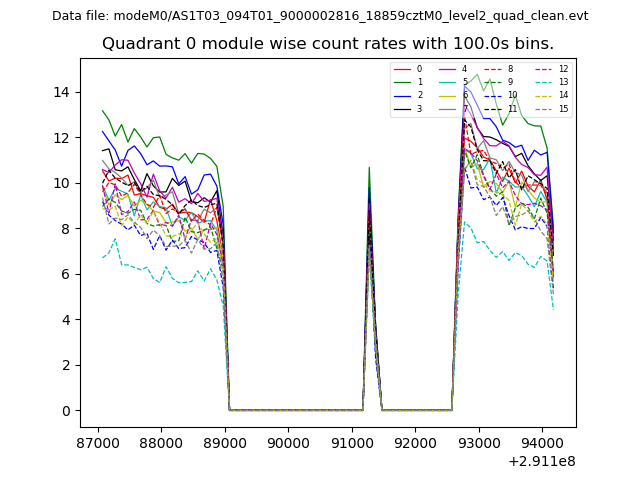 |
 |
| Module-wise count rates for Quadrant B Data is divided into 100 sec bins |
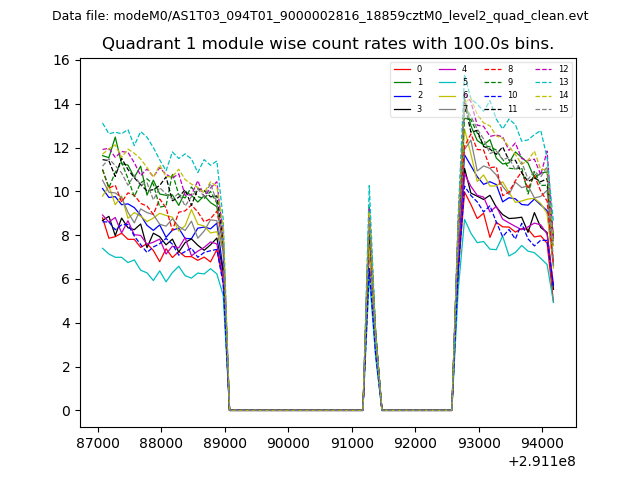 |
 |
| Module-wise count rates for Quadrant C Data is divided into 100 sec bins |
 |
 |
| Module-wise count rates for Quadrant D Data is divided into 100 sec bins |
 |
 |
| Parameter | Plot |
|---|---|
| CZT HV Monitor | 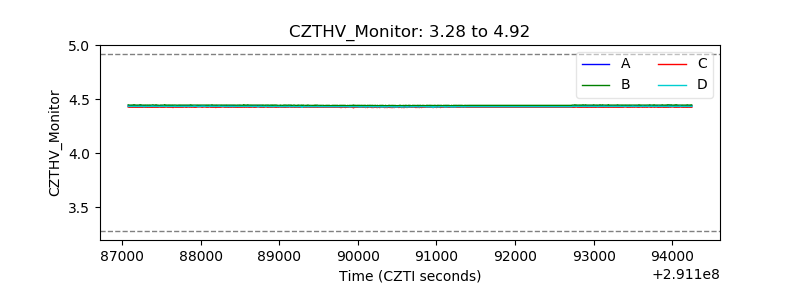 |
| D_VDD | 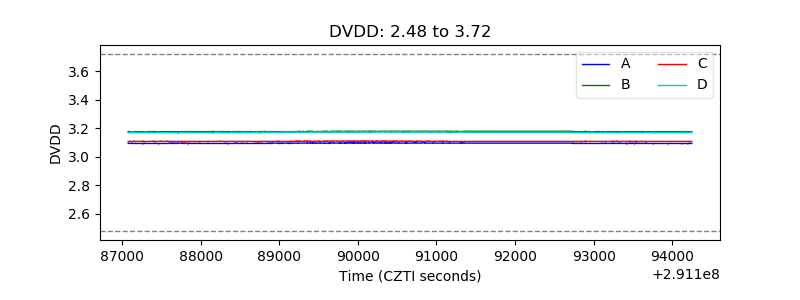 |
| Temperature 1 | 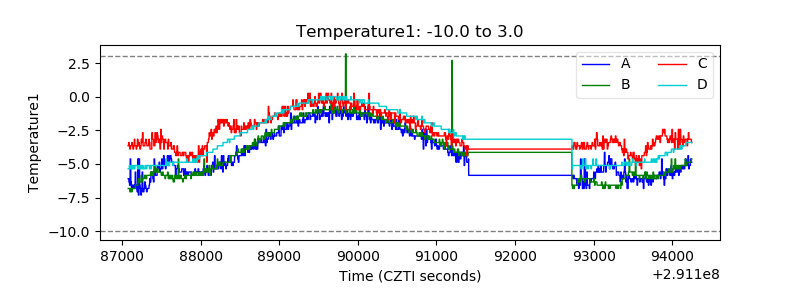 |
| Veto HV Monitor |  |
| Veto LLD | 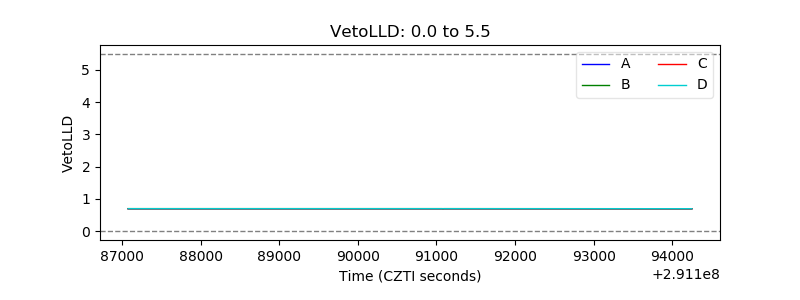 |
| Alpha Counter |  |
| _CPM_Rate | 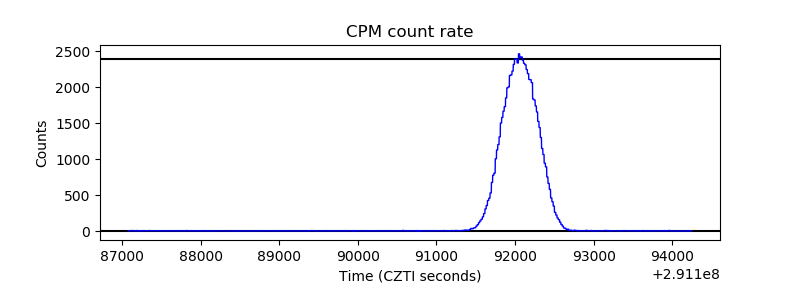 |
| CZT Counter | 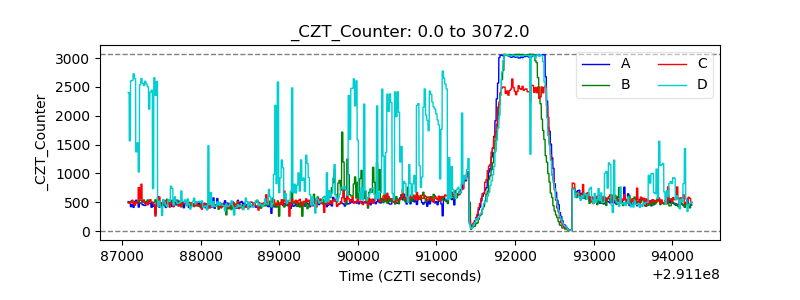 |
| +2.5 Volts monitor |  |
| +5 Volts monitor |  |
| _ROLL_ROT | 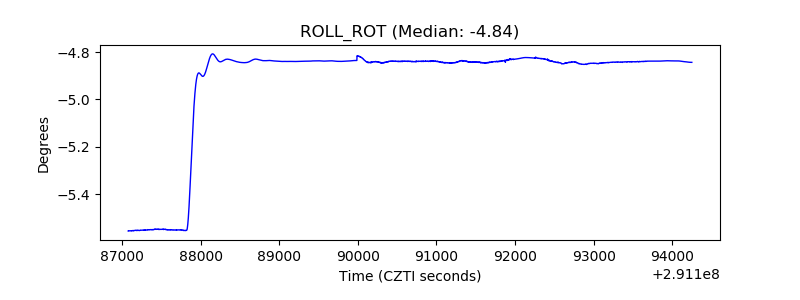 |
| _Roll_DEC | 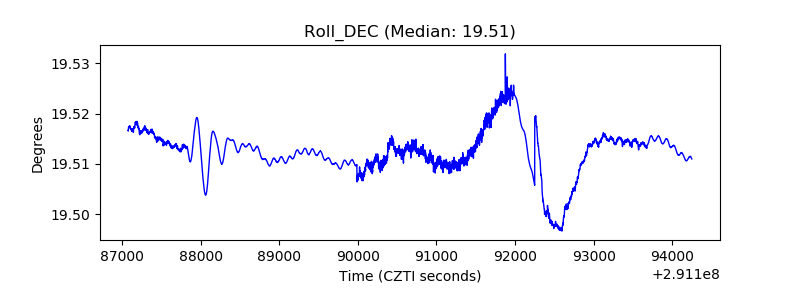 |
| _Roll_RA |  |
| Veto Counter | 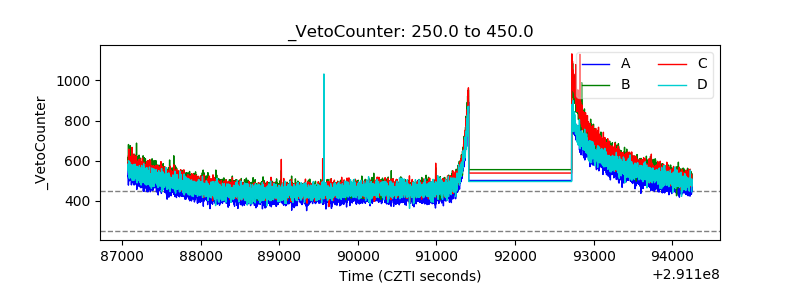 |