| Param | Original file | Final file |
|---|---|---|
| Filename | modeM0/AS1T03_094T01_9000002816_18860cztM0_level2.evt | modeM0/AS1T03_094T01_9000002816_18860cztM0_level2_quad_clean.evt |
| Size (bytes) | 488,969,280 | 93,202,560 |
| Size | 466.3 MB | 88.9 MB |
| Events in quadrant A | 3,179,786 | 613,257 |
| Events in quadrant B | 3,342,248 | 623,122 |
| Events in quadrant C | 3,725,108 | 588,997 |
| Events in quadrant D | 4,146,130 | 569,899 |
| Mode M9 | |||
|---|---|---|---|
| Quadrant | BADHDUFLAG | Total packets | Discarded packets |
| A | 0 | 13 | 0 |
| B | 0 | 13 | 0 |
| C | 0 | 13 | 0 |
| D | 0 | 13 | 0 |
| Mode SS | |||
|---|---|---|---|
| Quadrant | BADHDUFLAG | Total packets | Discarded packets |
| A | 0 | 124 | 0 |
| B | 0 | 124 | 0 |
| C | 0 | 124 | 0 |
| D | 0 | 124 | 0 |
| Mode M0 | |||
|---|---|---|---|
| Quadrant | BADHDUFLAG | Total packets | Discarded packets |
| A | 0 | 12816 | 1 |
| B | 0 | 13440 | 1 |
| C | 0 | 15026 | 1 |
| D | 0 | 16301 | 1 |
| Quadrant | Total seconds | Saturated seconds | Saturation percentage |
|---|---|---|---|
| A | 6123 | 31 | 0.506288% |
| B | 6123 | 58 | 0.947248% |
| C | 6123 | 94 | 1.535195% |
| D | 6124 | 179 | 2.922926% |
Noise dominated data is calculated using 1-second bins in cleaned event files. If a bin has >2000 counts, and if more than 50% of those come from <1% of pixels, then it is considered to be noise-dominated and hence unusable.
| Quadrant | # 1 sec bins | Bins with >0 counts | Bins with >2000 counts | High rate bins dominated by noise | Noise dominated (total time) | Noise dominated (detector-on time) | Marked lightcurve |
|---|---|---|---|---|---|---|---|
| A | 7463 | 6124 | 1 | 1 | 0.01% | 0.02% | 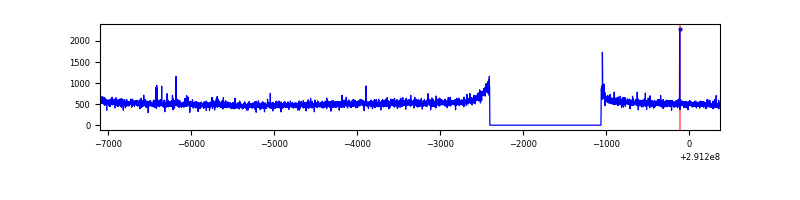 |
| B | 7463 | 6124 | 2 | 2 | 0.03% | 0.03% | 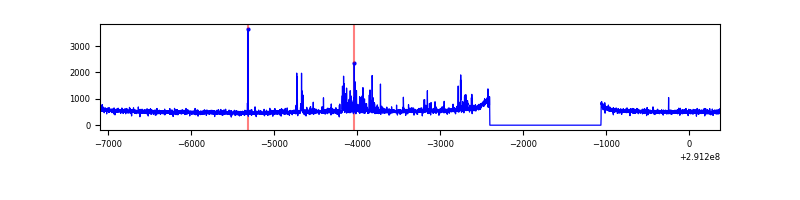 |
| C | 7463 | 6124 | 6 | 6 | 0.08% | 0.10% | 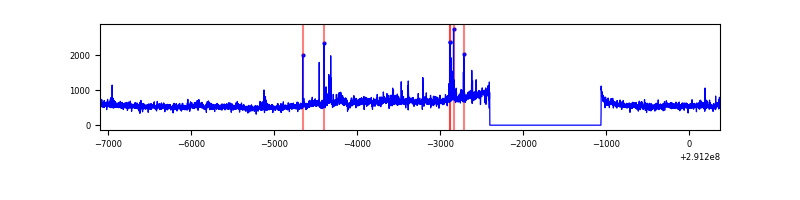 |
| D | 7464 | 6125 | 145 | 145 | 1.94% | 2.37% | 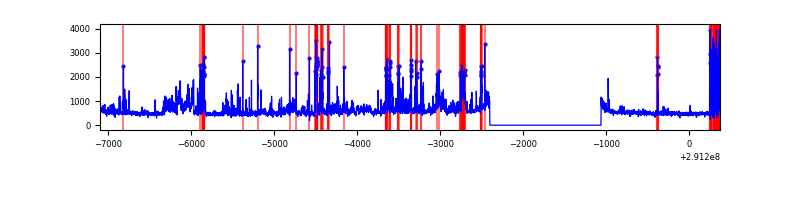 |
Top three noisy pixels from each quadrant. If the there are fewer than three noisy pixels in the level2.evt file, extra rows are filled as -1
| Pixel properties | Quadrant properties | ||||||
|---|---|---|---|---|---|---|---|
| Quadrant | DetID | PixID | Counts | Sigma | Mean | Median | Sigma |
| A | 4 | 2 | 17005 | 98.41 | 819 | 806 | 164.6 |
| A | 13 | 254 | 8355 | 45.86 | 819 | 806 | 164.6 |
| A | 0 | 226 | 7328 | 39.62 | 819 | 806 | 164.6 |
| B | 7 | 220 | 114039 | 735.59 | 813 | 794 | 154.0 |
| B | 12 | 111 | 16765 | 103.74 | 813 | 794 | 154.0 |
| B | 11 | 111 | 14447 | 88.68 | 813 | 794 | 154.0 |
| C | 3 | 233 | 490987 | 2743.52 | 774 | 779 | 178.7 |
| C | 14 | 238 | 122428 | 680.83 | 774 | 779 | 178.7 |
| C | 5 | 112 | 92467 | 513.14 | 774 | 779 | 178.7 |
| D | 7 | 238 | 513325 | 2721.77 | 779 | 758 | 188.3 |
| D | 9 | 1 | 252232 | 1335.35 | 779 | 758 | 188.3 |
| D | 1 | 52 | 232336 | 1229.7 | 779 | 758 | 188.3 |
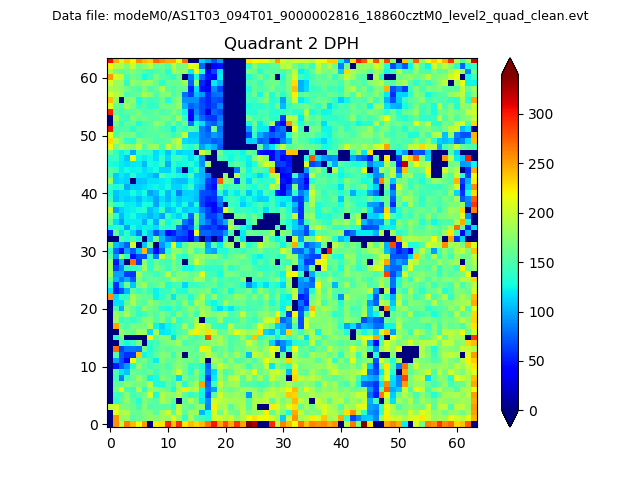
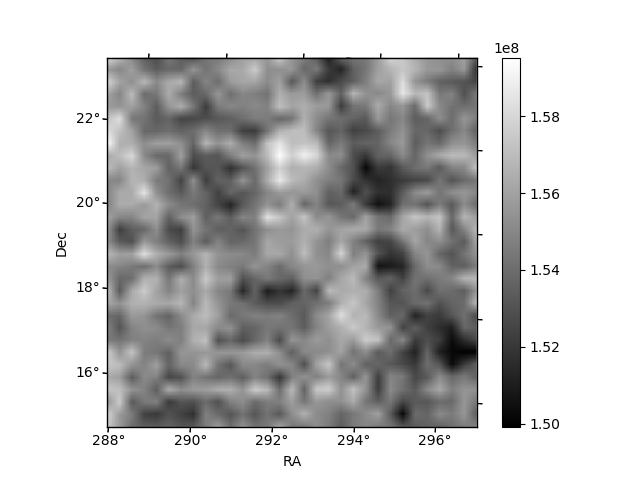
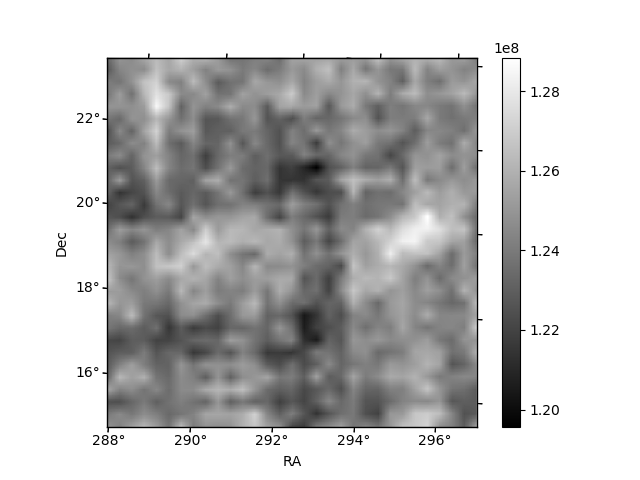
Histogram calculated using DETX and DETY for each event in the final _common_clean file
| Quadrant A | 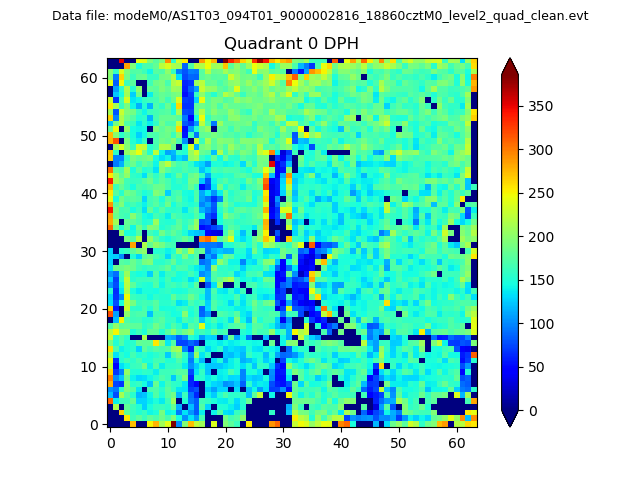 |
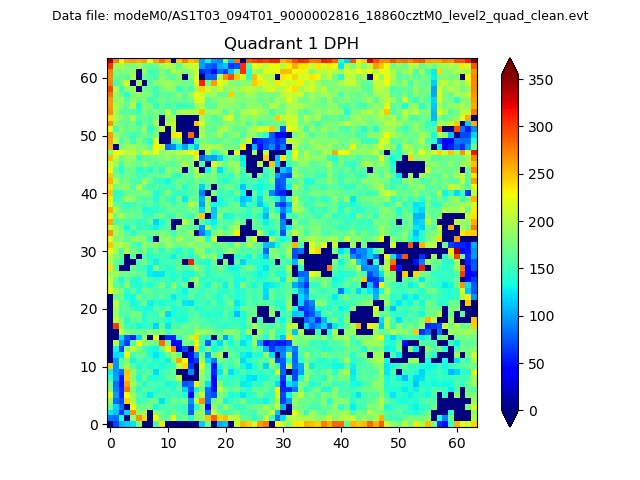 |
Quadrant B |
|---|---|---|---|
| Quadrant D | 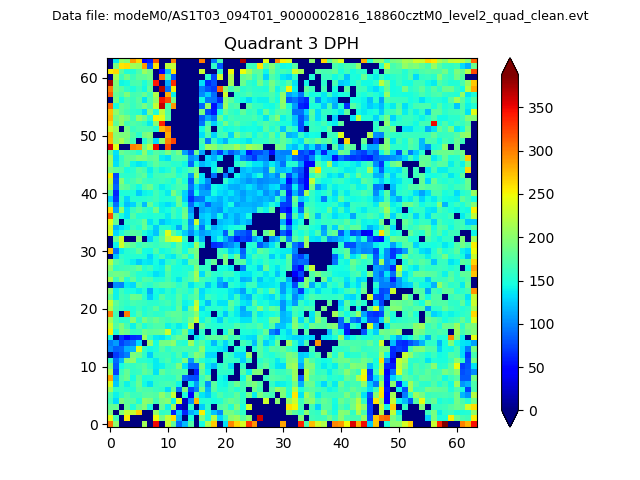 |
 |
Quadrant C |
| Plot type | Count rate plots | Images |
|---|---|---|
| Comparison with Poisson distribution Blue bars denote a histogram of data divided into 1 sec bins. Red curve is a Poisson curve with rate = median count rate of data. |
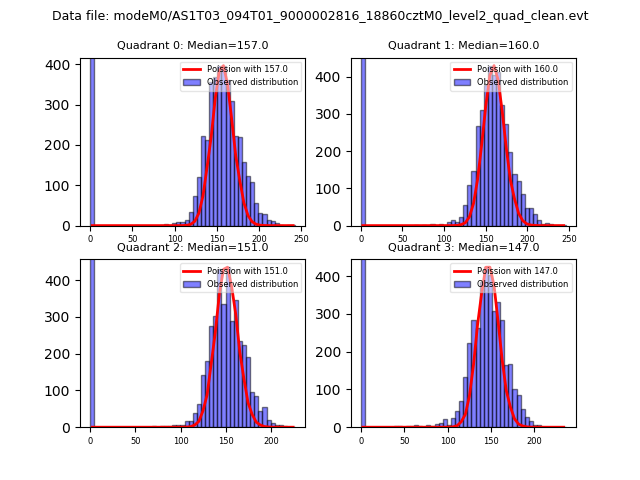 |
 |
| Quadrant-wise count rates Data is divided into 100 sec bins |
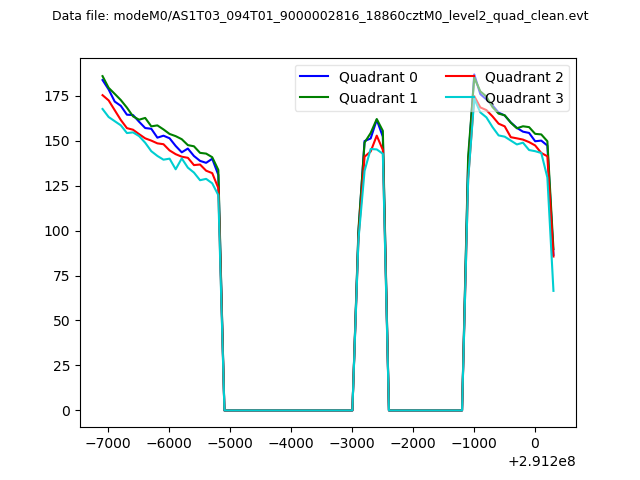 |
|
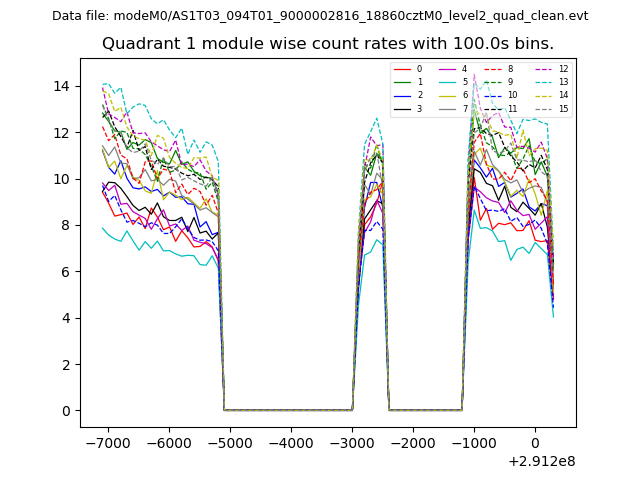
| Module-wise count rates for Quadrant A Data is divided into 100 sec bins |
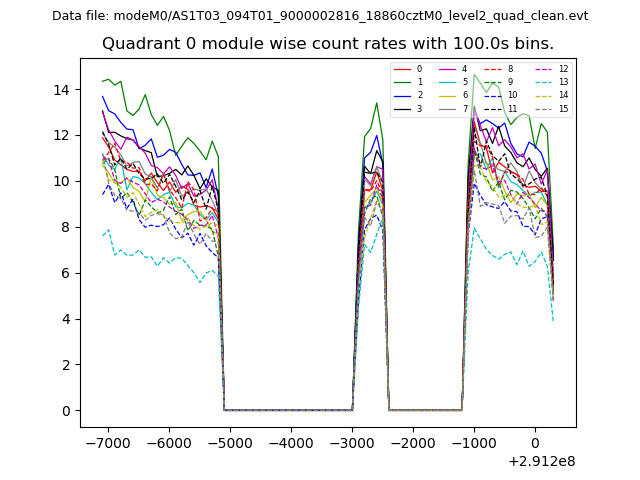 |
 |
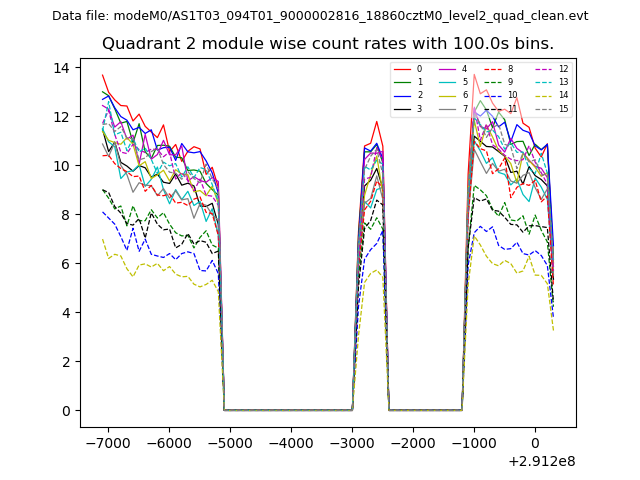
| Module-wise count rates for Quadrant B Data is divided into 100 sec bins |
 |
 |
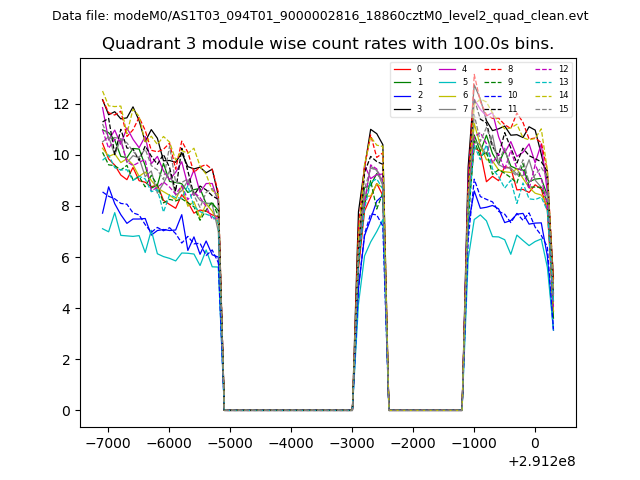
| Module-wise count rates for Quadrant C Data is divided into 100 sec bins |
 |
 |
| Module-wise count rates for Quadrant D Data is divided into 100 sec bins |
 |
 |
| Parameter | Plot |
|---|---|
| CZT HV Monitor | 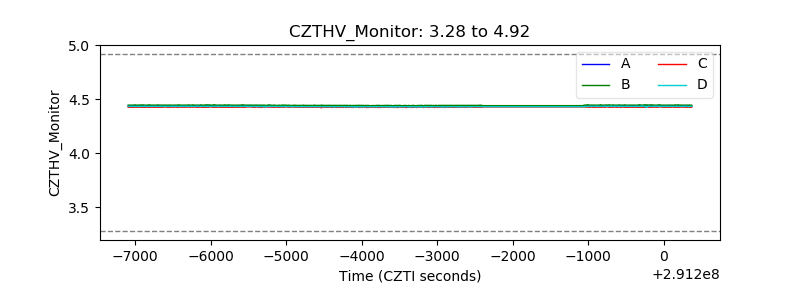 |
| D_VDD | 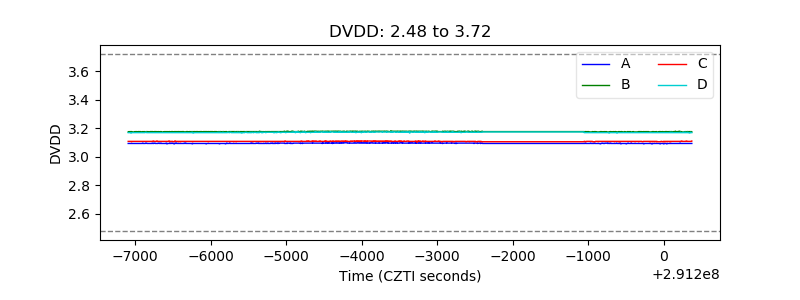 |
| Temperature 1 | 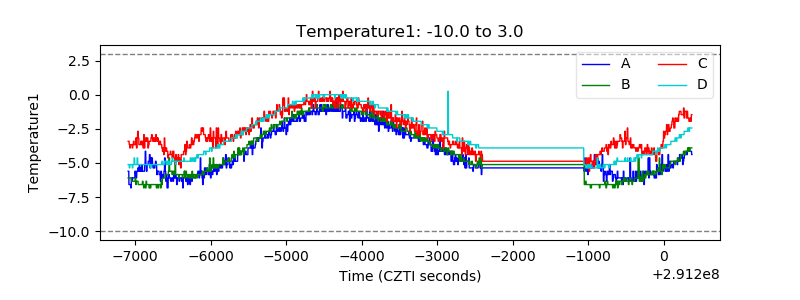 |
| Veto HV Monitor | 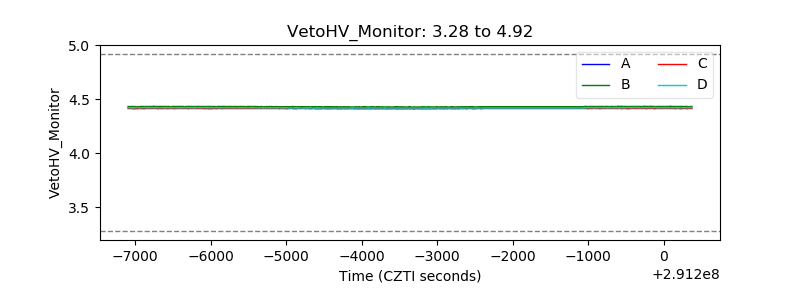 |
| Veto LLD | 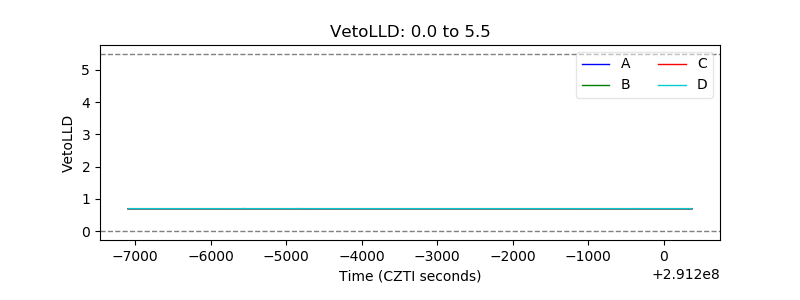 |
| Alpha Counter | 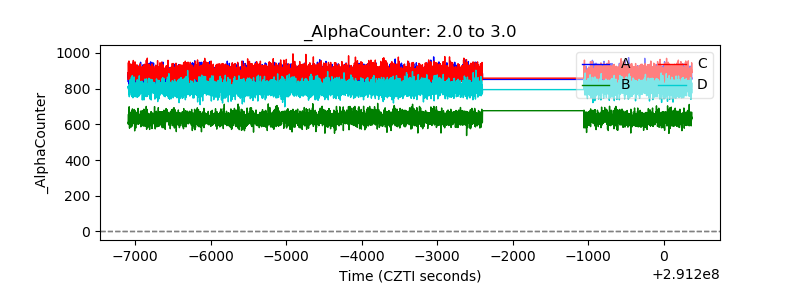 |
| _CPM_Rate | 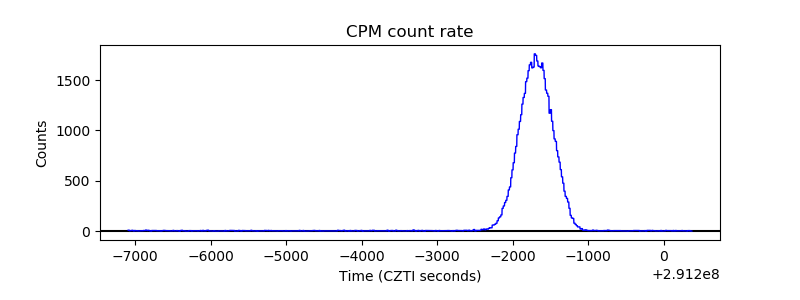 |
| CZT Counter |  |
| +2.5 Volts monitor |  |
| +5 Volts monitor |  |
| _ROLL_ROT | 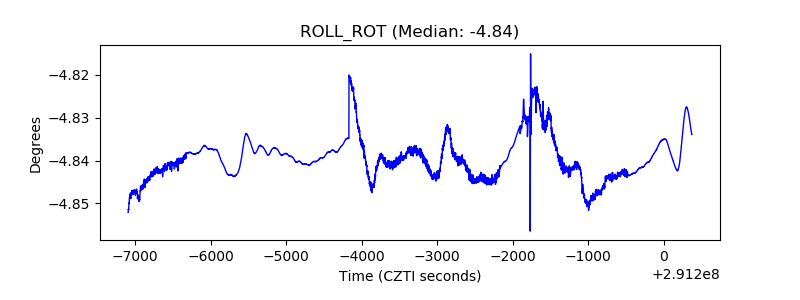 |
| _Roll_DEC |  |
| _Roll_RA |  |
| Veto Counter | 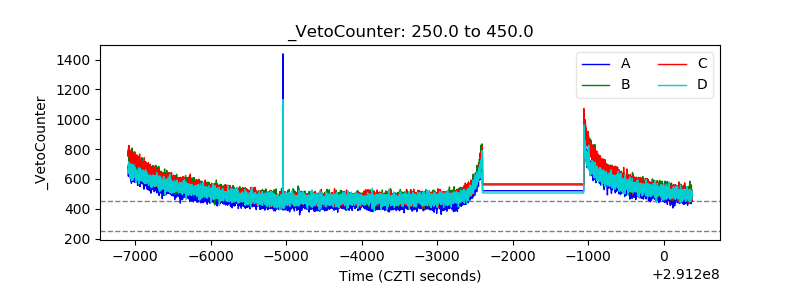 |