| Param | Original file | Final file |
|---|---|---|
| Filename | modeM0/AS1T03_094T01_9000002816_18861cztM0_level2.evt | modeM0/AS1T03_094T01_9000002816_18861cztM0_level2_quad_clean.evt |
| Size (bytes) | 488,669,760 | 93,473,280 |
| Size | 466.0 MB | 89.1 MB |
| Events in quadrant A | 3,204,670 | 612,454 |
| Events in quadrant B | 3,518,072 | 620,289 |
| Events in quadrant C | 3,684,189 | 590,671 |
| Events in quadrant D | 3,969,085 | 571,858 |
| Mode M9 | |||
|---|---|---|---|
| Quadrant | BADHDUFLAG | Total packets | Discarded packets |
| A | 0 | 13 | 0 |
| B | 0 | 13 | 0 |
| C | 0 | 13 | 0 |
| D | 0 | 13 | 0 |
| Mode SS | |||
|---|---|---|---|
| Quadrant | BADHDUFLAG | Total packets | Discarded packets |
| A | 0 | 126 | 0 |
| B | 0 | 126 | 0 |
| C | 0 | 126 | 0 |
| D | 0 | 126 | 0 |
| Mode M0 | |||
|---|---|---|---|
| Quadrant | BADHDUFLAG | Total packets | Discarded packets |
| A | 0 | 12976 | 1 |
| B | 0 | 14076 | 1 |
| C | 0 | 14504 | 1 |
| D | 0 | 15801 | 1 |
| Quadrant | Total seconds | Saturated seconds | Saturation percentage |
|---|---|---|---|
| A | 6242 | 33 | 0.528677% |
| B | 6243 | 89 | 1.425597% |
| C | 6243 | 168 | 2.691014% |
| D | 6243 | 113 | 1.810027% |
Noise dominated data is calculated using 1-second bins in cleaned event files. If a bin has >2000 counts, and if more than 50% of those come from <1% of pixels, then it is considered to be noise-dominated and hence unusable.
| Quadrant | # 1 sec bins | Bins with >0 counts | Bins with >2000 counts | High rate bins dominated by noise | Noise dominated (total time) | Noise dominated (detector-on time) | Marked lightcurve |
|---|---|---|---|---|---|---|---|
| A | 7547 | 6243 | 1 | 1 | 0.01% | 0.02% | 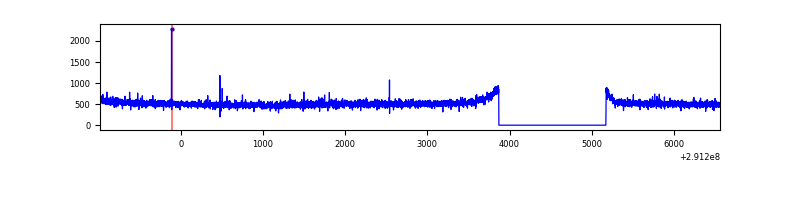 |
| B | 7548 | 6244 | 34 | 34 | 0.45% | 0.54% | 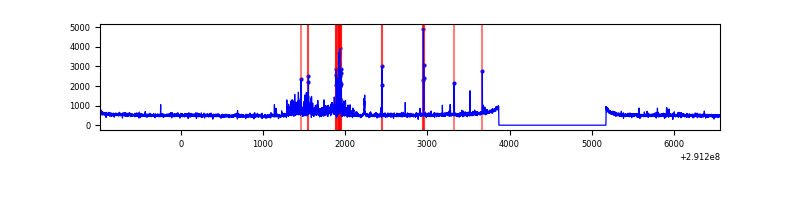 |
| C | 7548 | 6244 | 88 | 88 | 1.17% | 1.41% | 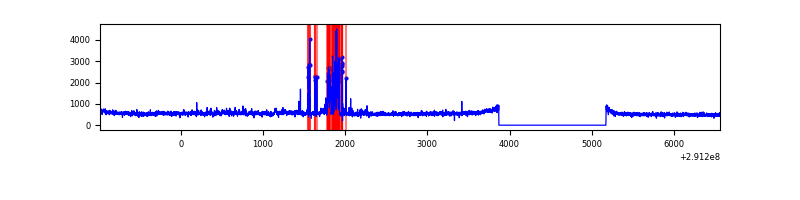 |
| D | 7548 | 6244 | 88 | 88 | 1.17% | 1.41% | 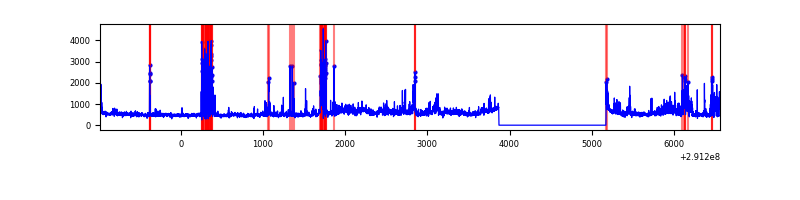 |
Top three noisy pixels from each quadrant. If the there are fewer than three noisy pixels in the level2.evt file, extra rows are filled as -1
| Pixel properties | Quadrant properties | ||||||
|---|---|---|---|---|---|---|---|
| Quadrant | DetID | PixID | Counts | Sigma | Mean | Median | Sigma |
| A | 13 | 254 | 7937 | 42.87 | 828 | 813 | 166.2 |
| A | 0 | 226 | 7373 | 39.47 | 828 | 813 | 166.2 |
| A | 4 | 2 | 7278 | 38.9 | 828 | 813 | 166.2 |
| B | 7 | 220 | 225970 | 1469.98 | 814 | 797 | 153.2 |
| B | 0 | 245 | 26892 | 170.35 | 814 | 797 | 153.2 |
| B | 12 | 111 | 17147 | 106.74 | 814 | 797 | 153.2 |
| C | 0 | 207 | 302083 | 1676.29 | 776 | 782 | 179.7 |
| C | 3 | 233 | 215098 | 1192.35 | 776 | 782 | 179.7 |
| C | 14 | 238 | 121614 | 672.25 | 776 | 782 | 179.7 |
| D | 7 | 238 | 403888 | 2099.72 | 795 | 774 | 192.0 |
| D | 1 | 52 | 307766 | 1599.05 | 795 | 774 | 192.0 |
| D | 9 | 1 | 158276 | 820.39 | 795 | 774 | 192.0 |
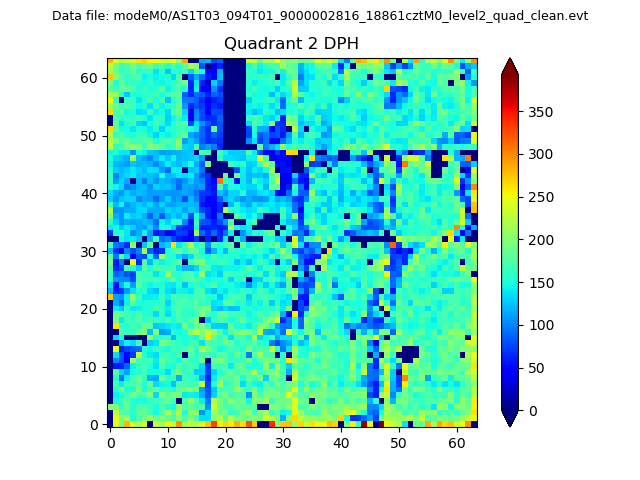
Histogram calculated using DETX and DETY for each event in the final _common_clean file
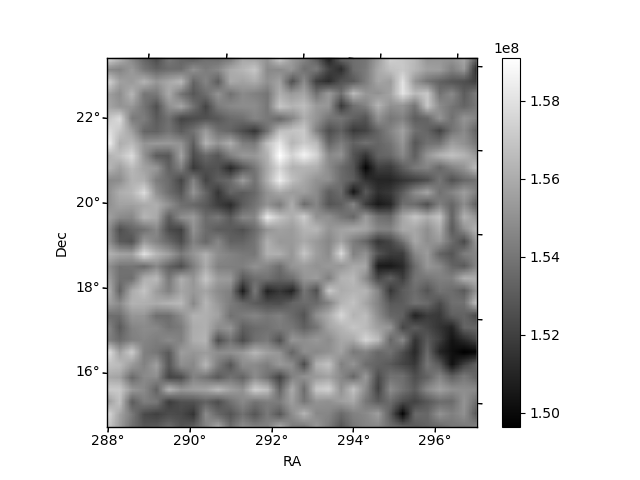
| Quadrant A | 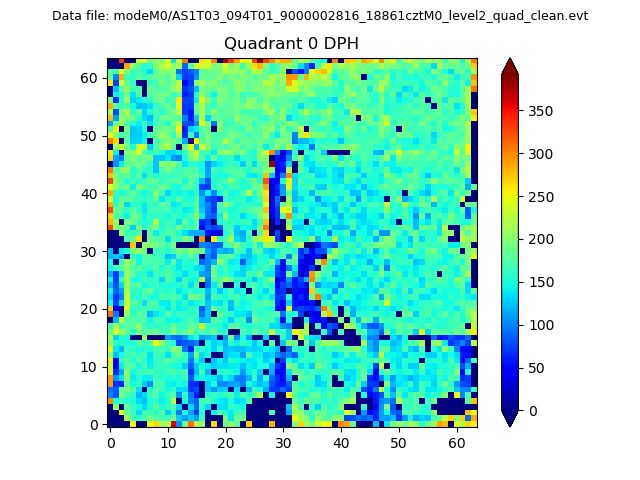 |
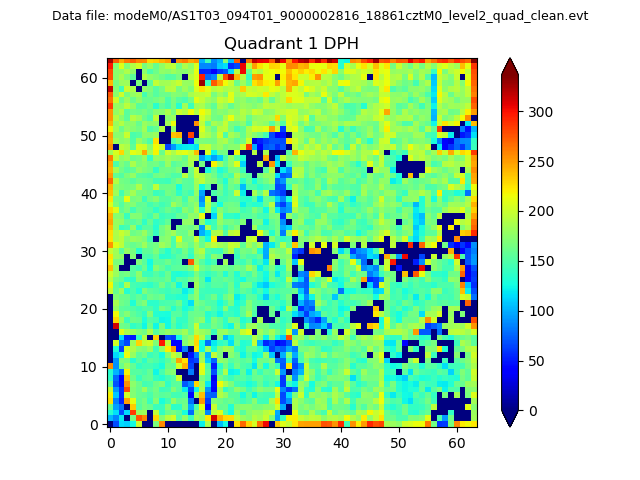 |
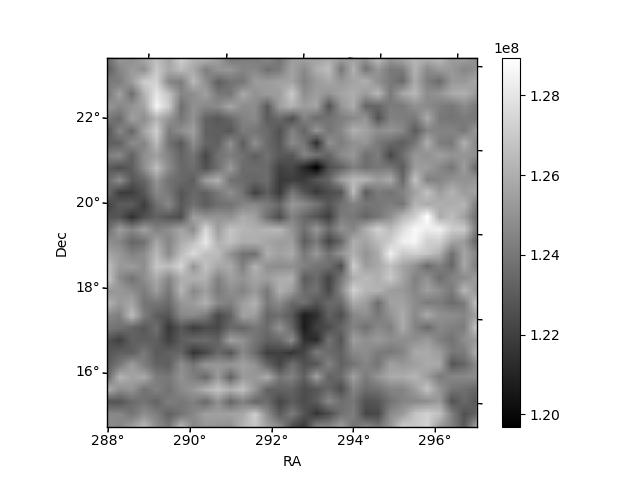
Quadrant B |
|---|---|---|---|
| Quadrant D | 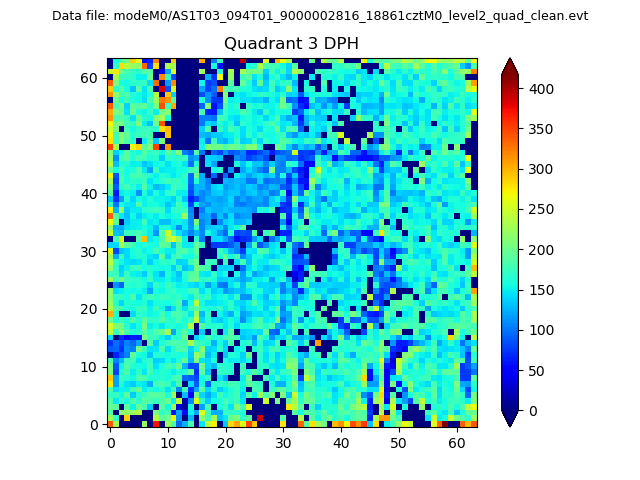 |
 |
Quadrant C |
| Plot type | Count rate plots | Images |
|---|---|---|
| Comparison with Poisson distribution Blue bars denote a histogram of data divided into 1 sec bins. Red curve is a Poisson curve with rate = median count rate of data. |
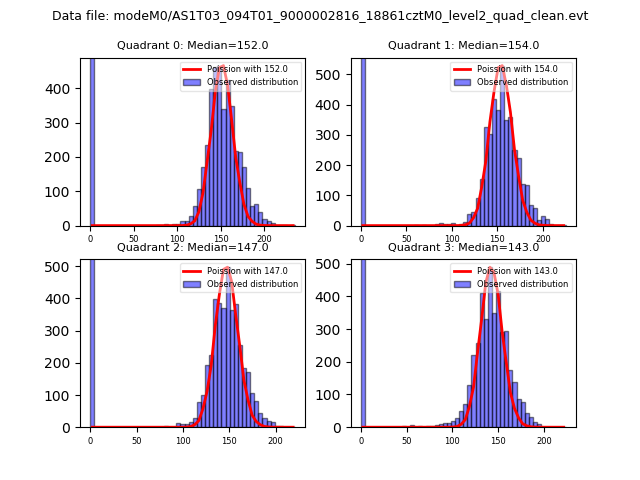 |
 |
| Quadrant-wise count rates Data is divided into 100 sec bins |
 |
|
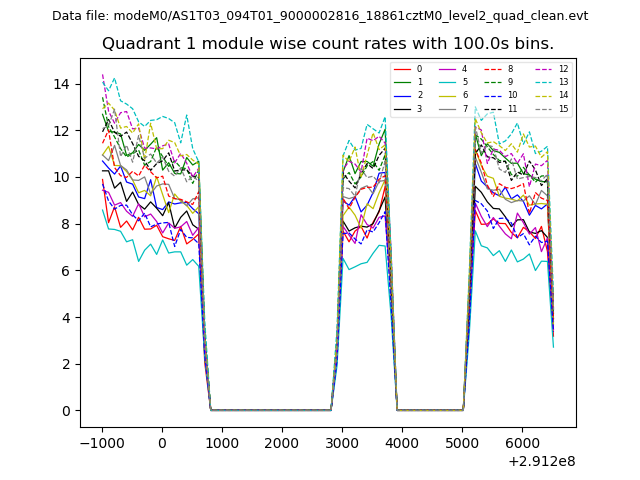
| Module-wise count rates for Quadrant A Data is divided into 100 sec bins |
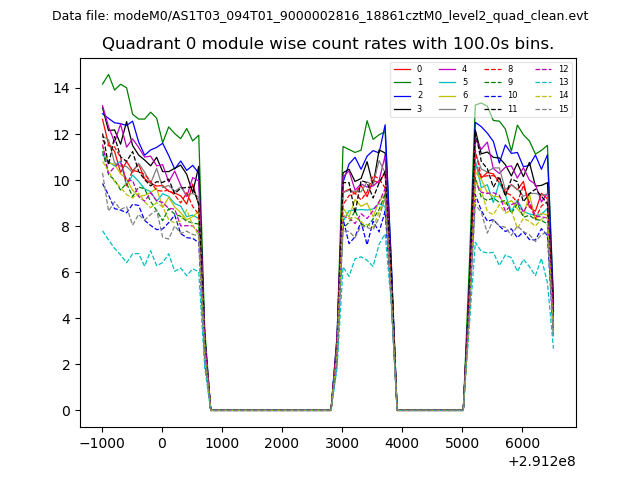 |
 |
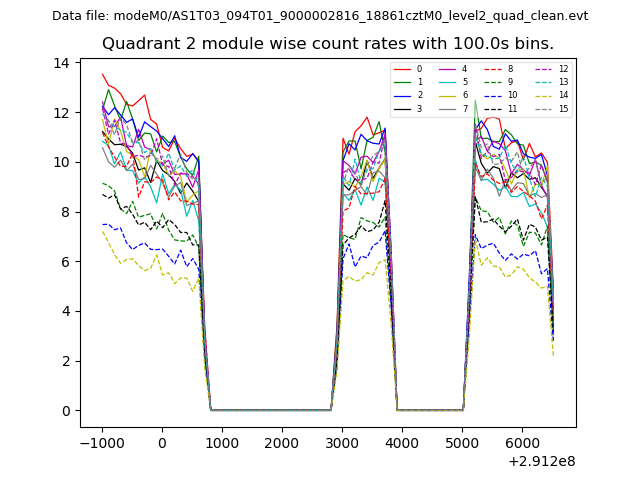
| Module-wise count rates for Quadrant B Data is divided into 100 sec bins |
 |
 |
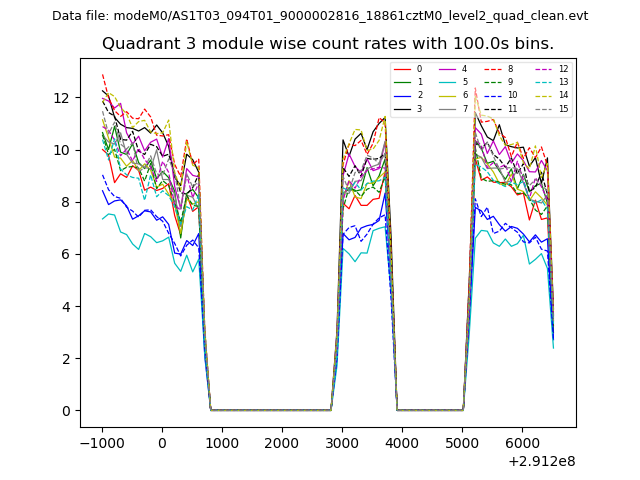
| Module-wise count rates for Quadrant C Data is divided into 100 sec bins |
 |
 |
| Module-wise count rates for Quadrant D Data is divided into 100 sec bins |
 |
 |
| Parameter | Plot |
|---|---|
| CZT HV Monitor | 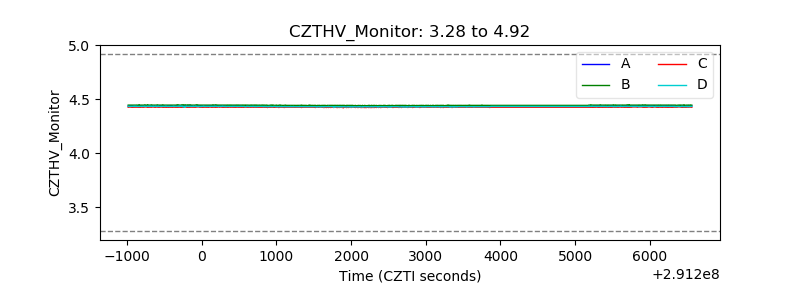 |
| D_VDD | 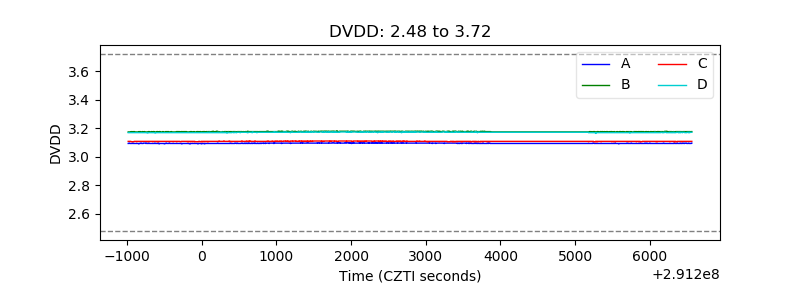 |
| Temperature 1 | 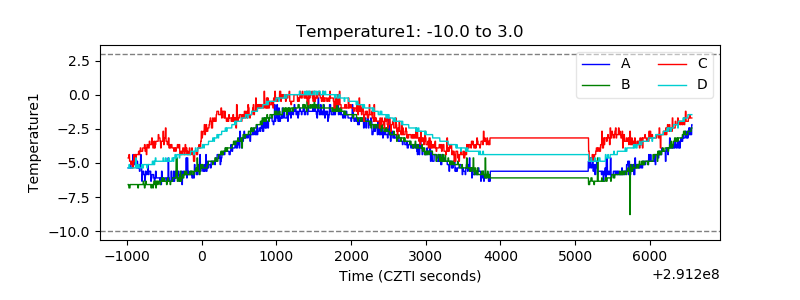 |
| Veto HV Monitor | 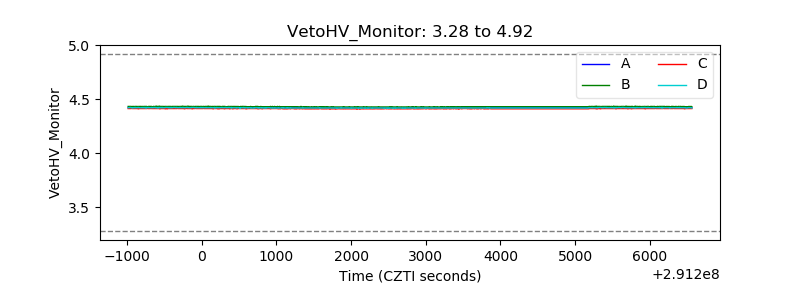 |
| Veto LLD | 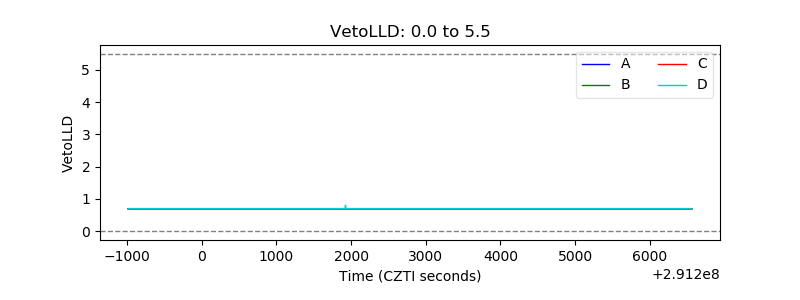 |
| Alpha Counter | 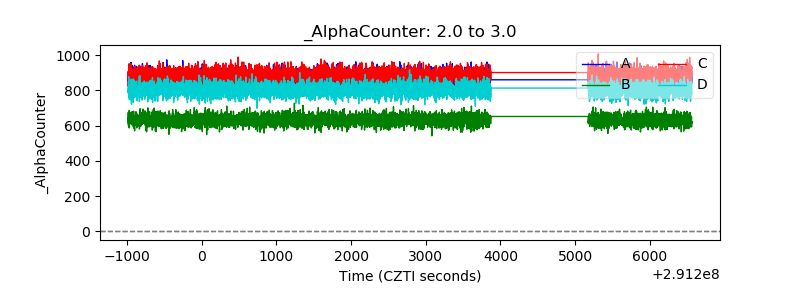 |
| _CPM_Rate | 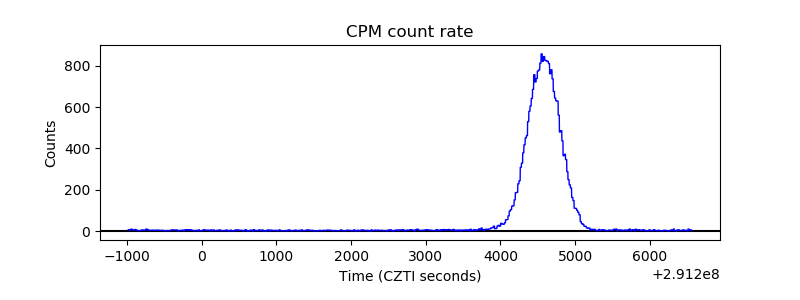 |
| CZT Counter | 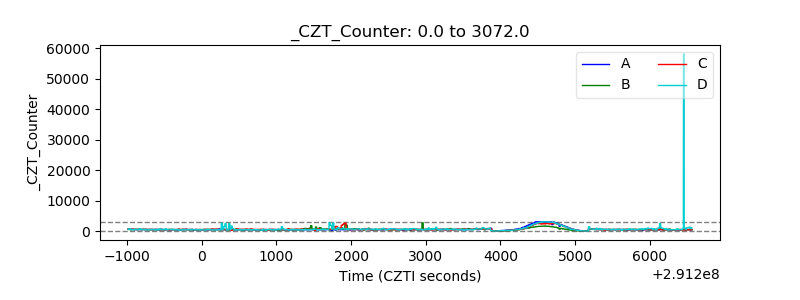 |
| +2.5 Volts monitor |  |
| +5 Volts monitor | 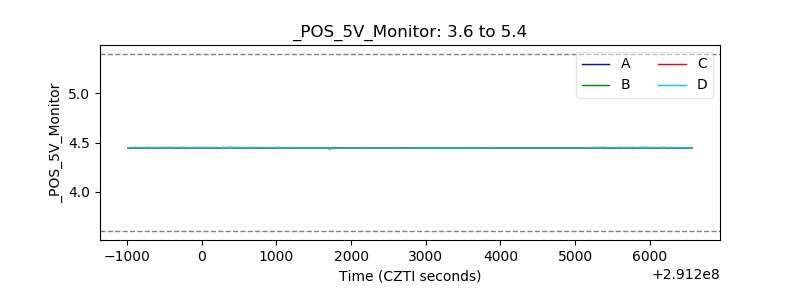 |
| _ROLL_ROT | 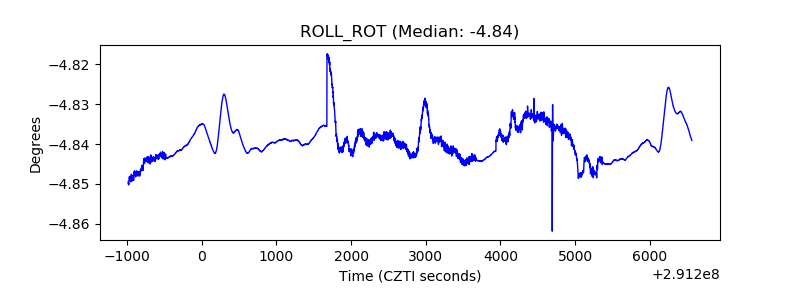 |
| _Roll_DEC |  |
| _Roll_RA | 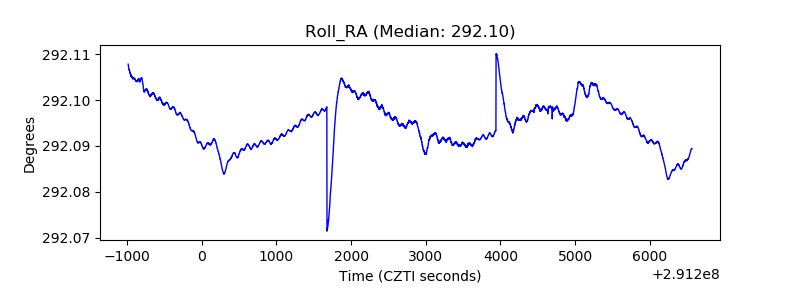 |
| Veto Counter | 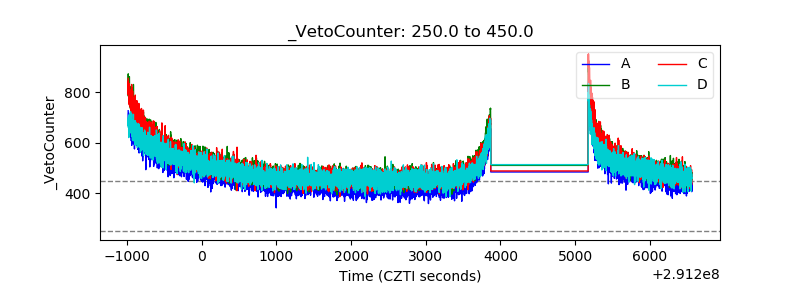 |