| Param | Original file | Final file |
|---|---|---|
| Filename | modeM0/AS1T03_094T01_9000002816_18862cztM0_level2.evt | modeM0/AS1T03_094T01_9000002816_18862cztM0_level2_quad_clean.evt |
| Size (bytes) | 512,968,320 | 86,273,280 |
| Size | 489.2 MB | 82.3 MB |
| Events in quadrant A | 3,199,306 | 553,401 |
| Events in quadrant B | 3,469,099 | 561,626 |
| Events in quadrant C | 3,270,744 | 536,396 |
| Events in quadrant D | 5,164,629 | 517,282 |
| Mode M9 | |||
|---|---|---|---|
| Quadrant | BADHDUFLAG | Total packets | Discarded packets |
| A | 0 | 11 | 0 |
| B | 0 | 11 | 0 |
| C | 0 | 11 | 0 |
| D | 0 | 11 | 0 |
| Mode SS | |||
|---|---|---|---|
| Quadrant | BADHDUFLAG | Total packets | Discarded packets |
| A | 0 | 130 | 0 |
| B | 0 | 130 | 0 |
| C | 0 | 130 | 0 |
| D | 0 | 130 | 0 |
| Mode M0 | |||
|---|---|---|---|
| Quadrant | BADHDUFLAG | Total packets | Discarded packets |
| A | 0 | 13164 | 1 |
| B | 0 | 14001 | 1 |
| C | 0 | 13262 | 1 |
| D | 0 | 19490 | 1 |
| Quadrant | Total seconds | Saturated seconds | Saturation percentage |
|---|---|---|---|
| A | 6363 | 93 | 1.461575% |
| B | 6364 | 121 | 1.901320% |
| C | 6364 | 110 | 1.728473% |
| D | 6364 | 368 | 5.782527% |
Noise dominated data is calculated using 1-second bins in cleaned event files. If a bin has >2000 counts, and if more than 50% of those come from <1% of pixels, then it is considered to be noise-dominated and hence unusable.
| Quadrant | # 1 sec bins | Bins with >0 counts | Bins with >2000 counts | High rate bins dominated by noise | Noise dominated (total time) | Noise dominated (detector-on time) | Marked lightcurve |
|---|---|---|---|---|---|---|---|
| A | 7393 | 6365 | 0 | 0 | 0.00% | 0.00% | 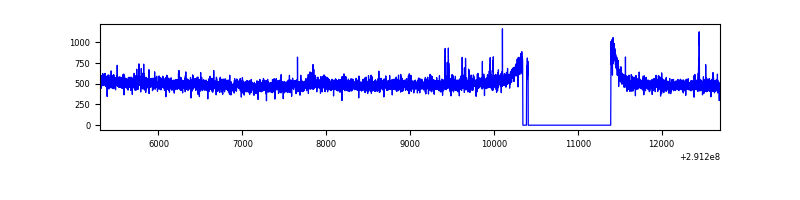 |
| B | 7394 | 6366 | 11 | 11 | 0.15% | 0.17% | 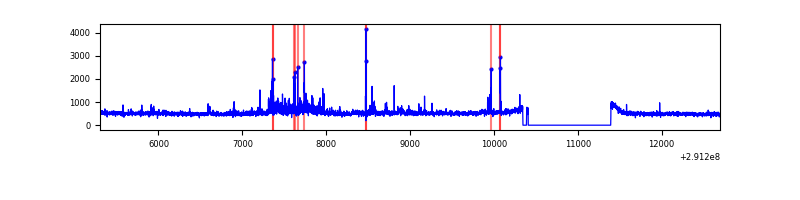 |
| C | 7394 | 6366 | 1 | 1 | 0.01% | 0.02% | 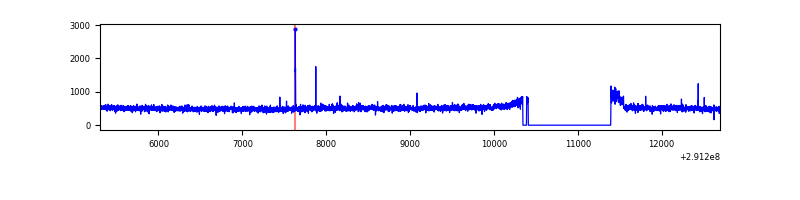 |
| D | 7394 | 6366 | 254 | 254 | 3.44% | 3.99% | 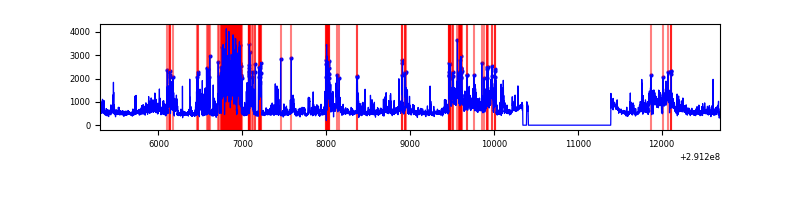 |
Top three noisy pixels from each quadrant. If the there are fewer than three noisy pixels in the level2.evt file, extra rows are filled as -1
| Pixel properties | Quadrant properties | ||||||
|---|---|---|---|---|---|---|---|
| Quadrant | DetID | PixID | Counts | Sigma | Mean | Median | Sigma |
| A | 4 | 2 | 12699 | 71.4 | 823 | 807 | 166.5 |
| A | 15 | 191 | 10207 | 56.44 | 823 | 807 | 166.5 |
| A | 13 | 254 | 9376 | 51.45 | 823 | 807 | 166.5 |
| B | 7 | 220 | 118824 | 763.84 | 812 | 793 | 154.5 |
| B | 0 | 189 | 41411 | 262.86 | 812 | 793 | 154.5 |
| B | 4 | 216 | 37106 | 235.0 | 812 | 793 | 154.5 |
| C | 14 | 238 | 120085 | 658.12 | 779 | 785 | 181.3 |
| C | 3 | 233 | 102579 | 561.55 | 779 | 785 | 181.3 |
| C | 0 | 207 | 13595 | 70.67 | 779 | 785 | 181.3 |
| D | 7 | 238 | 1741594 | 9087.14 | 786 | 764 | 191.6 |
| D | 1 | 52 | 201858 | 1049.71 | 786 | 764 | 191.6 |
| D | 7 | 38 | 103741 | 537.54 | 786 | 764 | 191.6 |
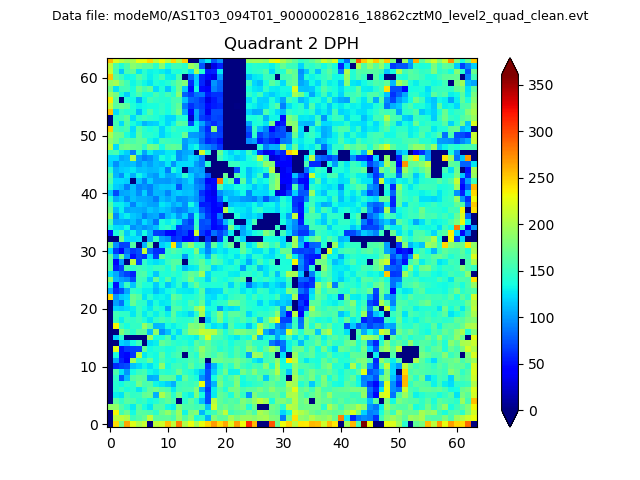
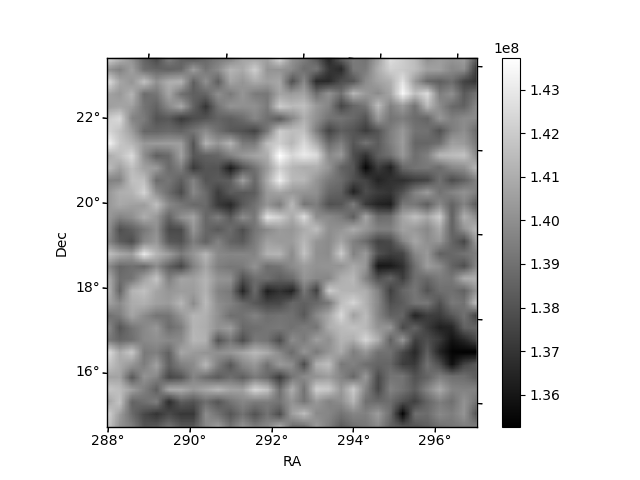
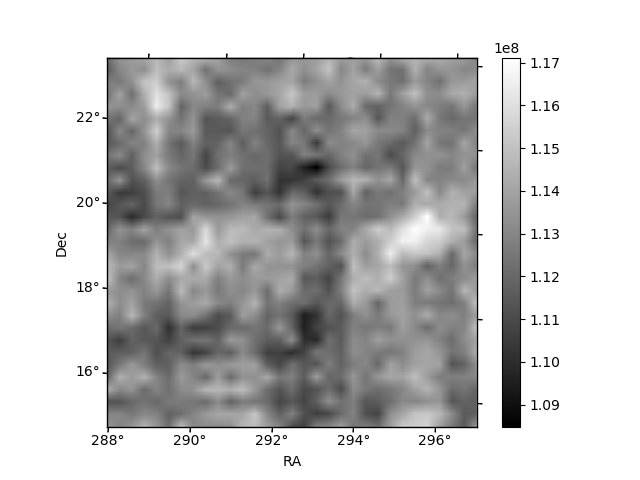
Histogram calculated using DETX and DETY for each event in the final _common_clean file
| Quadrant A | 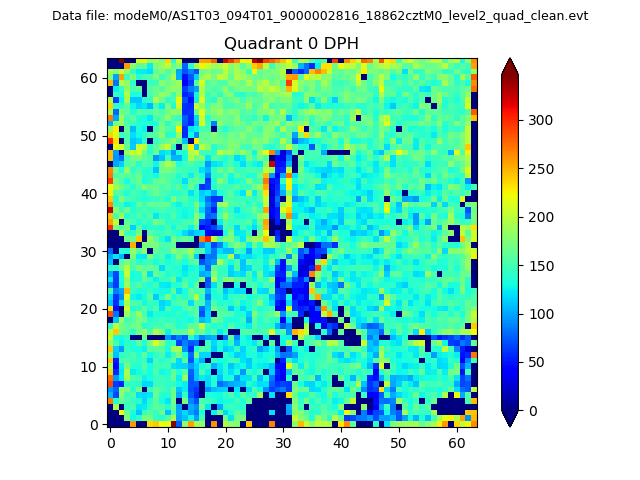 |
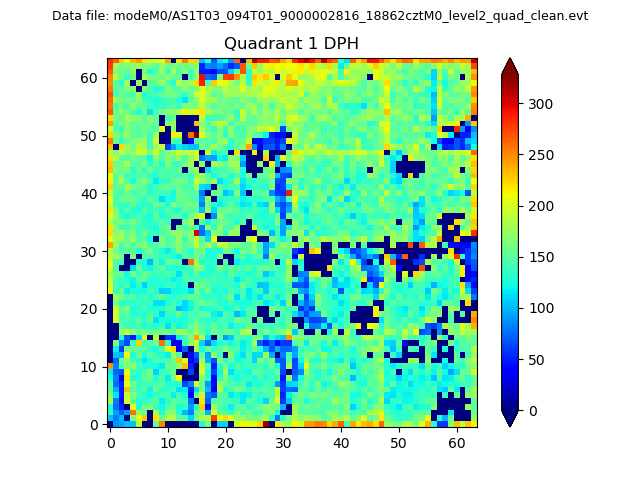 |
Quadrant B |
|---|---|---|---|
| Quadrant D | 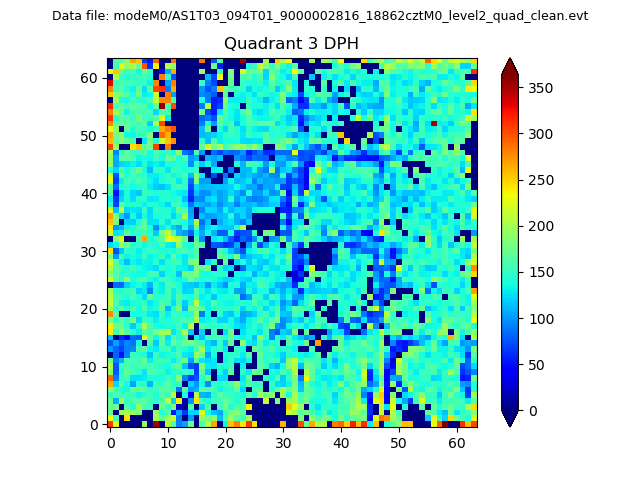 |
 |
Quadrant C |
| Plot type | Count rate plots | Images |
|---|---|---|
| Comparison with Poisson distribution Blue bars denote a histogram of data divided into 1 sec bins. Red curve is a Poisson curve with rate = median count rate of data. |
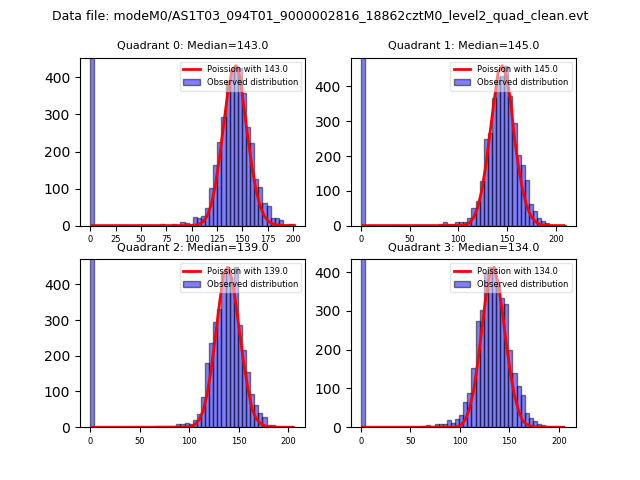 |
 |
| Quadrant-wise count rates Data is divided into 100 sec bins |
 |
|
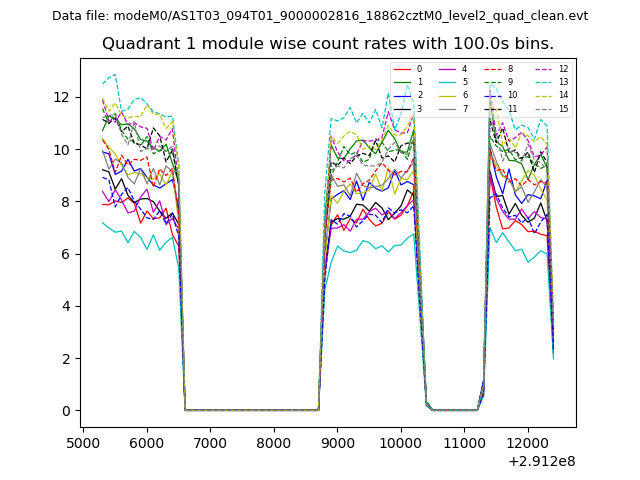
| Module-wise count rates for Quadrant A Data is divided into 100 sec bins |
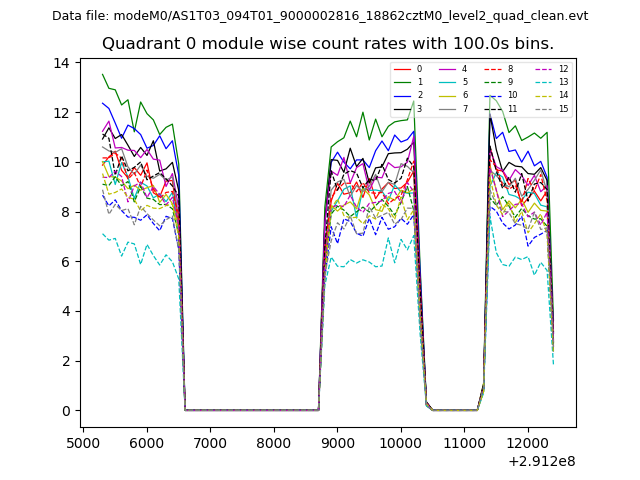 |
 |
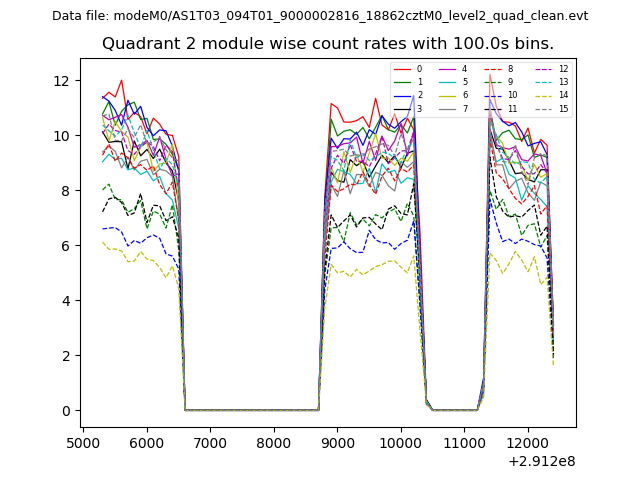
| Module-wise count rates for Quadrant B Data is divided into 100 sec bins |
 |
 |
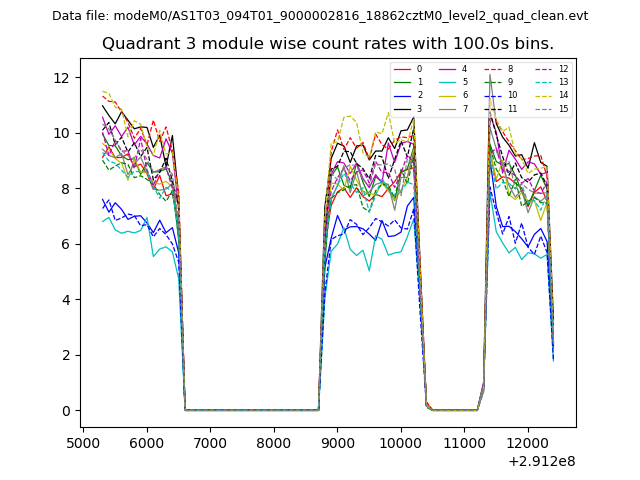
| Module-wise count rates for Quadrant C Data is divided into 100 sec bins |
 |
 |
| Module-wise count rates for Quadrant D Data is divided into 100 sec bins |
 |
 |
| Parameter | Plot |
|---|---|
| CZT HV Monitor | 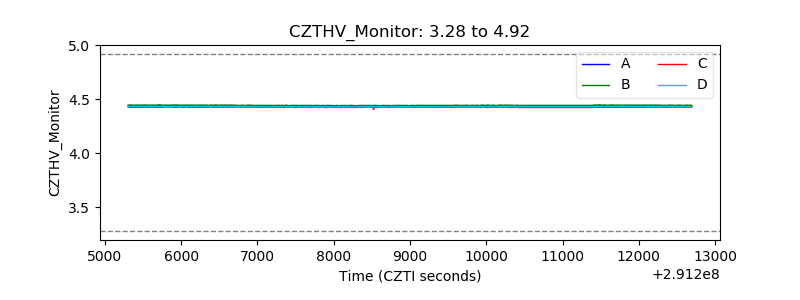 |
| D_VDD | 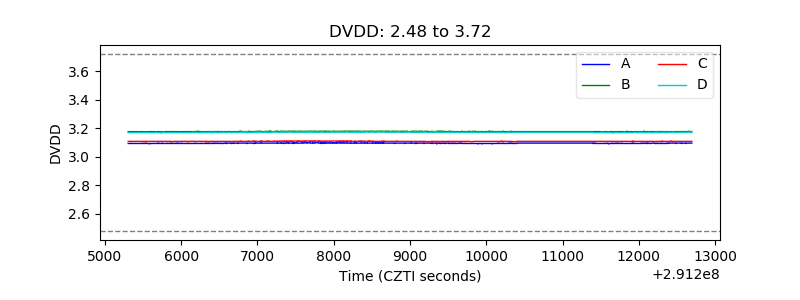 |
| Temperature 1 | 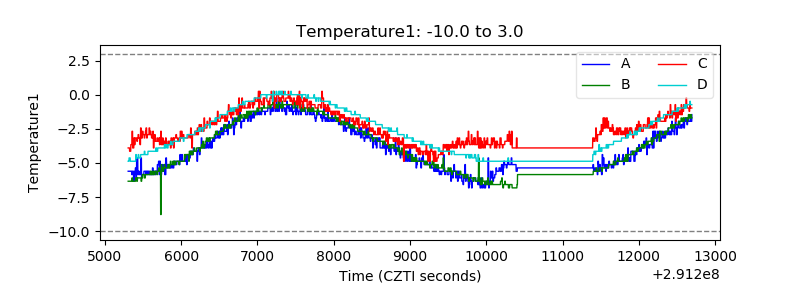 |
| Veto HV Monitor |  |
| Veto LLD | 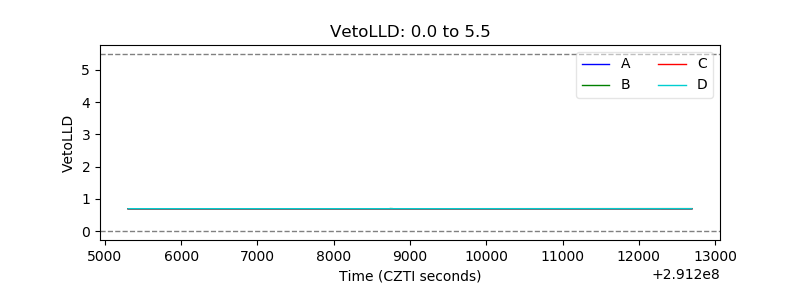 |
| Alpha Counter |  |
| _CPM_Rate | 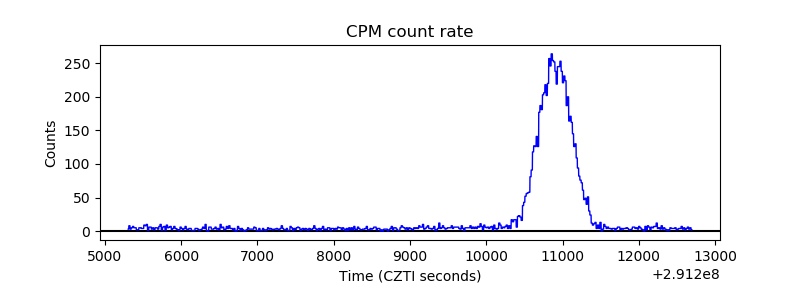 |
| CZT Counter | 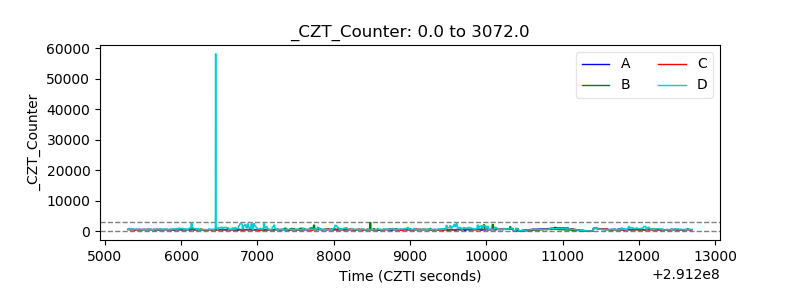 |
| +2.5 Volts monitor |  |
| +5 Volts monitor |  |
| _ROLL_ROT | 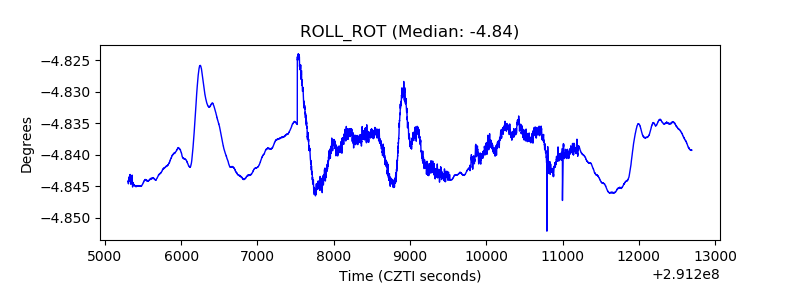 |
| _Roll_DEC | 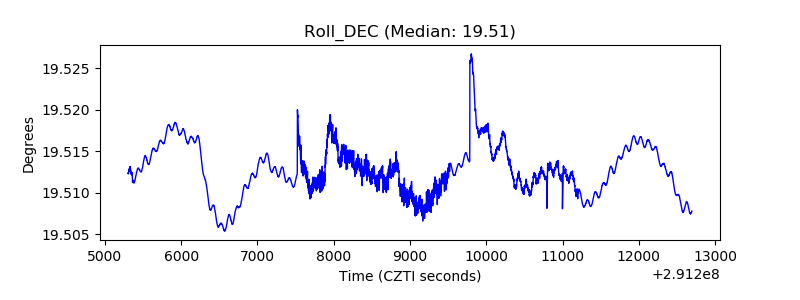 |
| _Roll_RA | 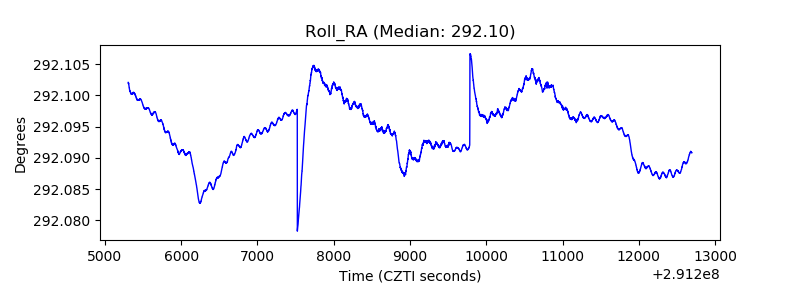 |
| Veto Counter | 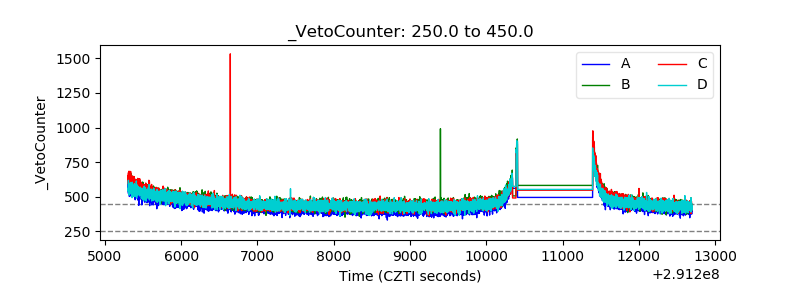 |