| Param | Original file | Final file |
|---|---|---|
| Filename | modeM0/AS1T03_094T01_9000002816_18864cztM0_level2.evt | modeM0/AS1T03_094T01_9000002816_18864cztM0_level2_quad_clean.evt |
| Size (bytes) | 605,747,520 | 86,736,960 |
| Size | 577.7 MB | 82.7 MB |
| Events in quadrant A | 3,859,755 | 531,628 |
| Events in quadrant B | 4,222,465 | 540,943 |
| Events in quadrant C | 4,028,311 | 514,625 |
| Events in quadrant D | 5,707,770 | 498,620 |
| Mode M9 | |||
|---|---|---|---|
| Quadrant | BADHDUFLAG | Total packets | Discarded packets |
| A | 0 | 2 | 0 |
| B | 0 | 2 | 0 |
| C | 0 | 2 | 0 |
| D | 0 | 2 | 0 |
| Mode SS | |||
|---|---|---|---|
| Quadrant | BADHDUFLAG | Total packets | Discarded packets |
| A | 0 | 158 | 0 |
| B | 0 | 158 | 0 |
| C | 0 | 158 | 0 |
| D | 0 | 158 | 0 |
| Mode M0 | |||
|---|---|---|---|
| Quadrant | BADHDUFLAG | Total packets | Discarded packets |
| A | 0 | 16336 | 2 |
| B | 0 | 17329 | 2 |
| C | 0 | 16782 | 2 |
| D | 0 | 22076 | 4 |
| Quadrant | Total seconds | Saturated seconds | Saturation percentage |
|---|---|---|---|
| A | 7768 | 191 | 2.458805% |
| B | 7769 | 241 | 3.102072% |
| C | 7769 | 258 | 3.320891% |
| D | 7768 | 559 | 7.196189% |
Noise dominated data is calculated using 1-second bins in cleaned event files. If a bin has >2000 counts, and if more than 50% of those come from <1% of pixels, then it is considered to be noise-dominated and hence unusable.
| Quadrant | # 1 sec bins | Bins with >0 counts | Bins with >2000 counts | High rate bins dominated by noise | Noise dominated (total time) | Noise dominated (detector-on time) | Marked lightcurve |
|---|---|---|---|---|---|---|---|
| A | 8013 | 7769 | 0 | 0 | 0.00% | 0.00% | 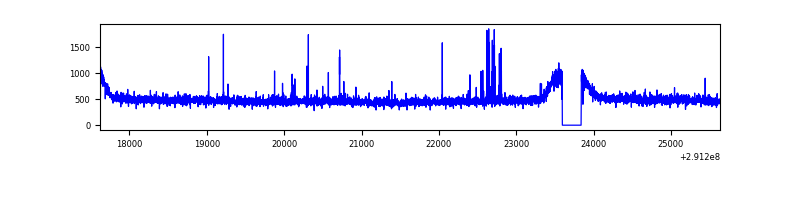 |
| B | 8014 | 7770 | 13 | 13 | 0.16% | 0.17% | 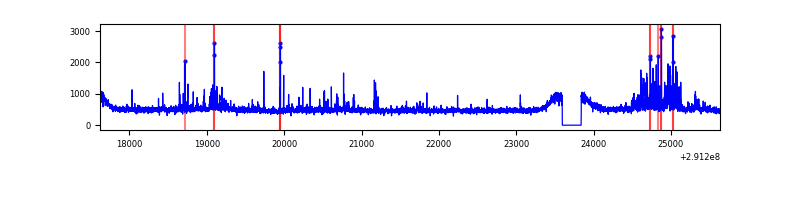 |
| C | 8014 | 7770 | 12 | 12 | 0.15% | 0.15% | 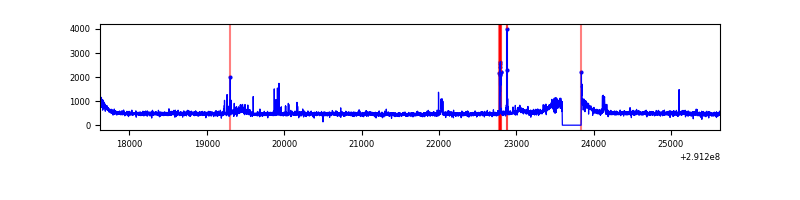 |
| D | 8013 | 7769 | 331 | 331 | 4.13% | 4.26% | 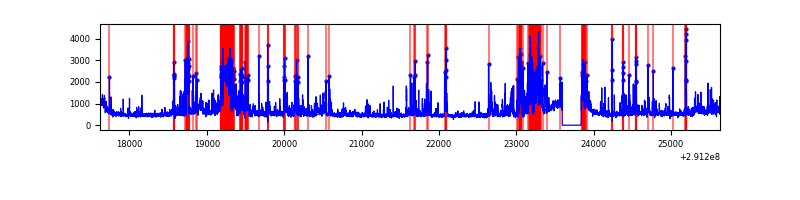 |
Top three noisy pixels from each quadrant. If the there are fewer than three noisy pixels in the level2.evt file, extra rows are filled as -1
| Pixel properties | Quadrant properties | ||||||
|---|---|---|---|---|---|---|---|
| Quadrant | DetID | PixID | Counts | Sigma | Mean | Median | Sigma |
| A | 6 | 16 | 34556 | 165.68 | 986 | 964 | 202.8 |
| A | 0 | 13 | 12926 | 59.0 | 986 | 964 | 202.8 |
| A | 13 | 254 | 10670 | 47.87 | 986 | 964 | 202.8 |
| B | 7 | 220 | 194499 | 1018.46 | 978 | 955 | 190.0 |
| B | 4 | 216 | 51848 | 267.81 | 978 | 955 | 190.0 |
| B | 12 | 111 | 22036 | 110.93 | 978 | 955 | 190.0 |
| C | 3 | 233 | 201405 | 899.96 | 937 | 940 | 222.7 |
| C | 14 | 238 | 142158 | 633.98 | 937 | 940 | 222.7 |
| C | 5 | 112 | 21609 | 92.79 | 937 | 940 | 222.7 |
| D | 7 | 238 | 822022 | 3566.72 | 941 | 914 | 230.2 |
| D | 14 | 34 | 434301 | 1882.54 | 941 | 914 | 230.2 |
| D | 12 | 1 | 343133 | 1486.52 | 941 | 914 | 230.2 |
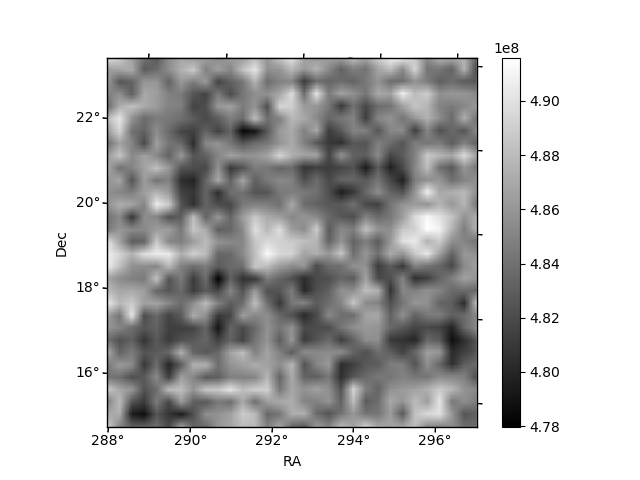
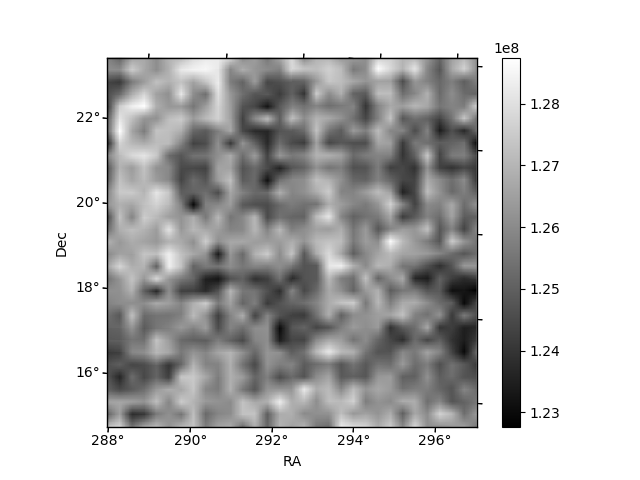
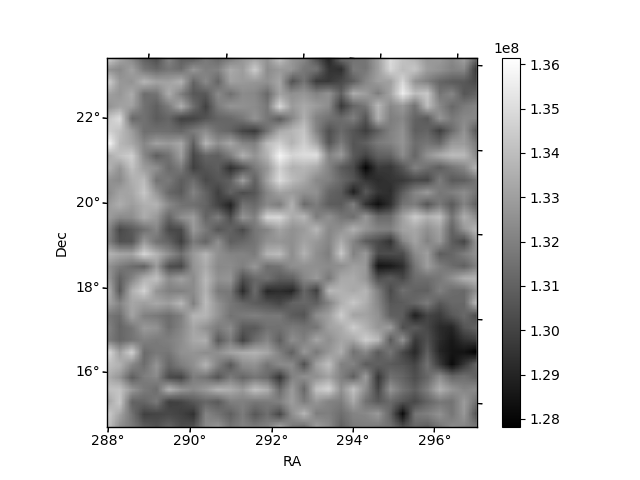
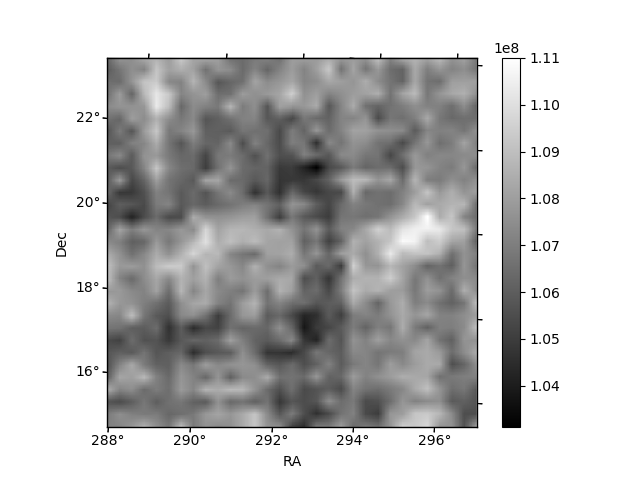
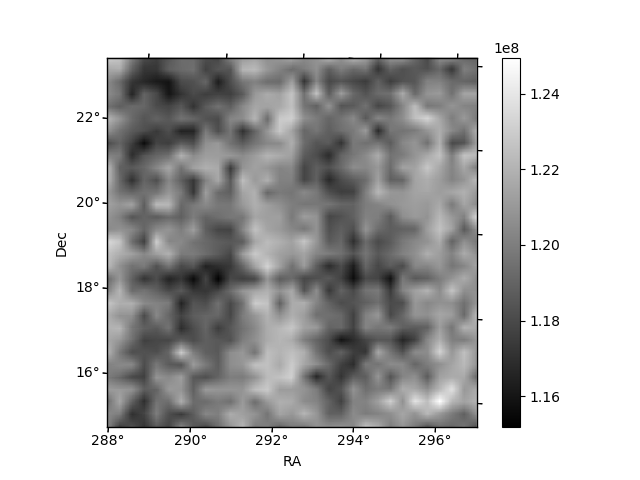
Histogram calculated using DETX and DETY for each event in the final _common_clean file
| Quadrant A | 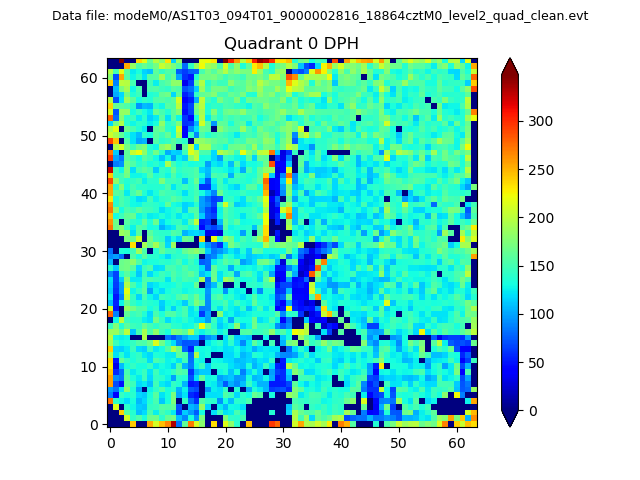 |
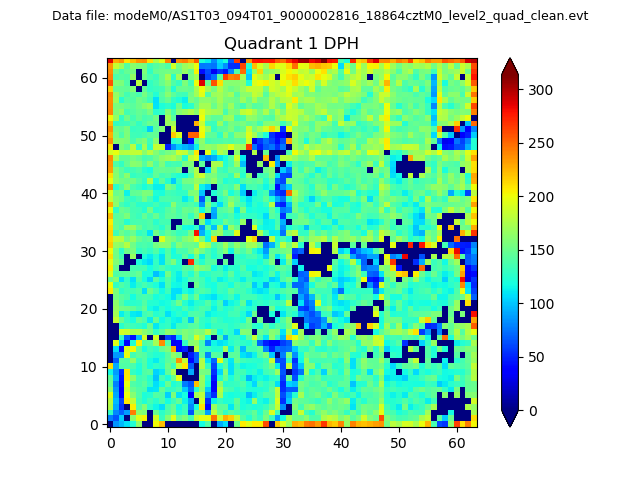 |
Quadrant B |
|---|---|---|---|
| Quadrant D | 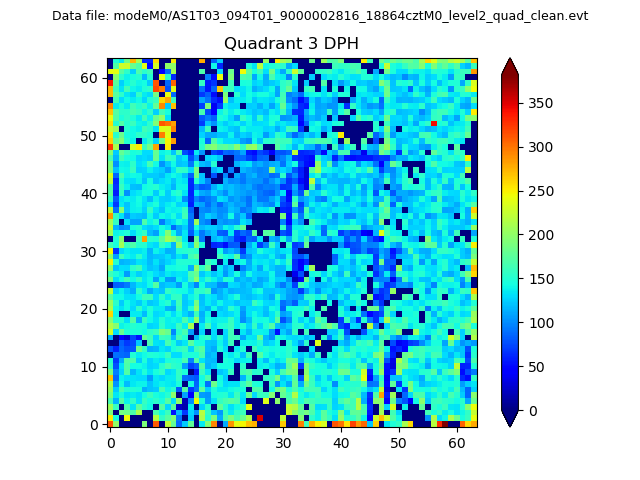 |
 |
Quadrant C |
| Plot type | Count rate plots | Images |
|---|---|---|
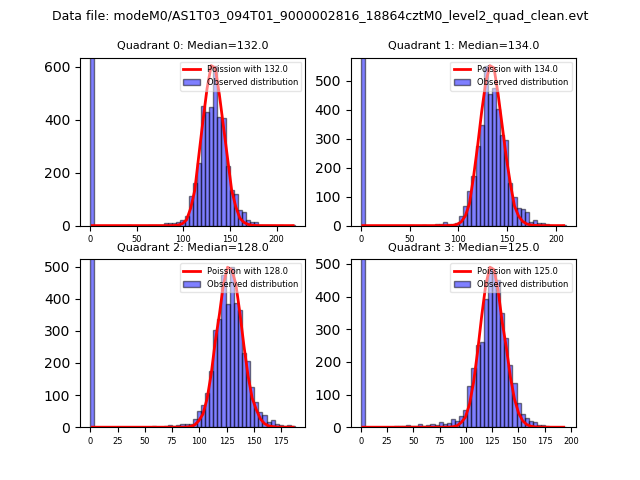
| Comparison with Poisson distribution Blue bars denote a histogram of data divided into 1 sec bins. Red curve is a Poisson curve with rate = median count rate of data. |
 |
 |
| Quadrant-wise count rates Data is divided into 100 sec bins |
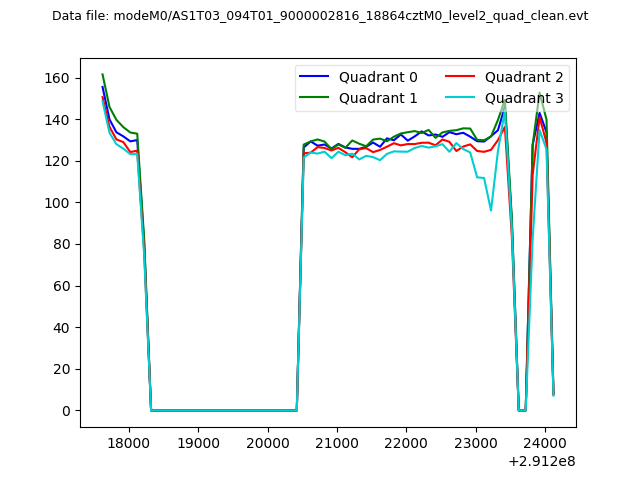 |
|
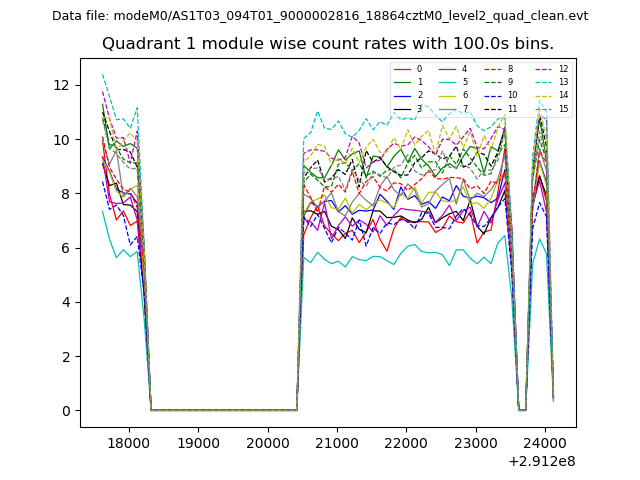
| Module-wise count rates for Quadrant A Data is divided into 100 sec bins |
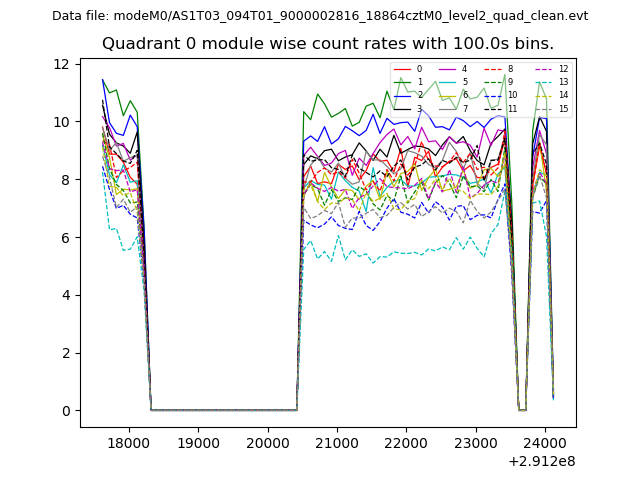 |
 |
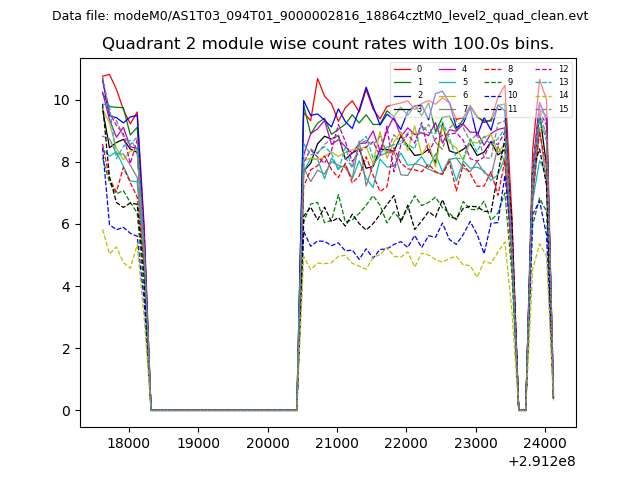
| Module-wise count rates for Quadrant B Data is divided into 100 sec bins |
 |
 |
| Module-wise count rates for Quadrant C Data is divided into 100 sec bins |
 |
 |
| Module-wise count rates for Quadrant D Data is divided into 100 sec bins |
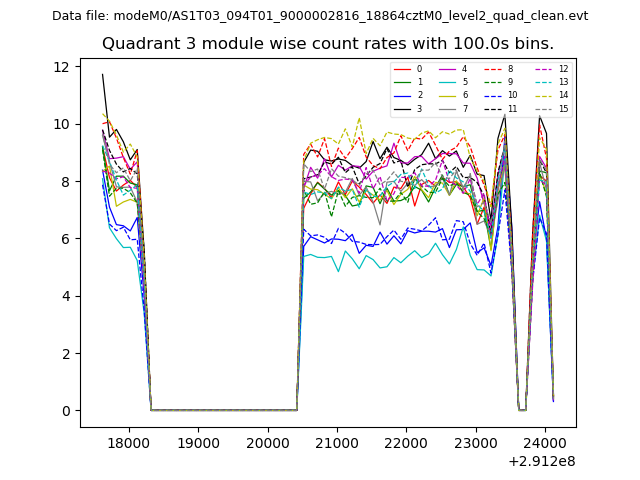 |
 |
| Parameter | Plot |
|---|---|
| CZT HV Monitor | 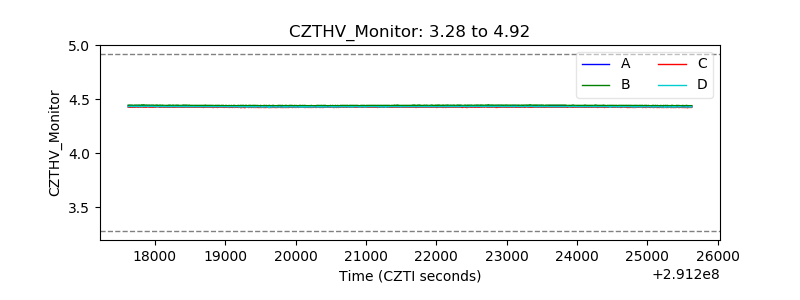 |
| D_VDD | 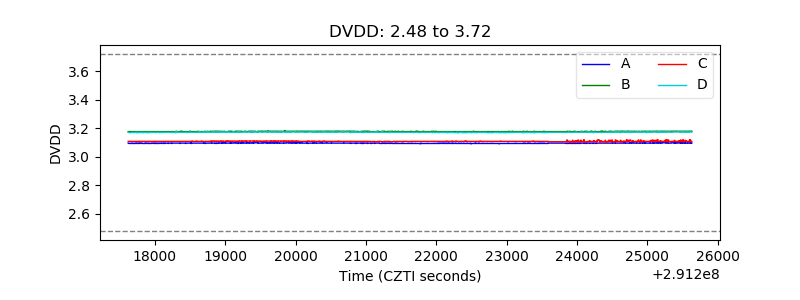 |
| Temperature 1 | 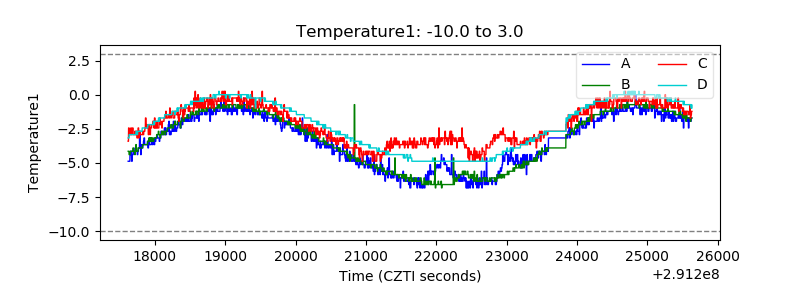 |
| Veto HV Monitor |  |
| Veto LLD | 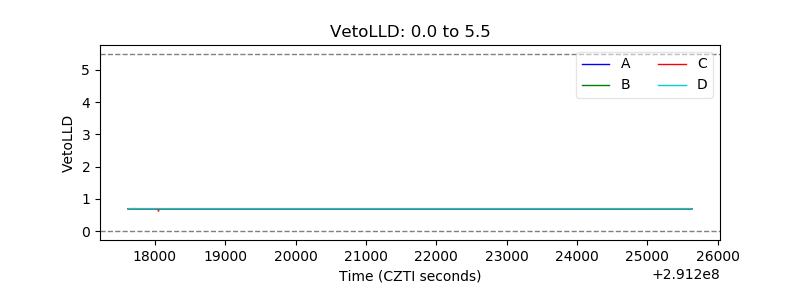 |
| Alpha Counter | 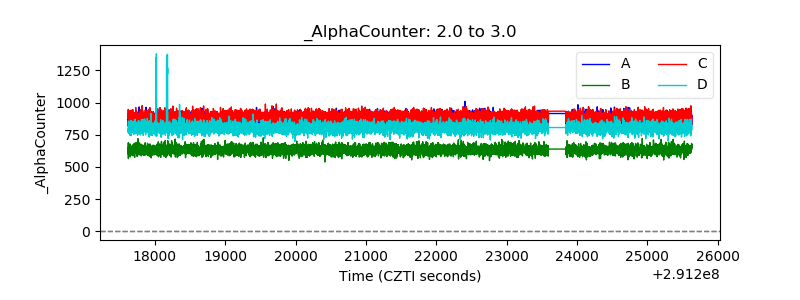 |
| _CPM_Rate | 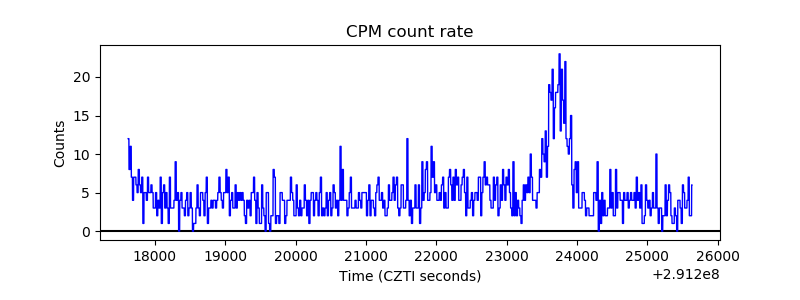 |
| CZT Counter | 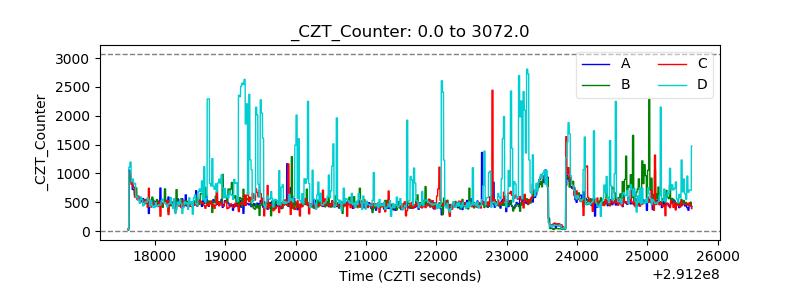 |
| +2.5 Volts monitor |  |
| +5 Volts monitor |  |
| _ROLL_ROT | 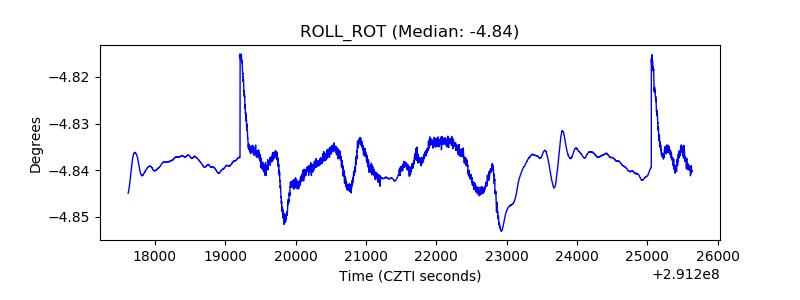 |
| _Roll_DEC | 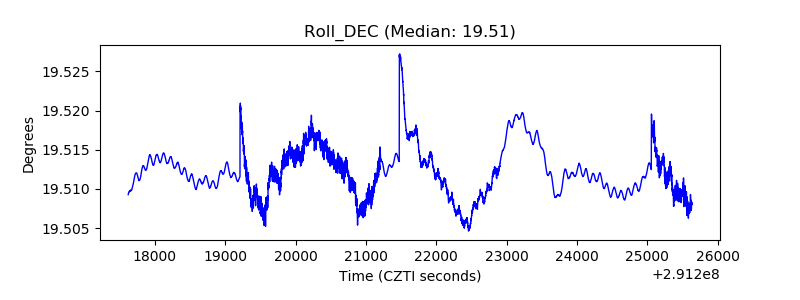 |
| _Roll_RA | 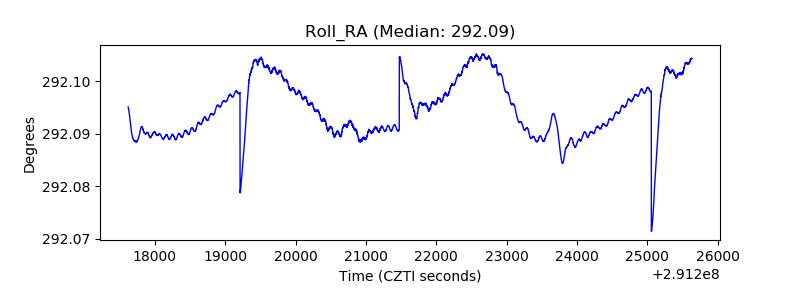 |
| Veto Counter | 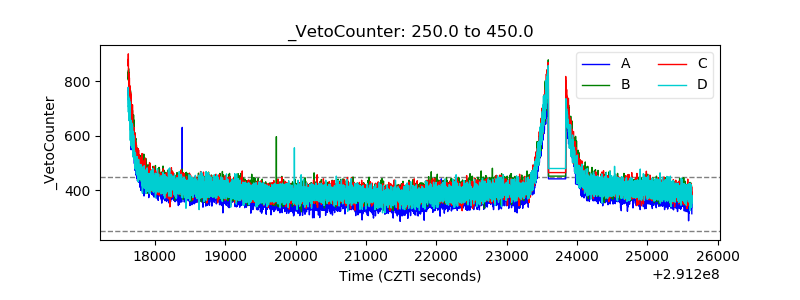 |