| Param | Original file | Final file |
|---|---|---|
| Filename | modeM0/AS1T03_094T01_9000002816_18865cztM0_level2.evt | modeM0/AS1T03_094T01_9000002816_18865cztM0_level2_quad_clean.evt |
| Size (bytes) | 625,916,160 | 81,014,400 |
| Size | 596.9 MB | 77.3 MB |
| Events in quadrant A | 3,755,945 | 495,099 |
| Events in quadrant B | 4,248,666 | 500,815 |
| Events in quadrant C | 4,016,939 | 480,036 |
| Events in quadrant D | 6,419,705 | 448,311 |
| Mode M9 | |||
|---|---|---|---|
| Quadrant | BADHDUFLAG | Total packets | Discarded packets |
| A | 0 | 5 | 0 |
| B | 0 | 5 | 0 |
| C | 0 | 5 | 0 |
| D | 0 | 5 | 0 |
| Mode SS | |||
|---|---|---|---|
| Quadrant | BADHDUFLAG | Total packets | Discarded packets |
| A | 0 | 158 | 0 |
| B | 0 | 158 | 0 |
| C | 0 | 158 | 0 |
| D | 0 | 158 | 0 |
| Mode M0 | |||
|---|---|---|---|
| Quadrant | BADHDUFLAG | Total packets | Discarded packets |
| A | 0 | 15945 | 2 |
| B | 0 | 17377 | 2 |
| C | 0 | 16602 | 2 |
| D | 0 | 24102 | 2 |
| Quadrant | Total seconds | Saturated seconds | Saturation percentage |
|---|---|---|---|
| A | 7598 | 167 | 2.197947% |
| B | 7599 | 253 | 3.329385% |
| C | 7599 | 209 | 2.750362% |
| D | 7599 | 577 | 7.593104% |
Noise dominated data is calculated using 1-second bins in cleaned event files. If a bin has >2000 counts, and if more than 50% of those come from <1% of pixels, then it is considered to be noise-dominated and hence unusable.
| Quadrant | # 1 sec bins | Bins with >0 counts | Bins with >2000 counts | High rate bins dominated by noise | Noise dominated (total time) | Noise dominated (detector-on time) | Marked lightcurve |
|---|---|---|---|---|---|---|---|
| A | 8068 | 7601 | 7 | 7 | 0.09% | 0.09% | 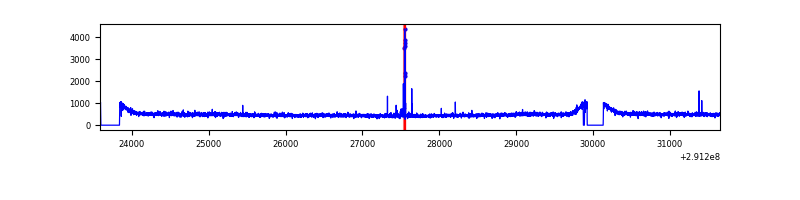 |
| B | 8069 | 7602 | 50 | 50 | 0.62% | 0.66% | 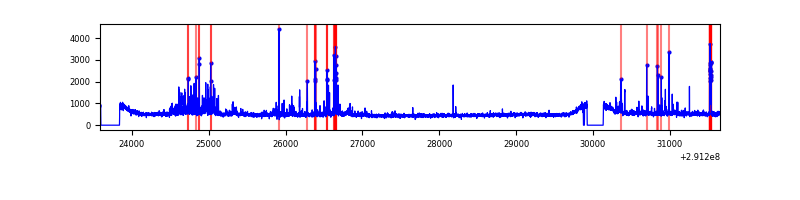 |
| C | 8069 | 7602 | 1 | 1 | 0.01% | 0.01% | 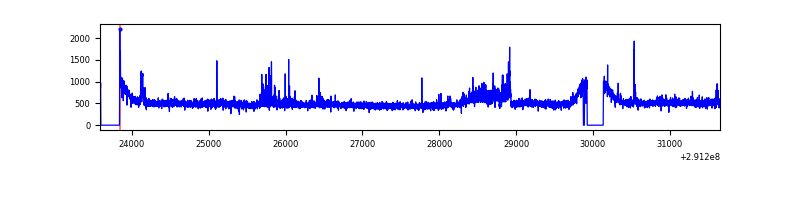 |
| D | 8069 | 7602 | 407 | 407 | 5.04% | 5.35% | 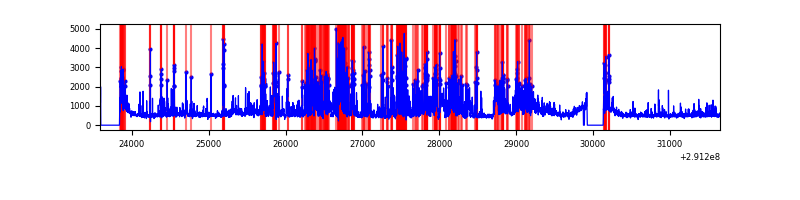 |
Top three noisy pixels from each quadrant. If the there are fewer than three noisy pixels in the level2.evt file, extra rows are filled as -1
| Pixel properties | Quadrant properties | ||||||
|---|---|---|---|---|---|---|---|
| Quadrant | DetID | PixID | Counts | Sigma | Mean | Median | Sigma |
| A | 15 | 174 | 41158 | 203.84 | 961 | 940 | 197.3 |
| A | 13 | 254 | 9980 | 45.82 | 961 | 940 | 197.3 |
| A | 0 | 226 | 8489 | 38.26 | 961 | 940 | 197.3 |
| B | 7 | 220 | 193446 | 1040.6 | 952 | 927 | 185.0 |
| B | 10 | 245 | 79373 | 424.02 | 952 | 927 | 185.0 |
| B | 4 | 216 | 55447 | 294.69 | 952 | 927 | 185.0 |
| C | 3 | 233 | 286674 | 1323.13 | 914 | 916 | 216.0 |
| C | 14 | 238 | 139250 | 640.52 | 914 | 916 | 216.0 |
| C | 8 | 128 | 10286 | 43.39 | 914 | 916 | 216.0 |
| D | 12 | 1 | 1533914 | 6919.53 | 911 | 885 | 221.6 |
| D | 7 | 238 | 482091 | 2171.99 | 911 | 885 | 221.6 |
| D | 1 | 52 | 314052 | 1413.52 | 911 | 885 | 221.6 |
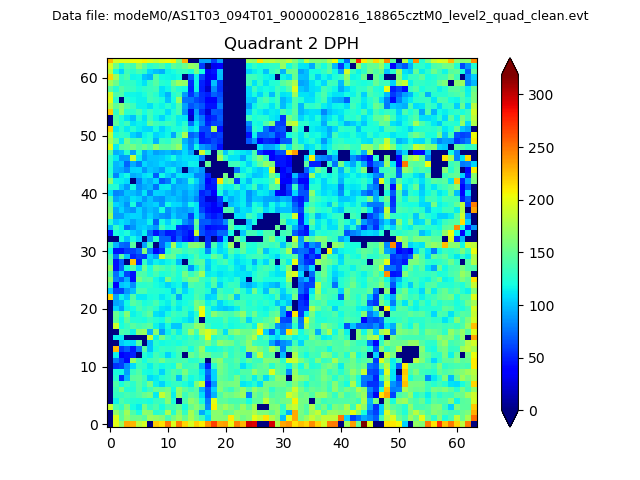
Histogram calculated using DETX and DETY for each event in the final _common_clean file
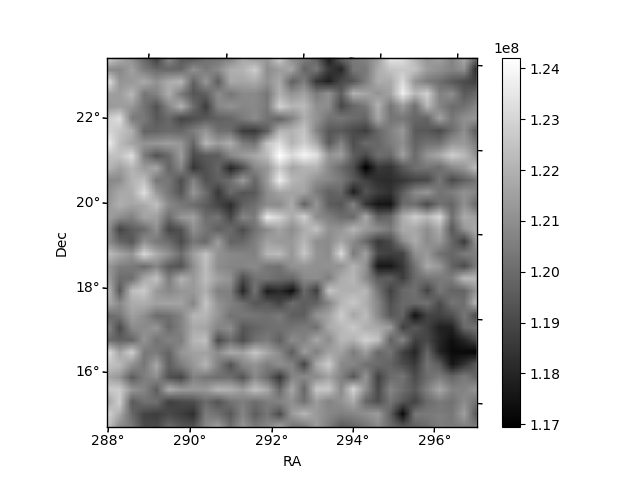
| Quadrant A | 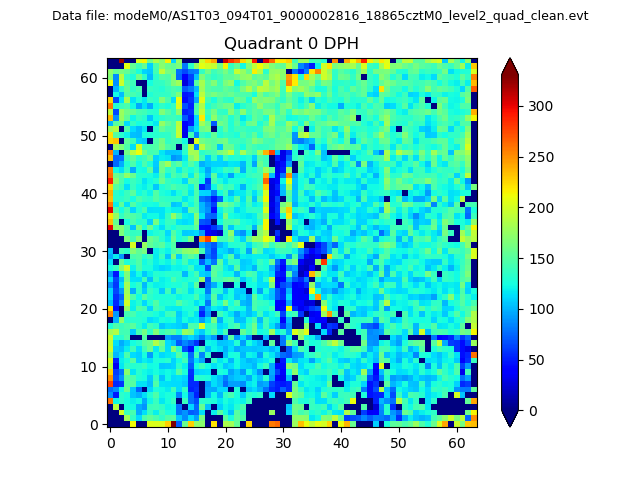 |
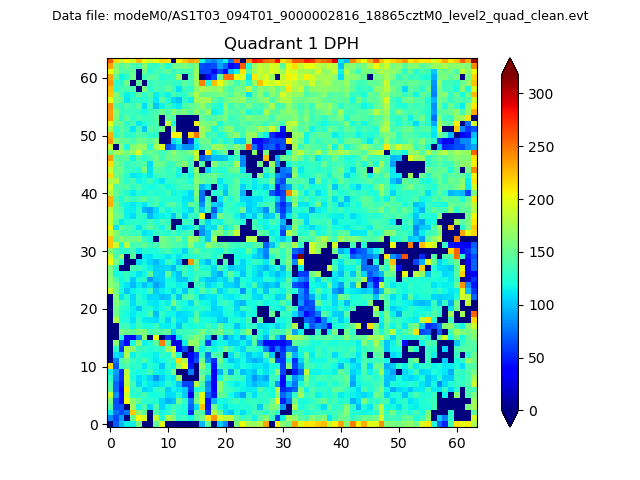 |
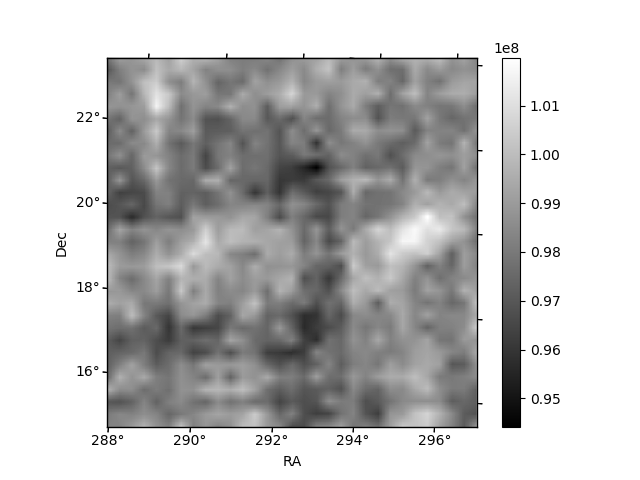
Quadrant B |
|---|---|---|---|
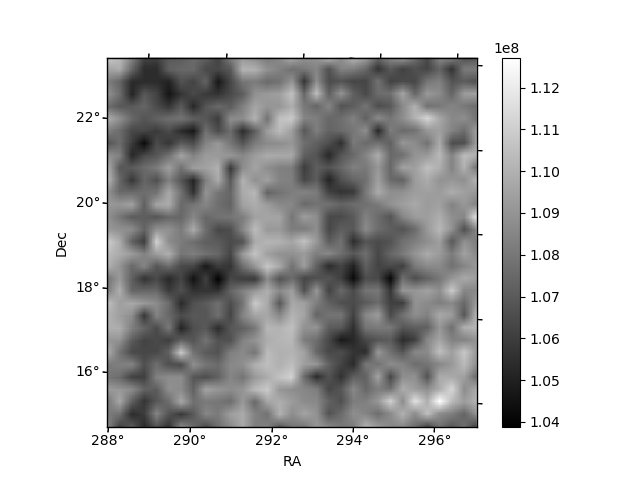
| Quadrant D | 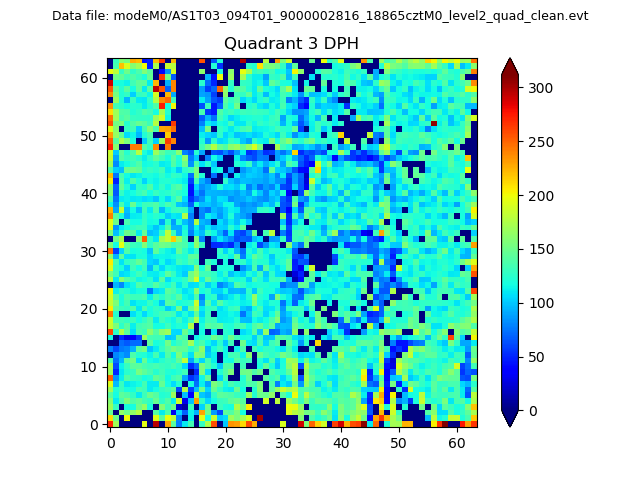 |
 |
Quadrant C |
| Plot type | Count rate plots | Images |
|---|---|---|
| Comparison with Poisson distribution Blue bars denote a histogram of data divided into 1 sec bins. Red curve is a Poisson curve with rate = median count rate of data. |
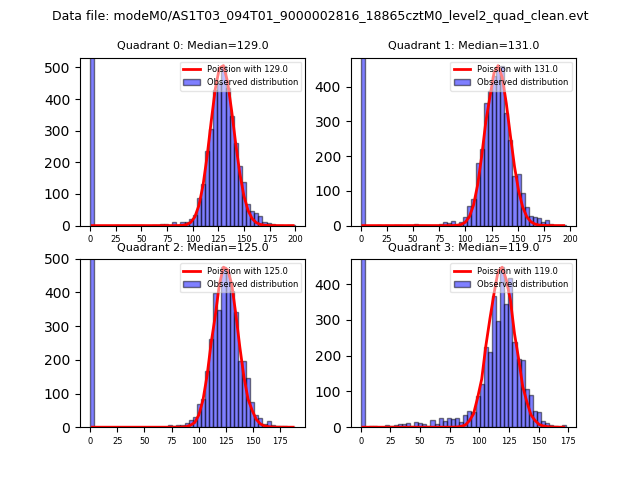 |
 |
| Quadrant-wise count rates Data is divided into 100 sec bins |
 |
|
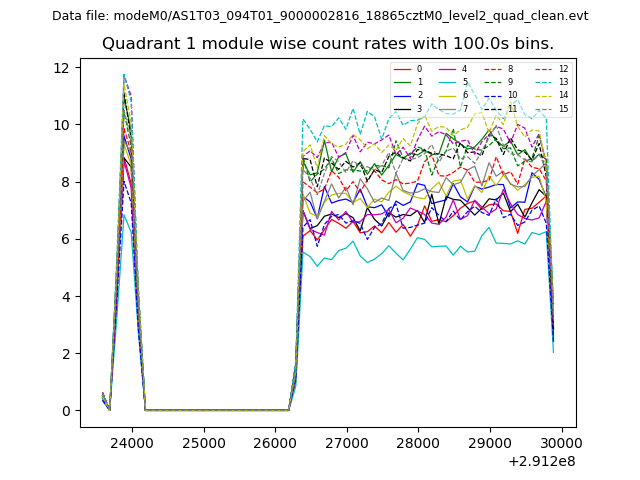
| Module-wise count rates for Quadrant A Data is divided into 100 sec bins |
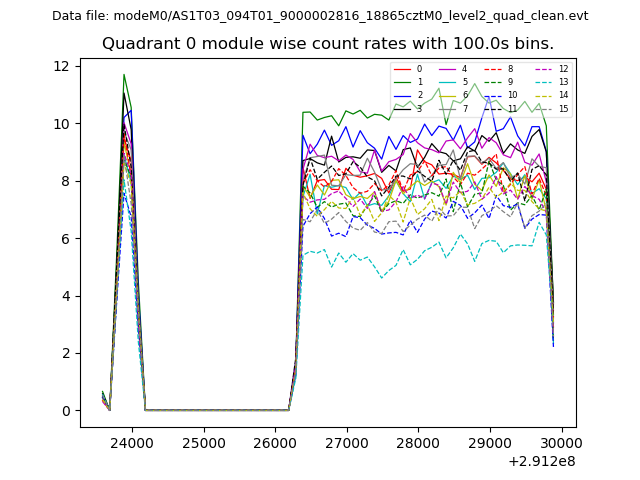 |
 |
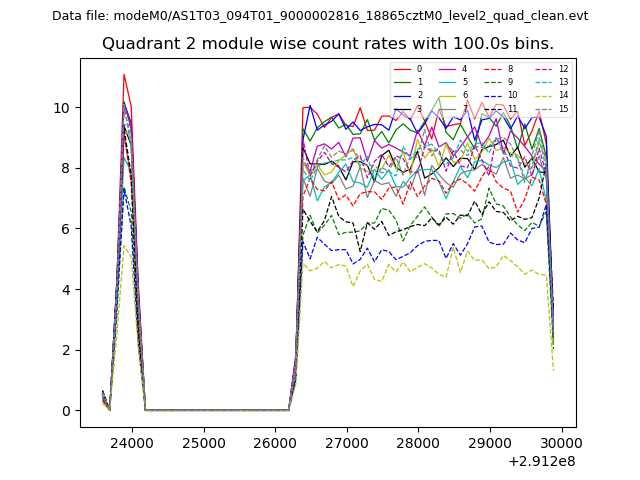
| Module-wise count rates for Quadrant B Data is divided into 100 sec bins |
 |
 |
| Module-wise count rates for Quadrant C Data is divided into 100 sec bins |
 |
 |
| Module-wise count rates for Quadrant D Data is divided into 100 sec bins |
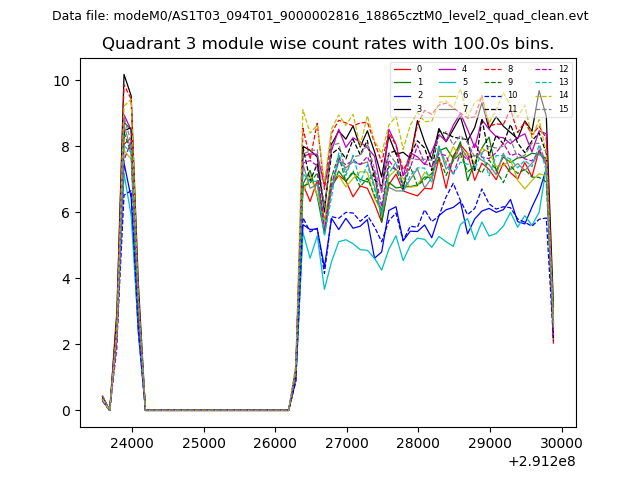 |
 |
| Parameter | Plot |
|---|---|
| CZT HV Monitor |  |
| D_VDD |  |
| Temperature 1 | 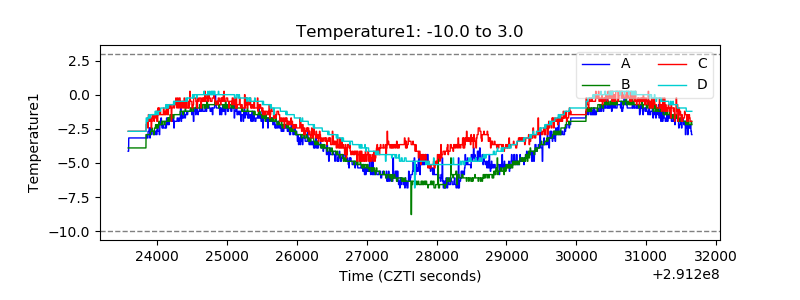 |
| Veto HV Monitor | 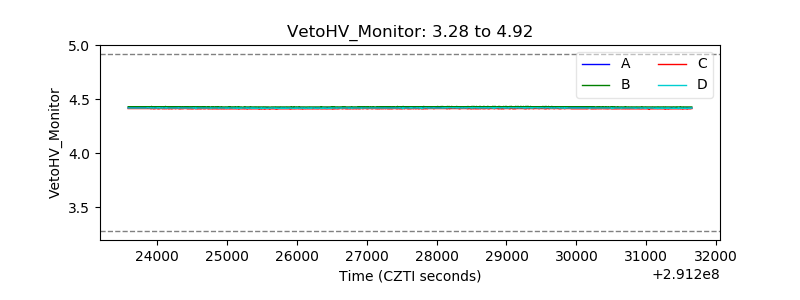 |
| Veto LLD | 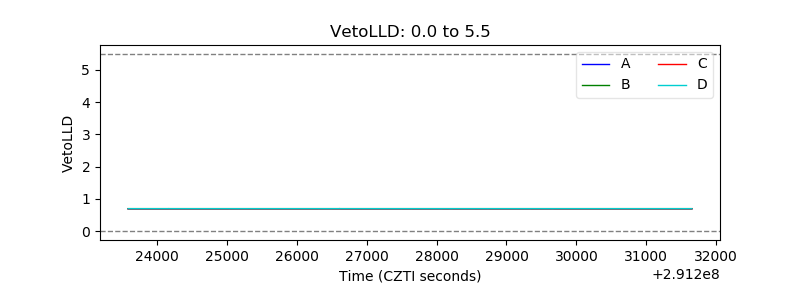 |
| Alpha Counter | 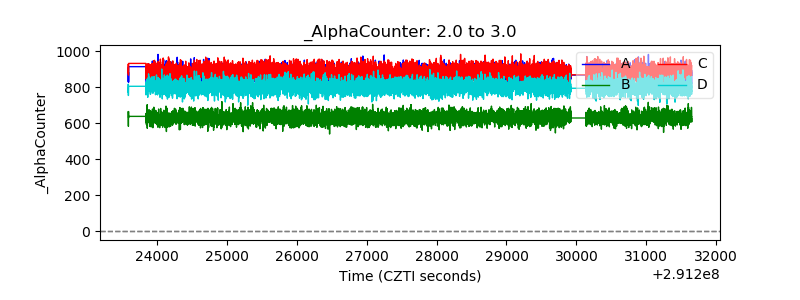 |
| _CPM_Rate |  |
| CZT Counter | 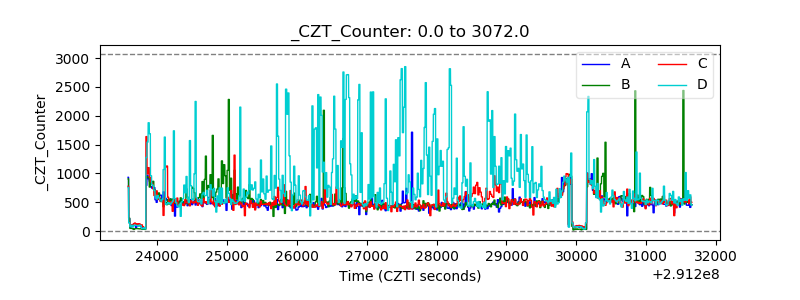 |
| +2.5 Volts monitor |  |
| +5 Volts monitor |  |
| _ROLL_ROT | 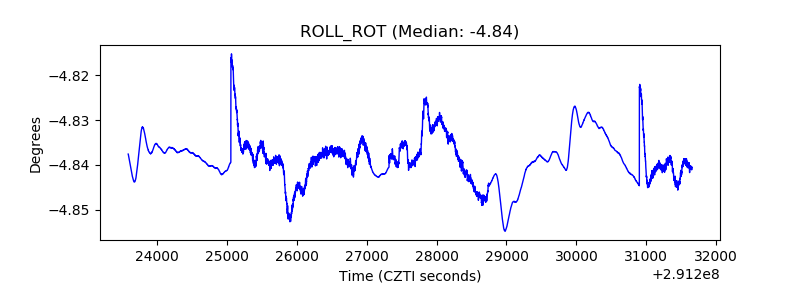 |
| _Roll_DEC | 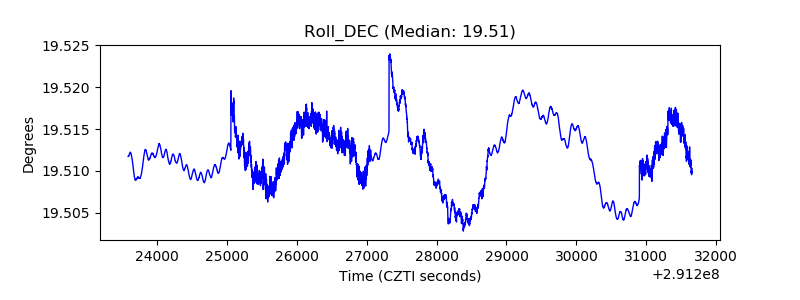 |
| _Roll_RA | 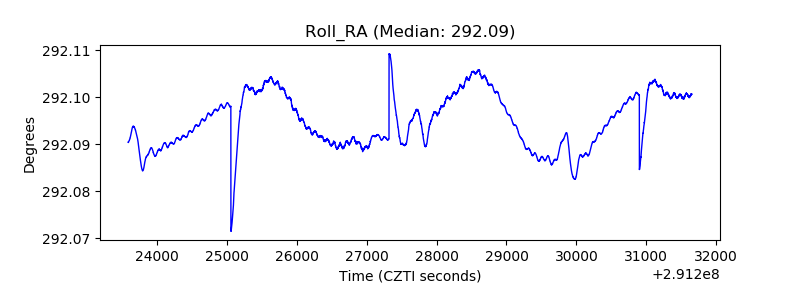 |
| Veto Counter | 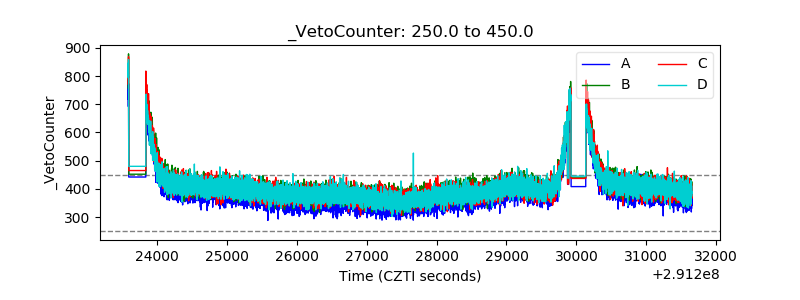 |