| Param | Original file | Final file |
|---|---|---|
| Filename | modeM0/AS1T03_094T01_9000002816_18868cztM0_level2.evt | modeM0/AS1T03_094T01_9000002816_18868cztM0_level2_quad_clean.evt |
| Size (bytes) | 998,061,120 | 163,512,000 |
| Size | 951.8 MB | 155.9 MB |
| Events in quadrant A | 6,429,196 | 1,023,652 |
| Events in quadrant B | 6,884,715 | 1,036,507 |
| Events in quadrant C | 6,863,725 | 1,005,555 |
| Events in quadrant D | 9,154,871 | 973,056 |
| Mode M9 | |||
|---|---|---|---|
| Quadrant | BADHDUFLAG | Total packets | Discarded packets |
| A | 0 | 18 | 0 |
| B | 0 | 18 | 0 |
| C | 0 | 18 | 0 |
| D | 0 | 18 | 0 |
| Mode SS | |||
|---|---|---|---|
| Quadrant | BADHDUFLAG | Total packets | Discarded packets |
| A | 0 | 270 | 0 |
| B | 0 | 270 | 0 |
| C | 0 | 270 | 0 |
| D | 0 | 270 | 0 |
| Mode M0 | |||
|---|---|---|---|
| Quadrant | BADHDUFLAG | Total packets | Discarded packets |
| A | 0 | 27617 | 3 |
| B | 0 | 28966 | 3 |
| C | 0 | 28880 | 3 |
| D | 0 | 36069 | 3 |
| Quadrant | Total seconds | Saturated seconds | Saturation percentage |
|---|---|---|---|
| A | 13223 | 132 | 0.998261% |
| B | 13224 | 289 | 2.185420% |
| C | 13223 | 266 | 2.011646% |
| D | 13223 | 547 | 4.136731% |
Noise dominated data is calculated using 1-second bins in cleaned event files. If a bin has >2000 counts, and if more than 50% of those come from <1% of pixels, then it is considered to be noise-dominated and hence unusable.
| Quadrant | # 1 sec bins | Bins with >0 counts | Bins with >2000 counts | High rate bins dominated by noise | Noise dominated (total time) | Noise dominated (detector-on time) | Marked lightcurve |
|---|---|---|---|---|---|---|---|
| A | 14988 | 13226 | 21 | 21 | 0.14% | 0.16% | 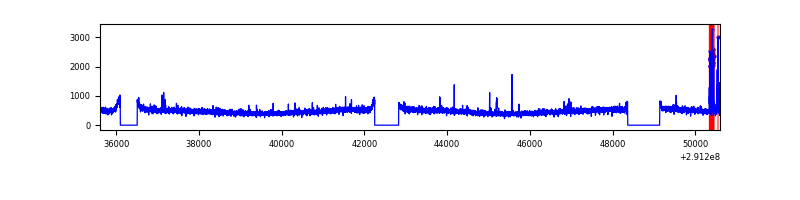 |
| B | 14989 | 13227 | 54 | 54 | 0.36% | 0.41% | 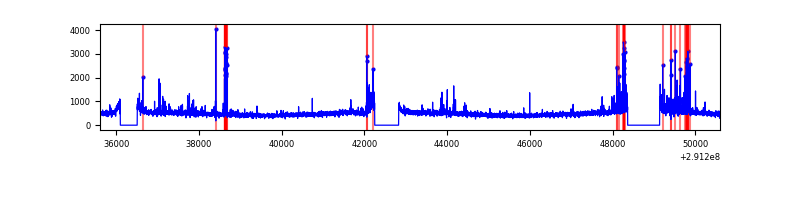 |
| C | 14988 | 13226 | 4 | 4 | 0.03% | 0.03% | 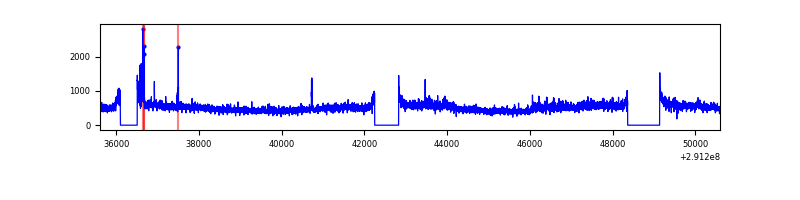 |
| D | 14988 | 13226 | 293 | 293 | 1.95% | 2.22% | 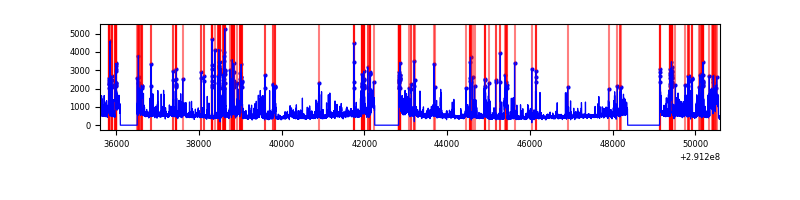 |
Top three noisy pixels from each quadrant. If the there are fewer than three noisy pixels in the level2.evt file, extra rows are filled as -1
| Pixel properties | Quadrant properties | ||||||
|---|---|---|---|---|---|---|---|
| Quadrant | DetID | PixID | Counts | Sigma | Mean | Median | Sigma |
| A | 6 | 16 | 115719 | 345.94 | 1621 | 1585 | 329.9 |
| A | 15 | 174 | 29103 | 83.41 | 1621 | 1585 | 329.9 |
| A | 13 | 254 | 17130 | 47.12 | 1621 | 1585 | 329.9 |
| B | 7 | 220 | 299372 | 954.82 | 1616 | 1575 | 311.9 |
| B | 0 | 197 | 71592 | 224.49 | 1616 | 1575 | 311.9 |
| B | 0 | 228 | 56215 | 175.19 | 1616 | 1575 | 311.9 |
| C | 3 | 233 | 515368 | 1420.73 | 1548 | 1558 | 361.7 |
| C | 14 | 238 | 239841 | 658.87 | 1548 | 1558 | 361.7 |
| C | 5 | 112 | 61686 | 166.26 | 1548 | 1558 | 361.7 |
| D | 1 | 52 | 962057 | 2528.26 | 1556 | 1510 | 379.9 |
| D | 12 | 1 | 958668 | 2519.34 | 1556 | 1510 | 379.9 |
| D | 1 | 20 | 431638 | 1132.14 | 1556 | 1510 | 379.9 |
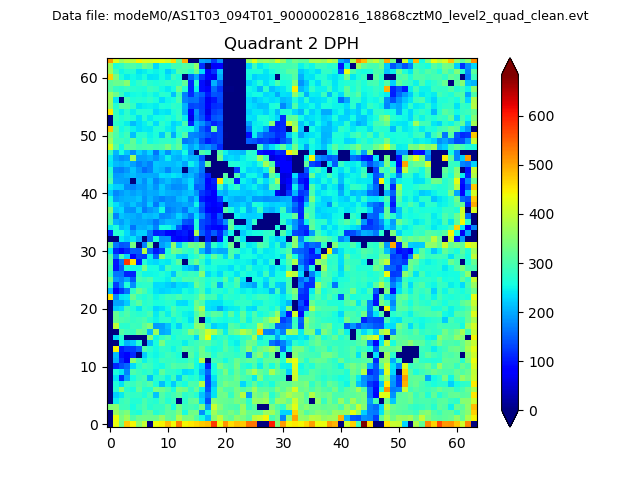
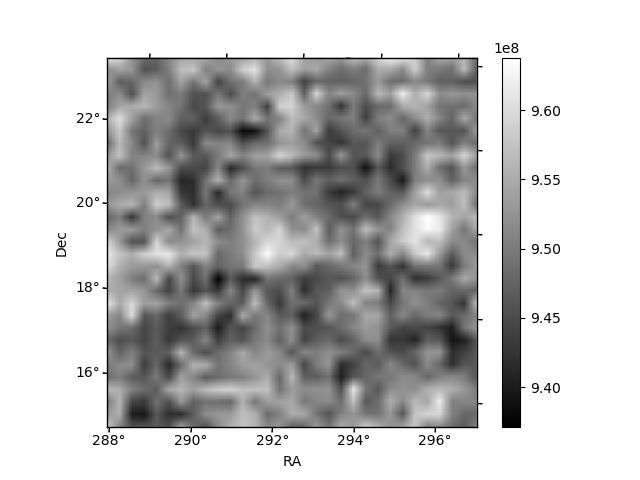
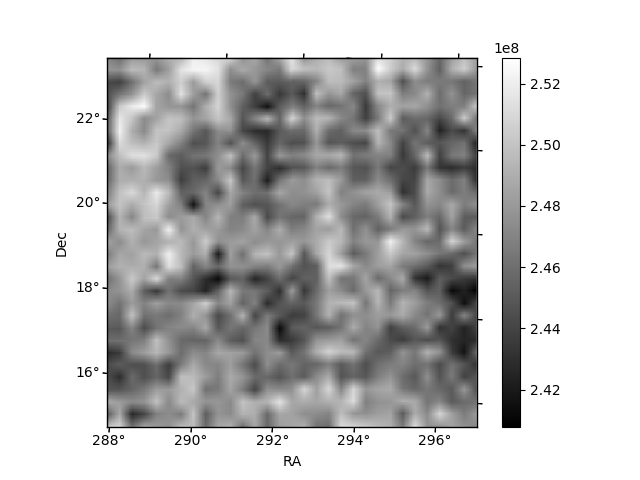
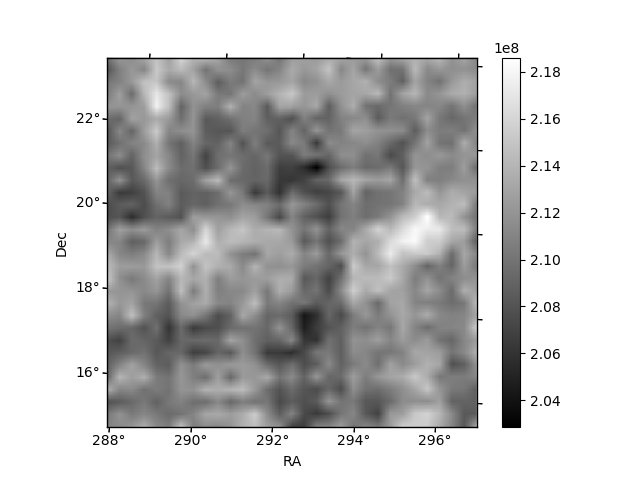
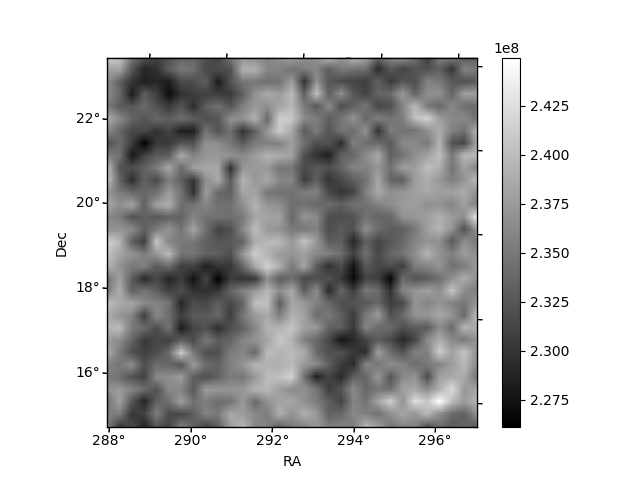
Histogram calculated using DETX and DETY for each event in the final _common_clean file
| Quadrant A | 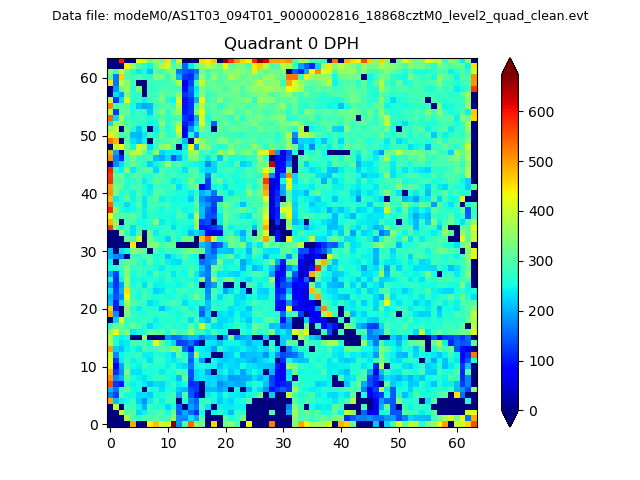 |
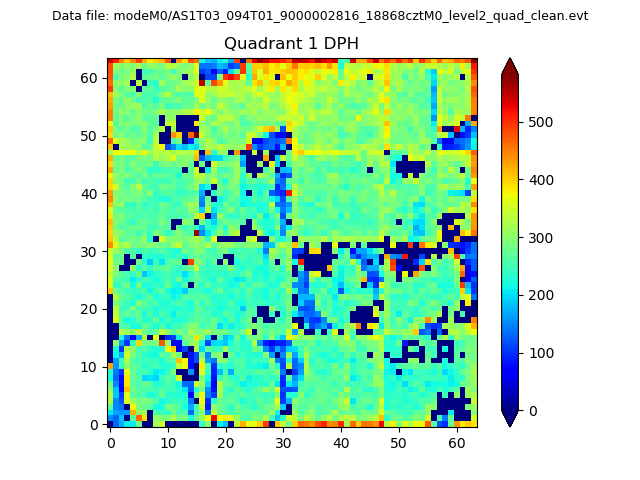 |
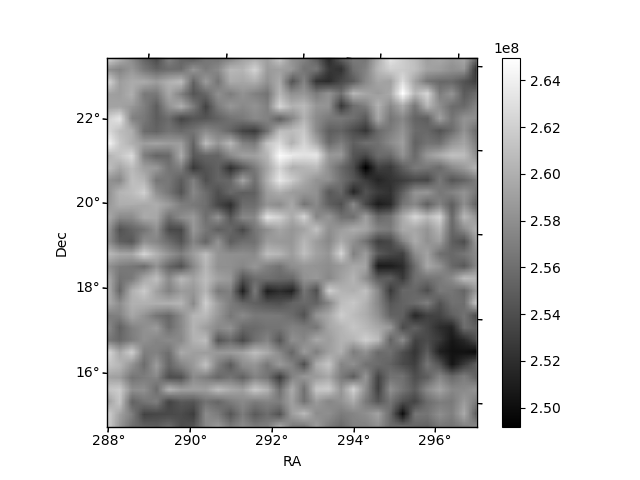
Quadrant B |
|---|---|---|---|
| Quadrant D | 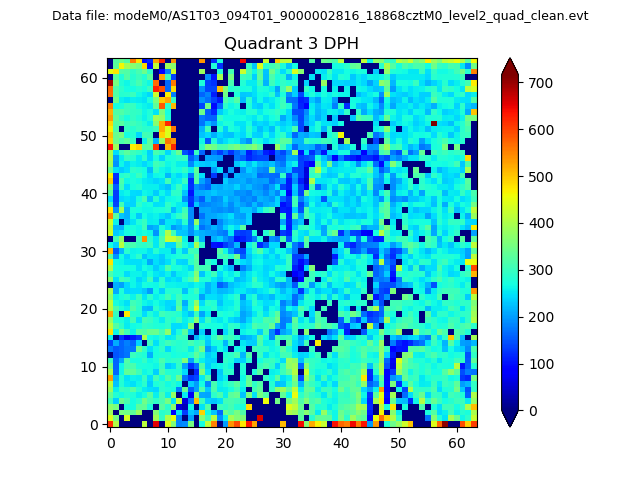 |
 |
Quadrant C |
| Plot type | Count rate plots | Images |
|---|---|---|
| Comparison with Poisson distribution Blue bars denote a histogram of data divided into 1 sec bins. Red curve is a Poisson curve with rate = median count rate of data. |
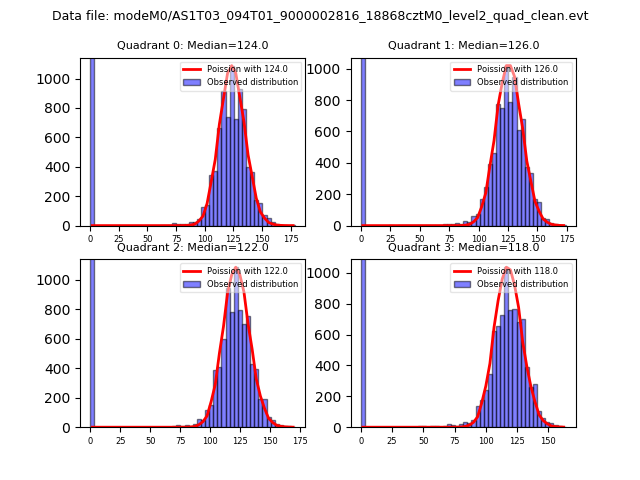 |
 |
| Quadrant-wise count rates Data is divided into 100 sec bins |
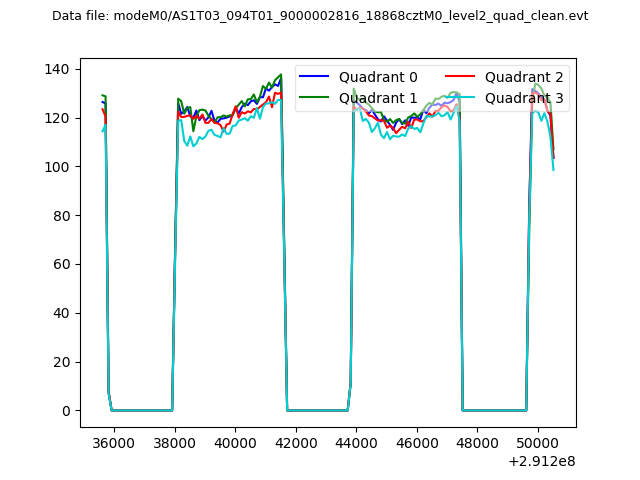 |
|
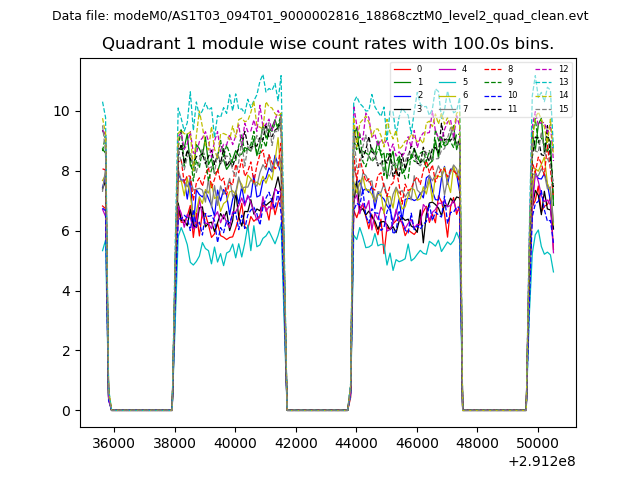
| Module-wise count rates for Quadrant A Data is divided into 100 sec bins |
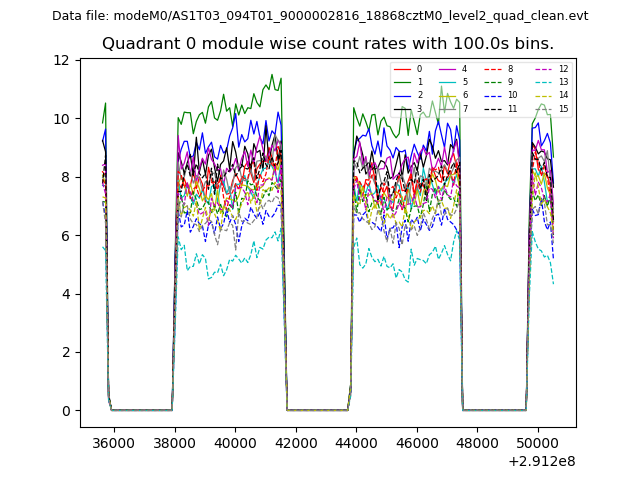 |
 |
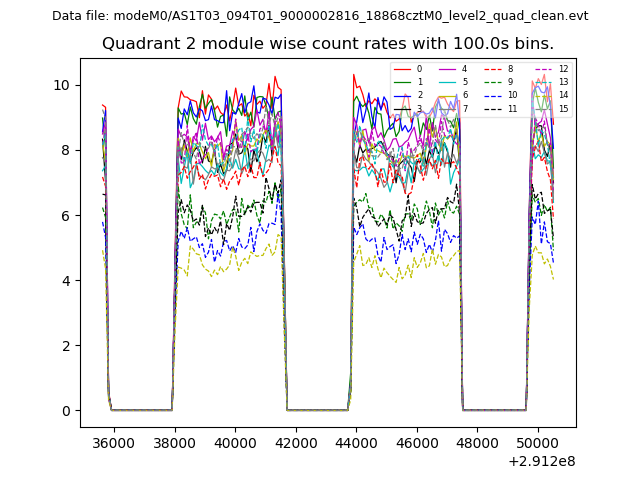
| Module-wise count rates for Quadrant B Data is divided into 100 sec bins |
 |
 |
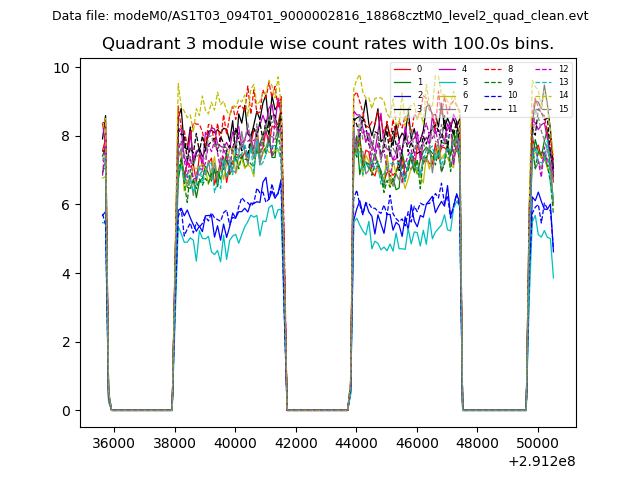
| Module-wise count rates for Quadrant C Data is divided into 100 sec bins |
 |
 |
| Module-wise count rates for Quadrant D Data is divided into 100 sec bins |
 |
 |
| Parameter | Plot |
|---|---|
| CZT HV Monitor | 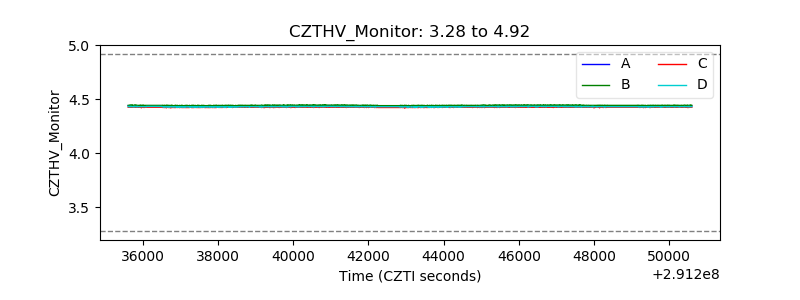 |
| D_VDD | 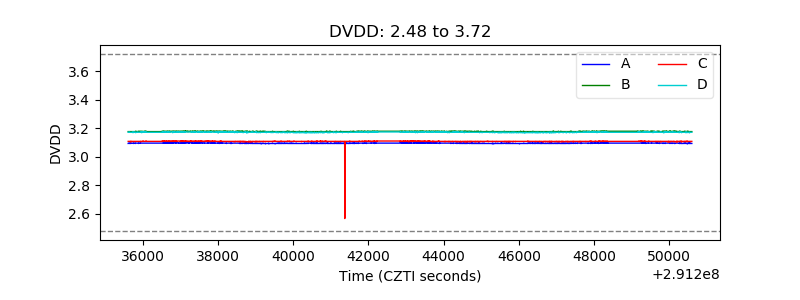 |
| Temperature 1 | 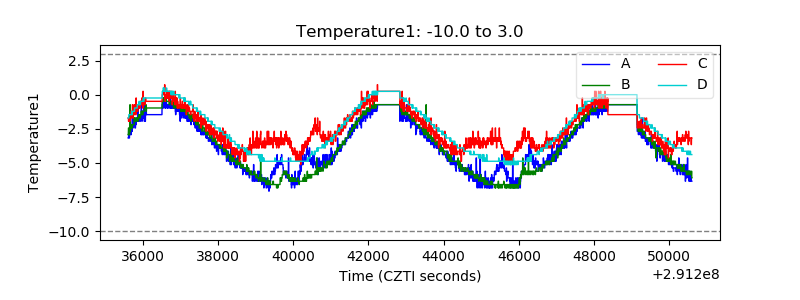 |
| Veto HV Monitor | 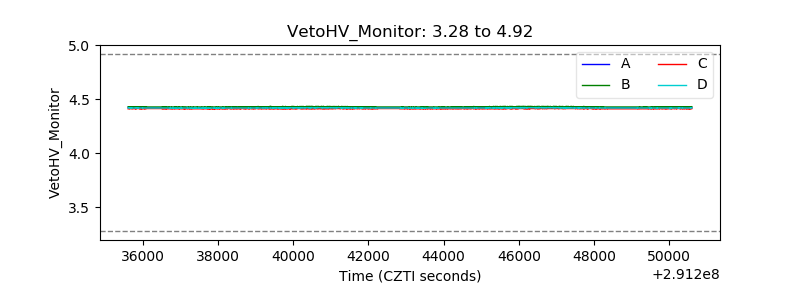 |
| Veto LLD | 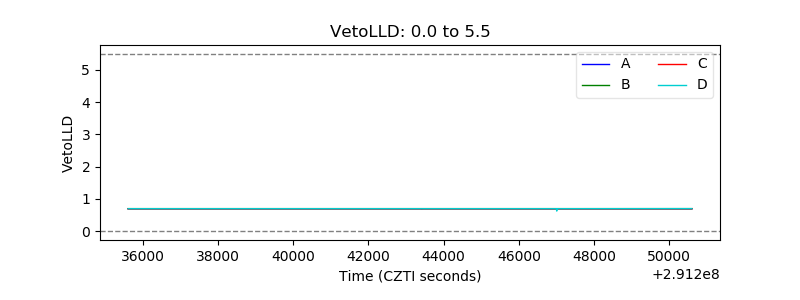 |
| Alpha Counter | 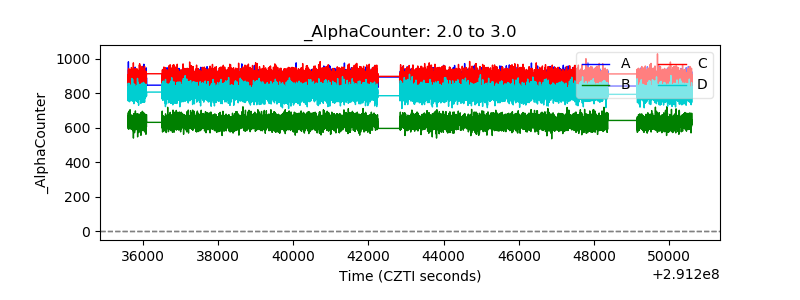 |
| _CPM_Rate | 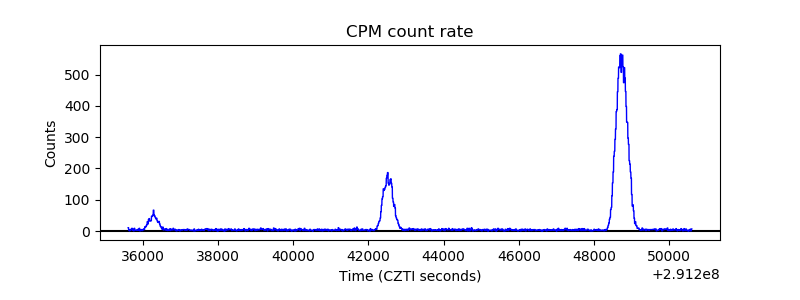 |
| CZT Counter | 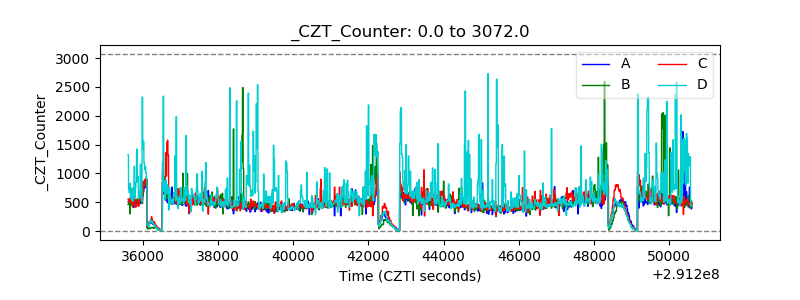 |
| +2.5 Volts monitor |  |
| +5 Volts monitor |  |
| _ROLL_ROT | 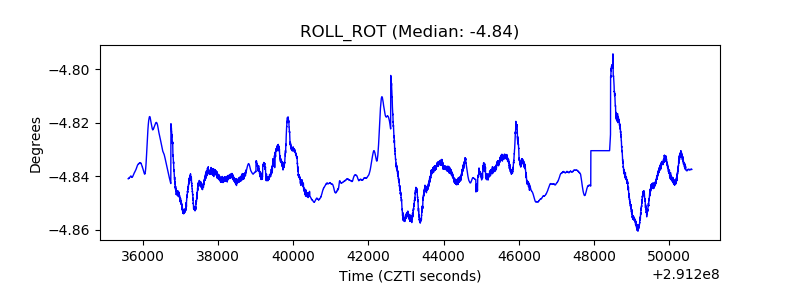 |
| _Roll_DEC | 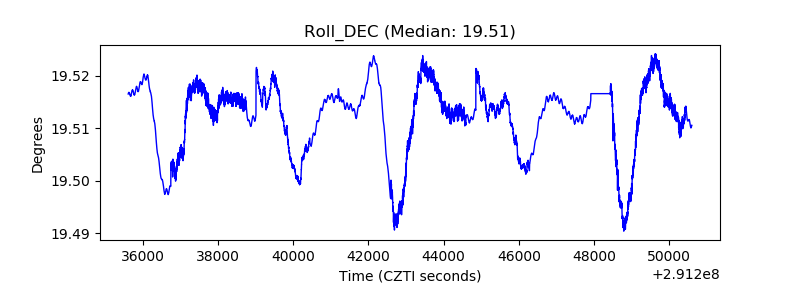 |
| _Roll_RA | 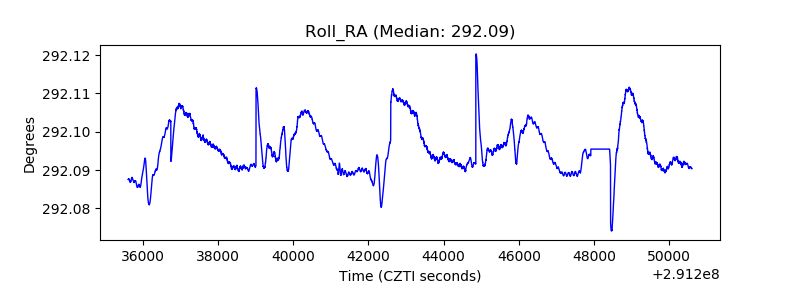 |
| Veto Counter | 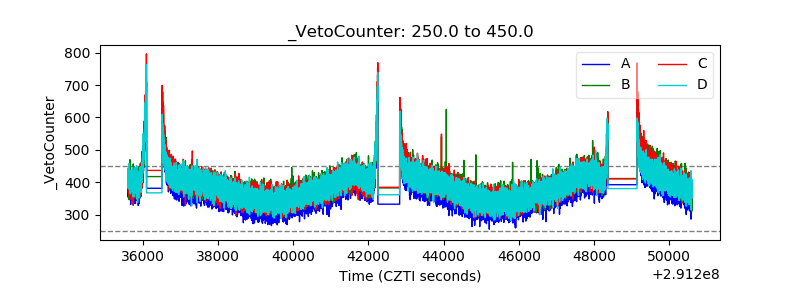 |