| Param | Original file | Final file |
|---|---|---|
| Filename | modeM0/AS1T03_094T01_9000002816_18870cztM0_level2.evt | modeM0/AS1T03_094T01_9000002816_18870cztM0_level2_quad_clean.evt |
| Size (bytes) | 547,574,400 | 99,679,680 |
| Size | 522.2 MB | 95.1 MB |
| Events in quadrant A | 4,450,890 | 641,035 |
| Events in quadrant B | 3,488,014 | 676,650 |
| Events in quadrant C | 3,815,460 | 634,623 |
| Events in quadrant D | 4,387,145 | 611,765 |
| Mode M9 | |||
|---|---|---|---|
| Quadrant | BADHDUFLAG | Total packets | Discarded packets |
| A | 0 | 11 | 0 |
| B | 0 | 11 | 0 |
| C | 0 | 11 | 0 |
| D | 0 | 11 | 0 |
| Mode SS | |||
|---|---|---|---|
| Quadrant | BADHDUFLAG | Total packets | Discarded packets |
| A | 0 | 132 | 0 |
| B | 0 | 132 | 0 |
| C | 0 | 132 | 0 |
| D | 0 | 132 | 0 |
| Mode M0 | |||
|---|---|---|---|
| Quadrant | BADHDUFLAG | Total packets | Discarded packets |
| A | 0 | 17427 | 2 |
| B | 0 | 14819 | 2 |
| C | 0 | 15488 | 2 |
| D | 0 | 17467 | 2 |
| Quadrant | Total seconds | Saturated seconds | Saturation percentage |
|---|---|---|---|
| A | 6518 | 309 | 4.740718% |
| B | 6519 | 125 | 1.917472% |
| C | 6519 | 236 | 3.620187% |
| D | 6519 | 159 | 2.439024% |
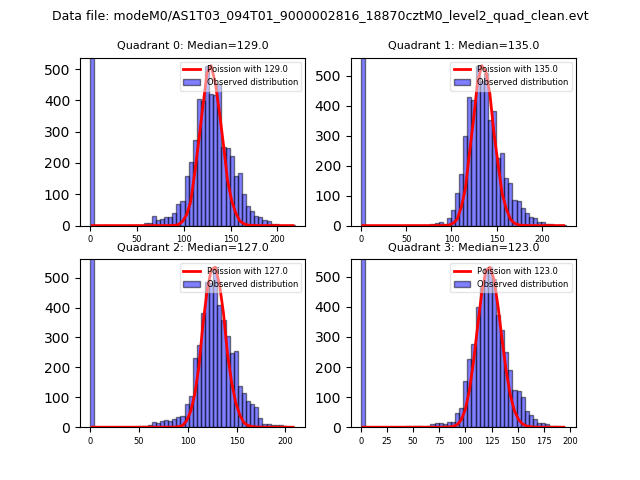
Noise dominated data is calculated using 1-second bins in cleaned event files. If a bin has >2000 counts, and if more than 50% of those come from <1% of pixels, then it is considered to be noise-dominated and hence unusable.
| Quadrant | # 1 sec bins | Bins with >0 counts | Bins with >2000 counts | High rate bins dominated by noise | Noise dominated (total time) | Noise dominated (detector-on time) | Marked lightcurve |
|---|---|---|---|---|---|---|---|
| A | 7608 | 6519 | 316 | 316 | 4.15% | 4.85% | 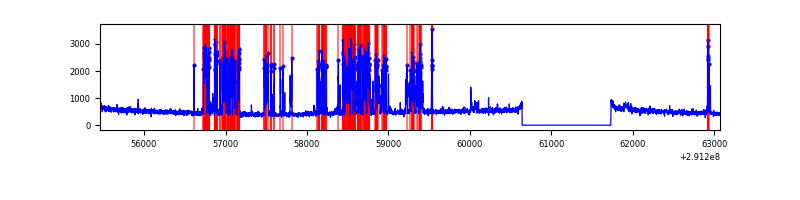 |
| B | 7609 | 6520 | 35 | 35 | 0.46% | 0.54% | 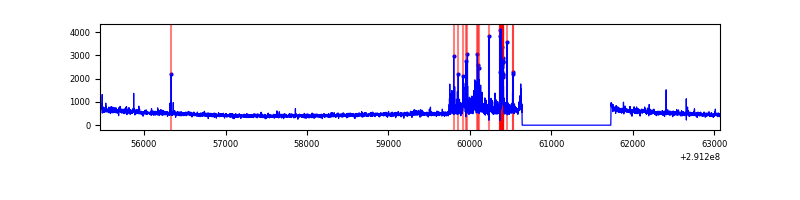 |
| C | 7609 | 6520 | 154 | 154 | 2.02% | 2.36% | 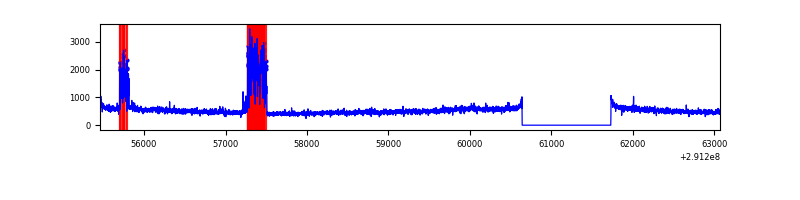 |
| D | 7609 | 6520 | 103 | 103 | 1.35% | 1.58% | 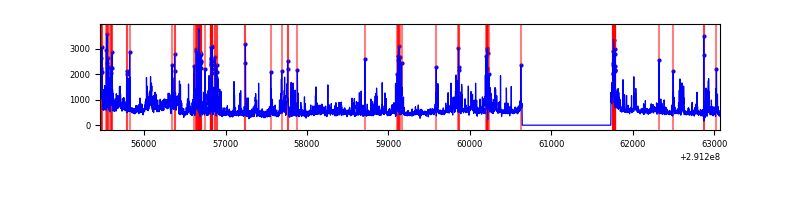 |
Top three noisy pixels from each quadrant. If the there are fewer than three noisy pixels in the level2.evt file, extra rows are filled as -1
| Pixel properties | Quadrant properties | ||||||
|---|---|---|---|---|---|---|---|
| Quadrant | DetID | PixID | Counts | Sigma | Mean | Median | Sigma |
| A | 6 | 16 | 1355159 | 8419.79 | 794 | 780 | 160.9 |
| A | 9 | 143 | 15654 | 92.47 | 794 | 780 | 160.9 |
| A | 15 | 174 | 14979 | 88.27 | 794 | 780 | 160.9 |
| B | 7 | 220 | 256615 | 1662.63 | 804 | 784 | 153.9 |
| B | 4 | 216 | 39518 | 251.73 | 804 | 784 | 153.9 |
| B | 12 | 111 | 17996 | 111.86 | 804 | 784 | 153.9 |
| C | 3 | 233 | 705650 | 3897.52 | 766 | 773 | 180.9 |
| C | 14 | 238 | 119581 | 656.93 | 766 | 773 | 180.9 |
| C | 13 | 61 | 5408 | 25.63 | 766 | 773 | 180.9 |
| D | 1 | 52 | 546501 | 2890.59 | 768 | 742 | 188.8 |
| D | 12 | 1 | 451341 | 2386.57 | 768 | 742 | 188.8 |
| D | 14 | 34 | 141642 | 746.27 | 768 | 742 | 188.8 |
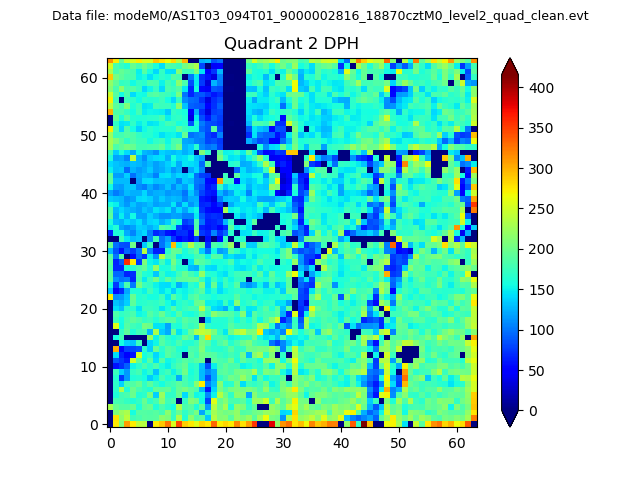
Histogram calculated using DETX and DETY for each event in the final _common_clean file
| Quadrant A | 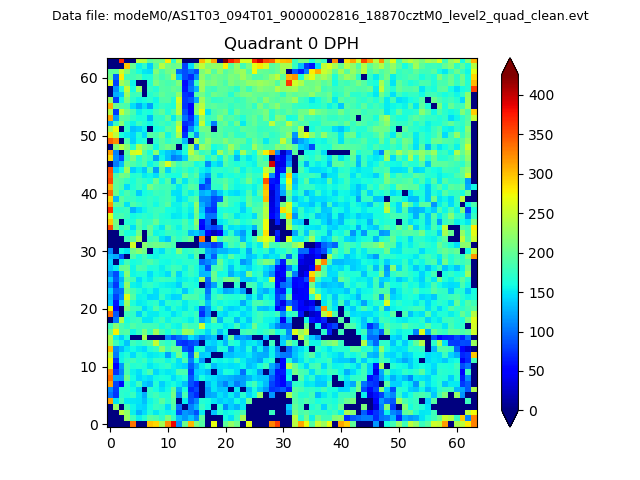 |
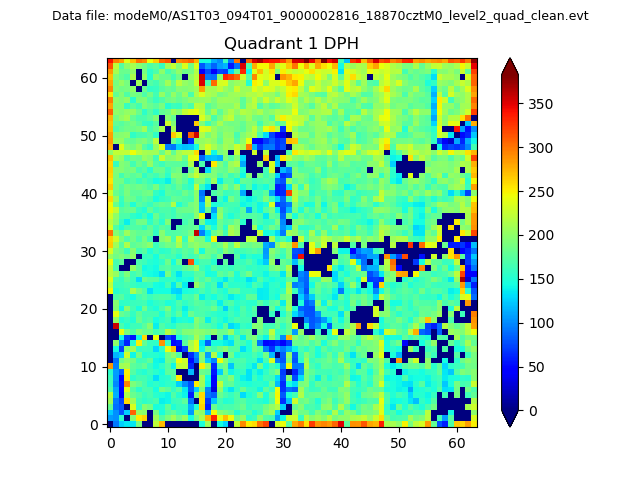 |
Quadrant B |
|---|---|---|---|
| Quadrant D | 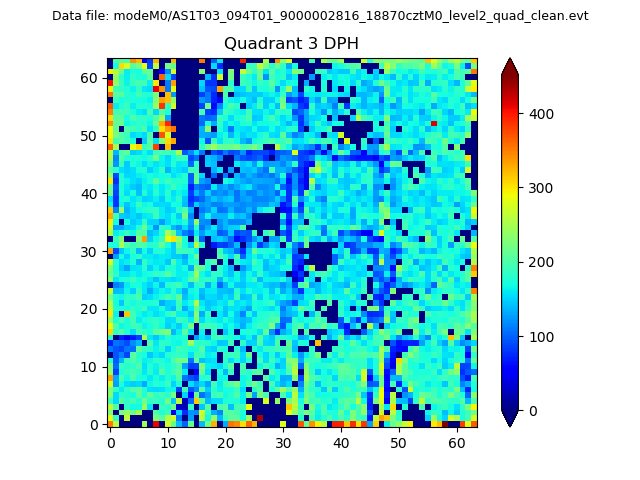 |
 |
Quadrant C |
| Plot type | Count rate plots | Images |
|---|---|---|
| Comparison with Poisson distribution Blue bars denote a histogram of data divided into 1 sec bins. Red curve is a Poisson curve with rate = median count rate of data. |
 |
 |
| Quadrant-wise count rates Data is divided into 100 sec bins |
 |
|
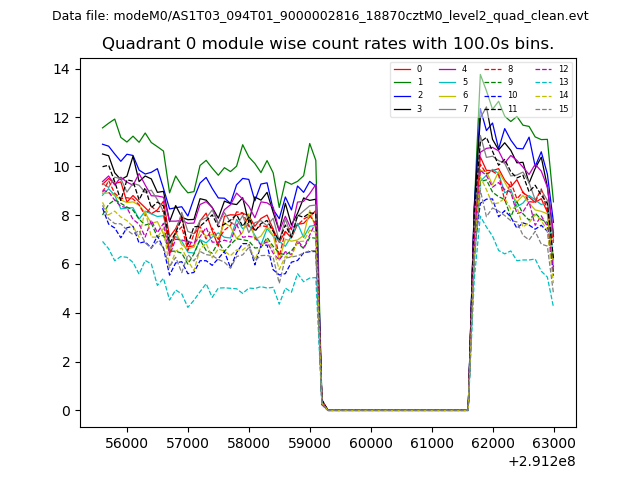
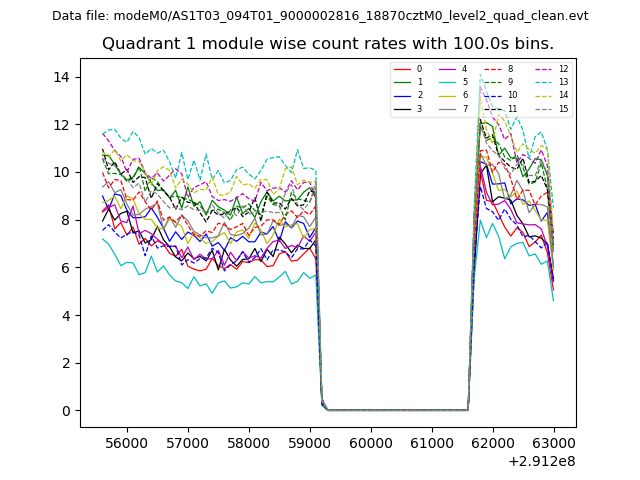
| Module-wise count rates for Quadrant A Data is divided into 100 sec bins |
 |
 |
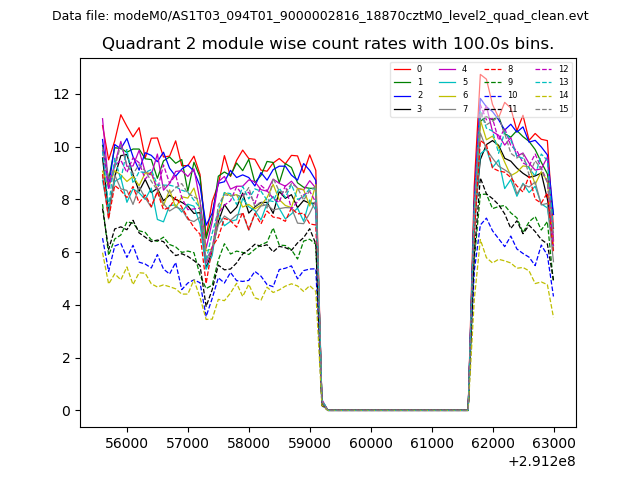
| Module-wise count rates for Quadrant B Data is divided into 100 sec bins |
 |
 |
| Module-wise count rates for Quadrant C Data is divided into 100 sec bins |
 |
 |
| Module-wise count rates for Quadrant D Data is divided into 100 sec bins |
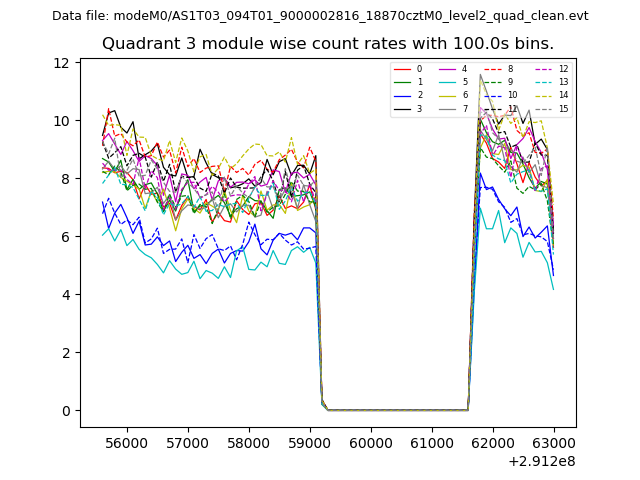 |
 |
| Parameter | Plot |
|---|---|
| CZT HV Monitor | 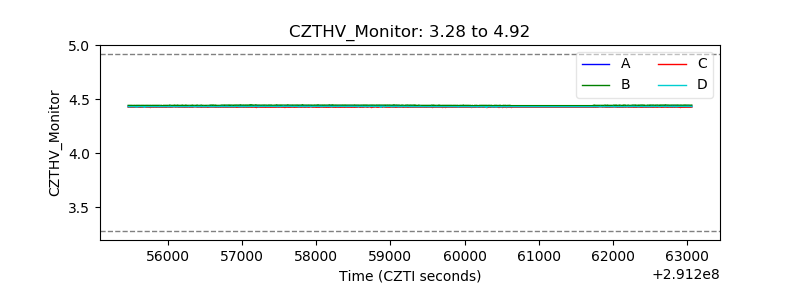 |
| D_VDD | 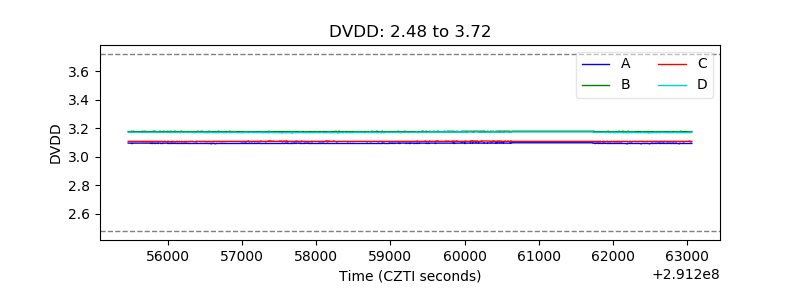 |
| Temperature 1 | 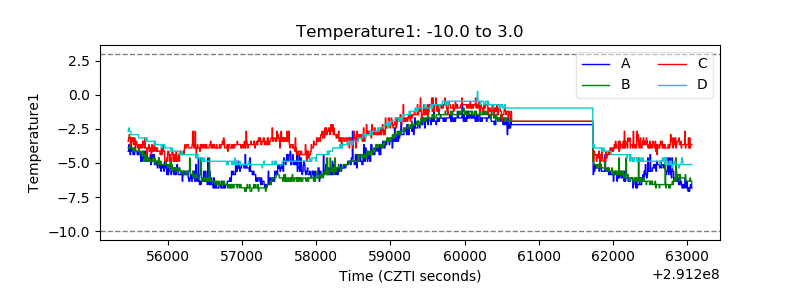 |
| Veto HV Monitor |  |
| Veto LLD | 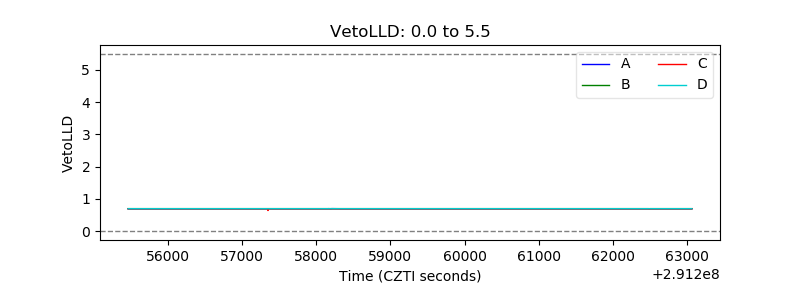 |
| Alpha Counter |  |
| _CPM_Rate | 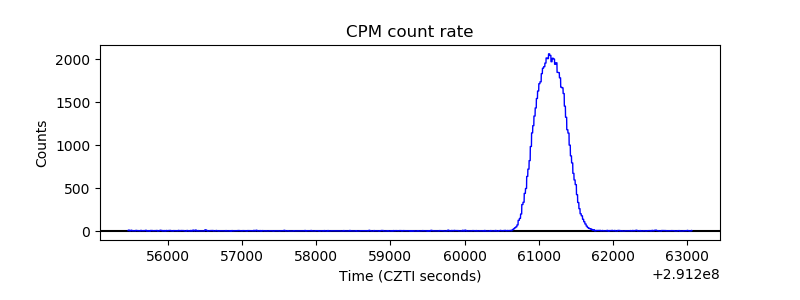 |
| CZT Counter | 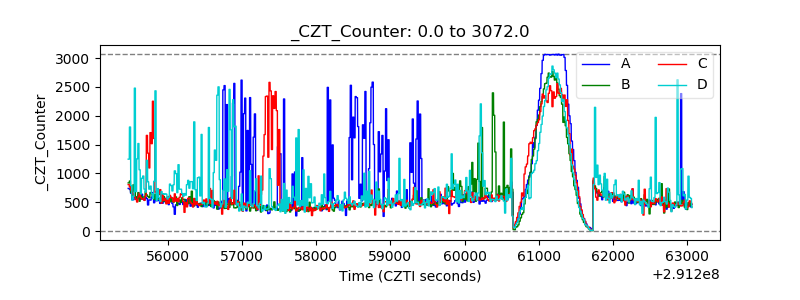 |
| +2.5 Volts monitor |  |
| +5 Volts monitor |  |
| _ROLL_ROT | 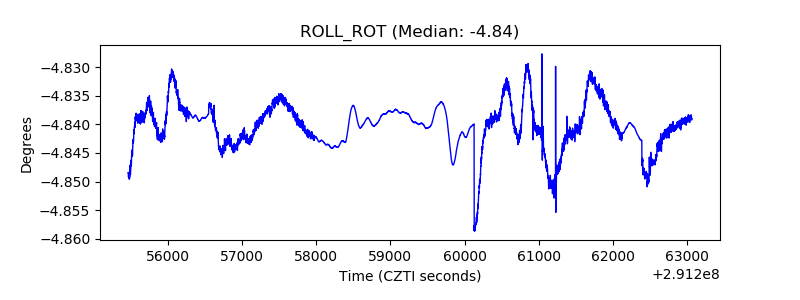 |
| _Roll_DEC | 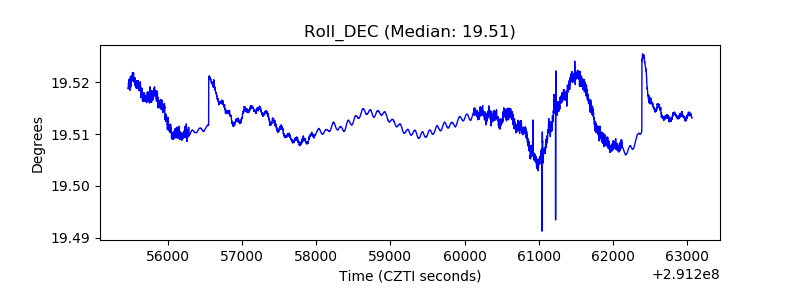 |
| _Roll_RA | 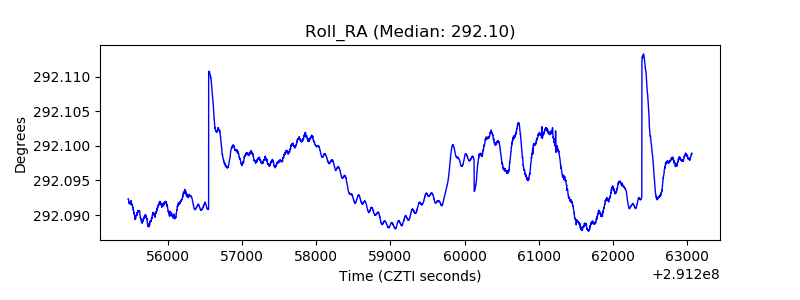 |
| Veto Counter | 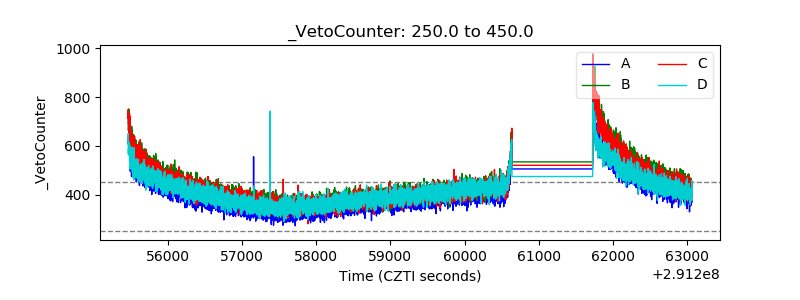 |