| Param | Original file | Final file |
|---|---|---|
| Filename | modeM0/AS1T03_094T01_9000002816_18874cztM0_level2.evt | modeM0/AS1T03_094T01_9000002816_18874cztM0_level2_quad_clean.evt |
| Size (bytes) | 461,090,880 | 79,922,880 |
| Size | 439.7 MB | 76.2 MB |
| Events in quadrant A | 2,870,549 | 521,789 |
| Events in quadrant B | 2,959,356 | 535,179 |
| Events in quadrant C | 2,872,526 | 503,838 |
| Events in quadrant D | 4,880,410 | 466,734 |
| Mode M9 | |||
|---|---|---|---|
| Quadrant | BADHDUFLAG | Total packets | Discarded packets |
| A | 0 | 13 | 0 |
| B | 0 | 13 | 0 |
| C | 0 | 13 | 0 |
| D | 0 | 13 | 0 |
| Mode SS | |||
|---|---|---|---|
| Quadrant | BADHDUFLAG | Total packets | Discarded packets |
| A | 0 | 114 | 0 |
| B | 0 | 114 | 0 |
| C | 0 | 114 | 0 |
| D | 0 | 114 | 0 |
| Mode M0 | |||
|---|---|---|---|
| Quadrant | BADHDUFLAG | Total packets | Discarded packets |
| A | 0 | 11788 | 1 |
| B | 0 | 12049 | 1 |
| C | 0 | 11794 | 1 |
| D | 0 | 18145 | 1 |
| Quadrant | Total seconds | Saturated seconds | Saturation percentage |
|---|---|---|---|
| A | 5613 | 44 | 0.783895% |
| B | 5614 | 74 | 1.318133% |
| C | 5614 | 74 | 1.318133% |
| D | 5614 | 714 | 12.718204% |
Noise dominated data is calculated using 1-second bins in cleaned event files. If a bin has >2000 counts, and if more than 50% of those come from <1% of pixels, then it is considered to be noise-dominated and hence unusable.
| Quadrant | # 1 sec bins | Bins with >0 counts | Bins with >2000 counts | High rate bins dominated by noise | Noise dominated (total time) | Noise dominated (detector-on time) | Marked lightcurve |
|---|---|---|---|---|---|---|---|
| A | 6943 | 5614 | 0 | 0 | 0.00% | 0.00% | 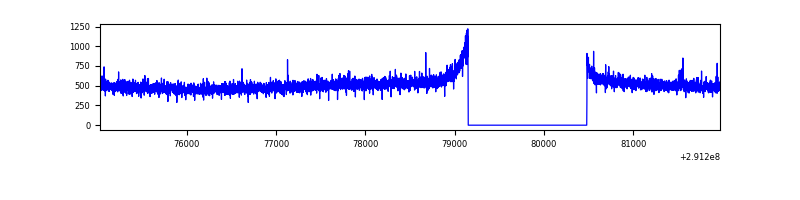 |
| B | 6944 | 5615 | 2 | 2 | 0.03% | 0.04% | 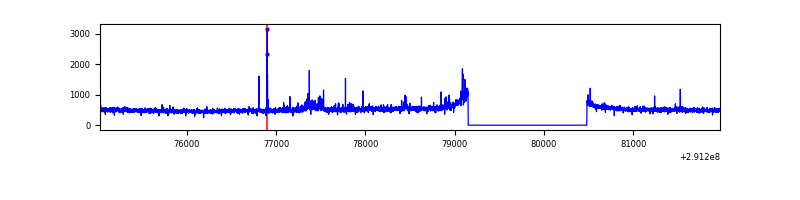 |
| C | 6944 | 5615 | 0 | 0 | 0.00% | 0.00% | 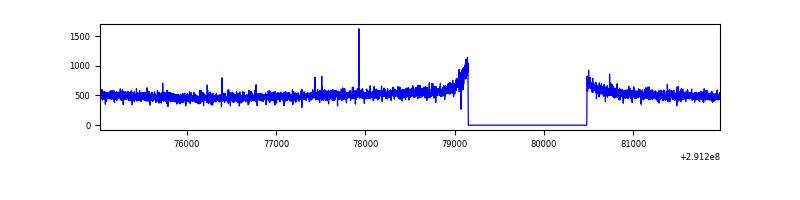 |
| D | 6944 | 5615 | 529 | 529 | 7.62% | 9.42% | 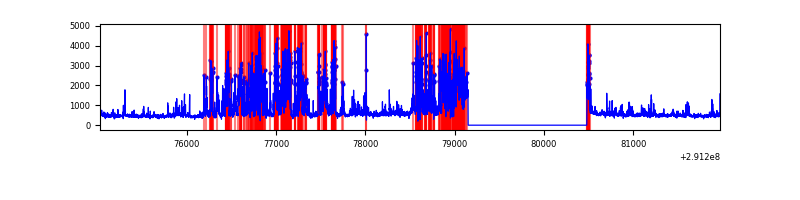 |
Top three noisy pixels from each quadrant. If the there are fewer than three noisy pixels in the level2.evt file, extra rows are filled as -1
| Pixel properties | Quadrant properties | ||||||
|---|---|---|---|---|---|---|---|
| Quadrant | DetID | PixID | Counts | Sigma | Mean | Median | Sigma |
| A | 13 | 254 | 8727 | 53.6 | 741 | 725 | 149.3 |
| A | 0 | 226 | 6646 | 39.66 | 741 | 725 | 149.3 |
| A | 12 | 194 | 5509 | 32.05 | 741 | 725 | 149.3 |
| B | 4 | 216 | 22308 | 156.26 | 737 | 722 | 138.1 |
| B | 7 | 220 | 16185 | 111.93 | 737 | 722 | 138.1 |
| B | 12 | 111 | 15404 | 106.28 | 737 | 722 | 138.1 |
| C | 14 | 238 | 112120 | 678.36 | 704 | 709 | 164.2 |
| C | 3 | 233 | 13985 | 80.83 | 704 | 709 | 164.2 |
| C | 13 | 61 | 5150 | 27.04 | 704 | 709 | 164.2 |
| D | 12 | 1 | 1544083 | 9456.32 | 665 | 645 | 163.2 |
| D | 1 | 52 | 552452 | 3380.8 | 665 | 645 | 163.2 |
| D | 12 | 233 | 115769 | 705.34 | 665 | 645 | 163.2 |
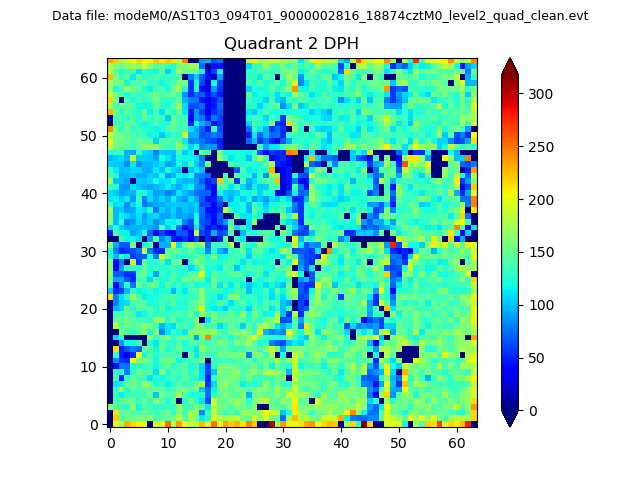
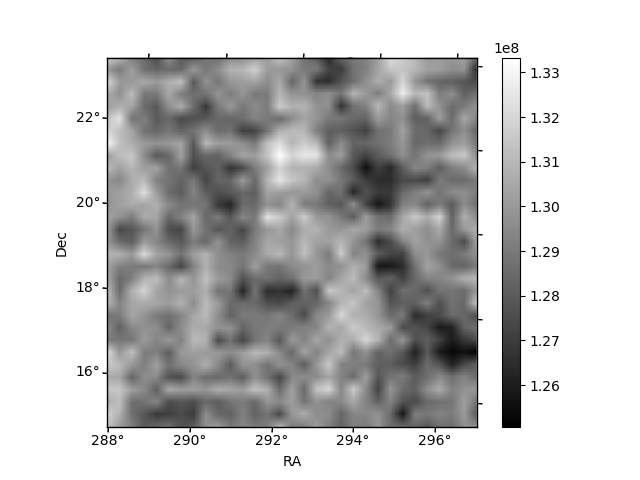
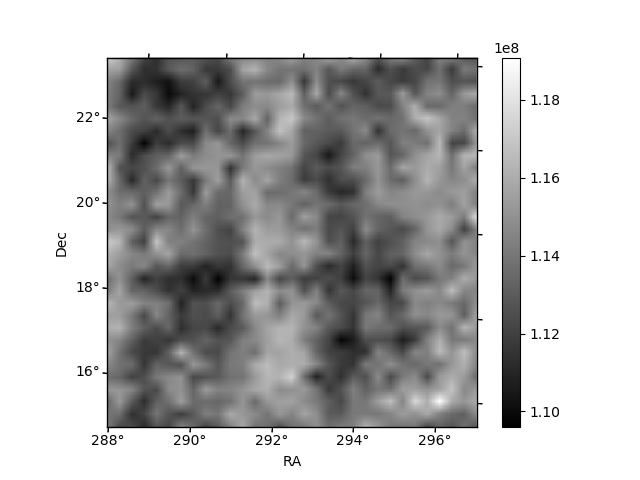
Histogram calculated using DETX and DETY for each event in the final _common_clean file
| Quadrant A | 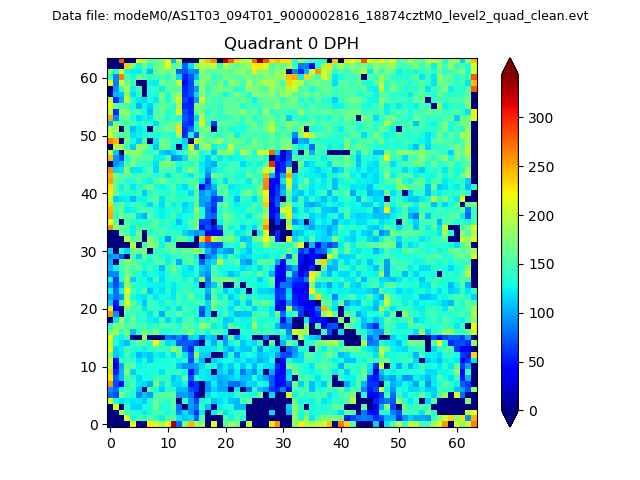 |
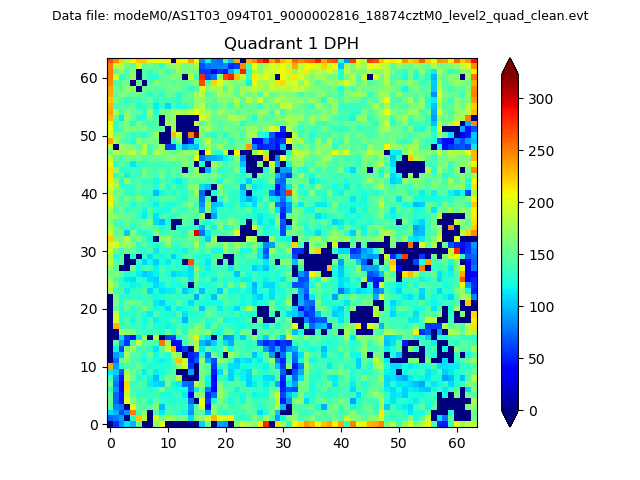 |
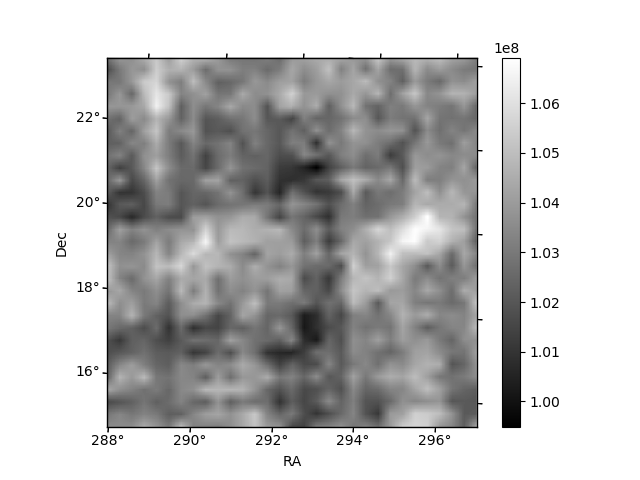
Quadrant B |
|---|---|---|---|
| Quadrant D | 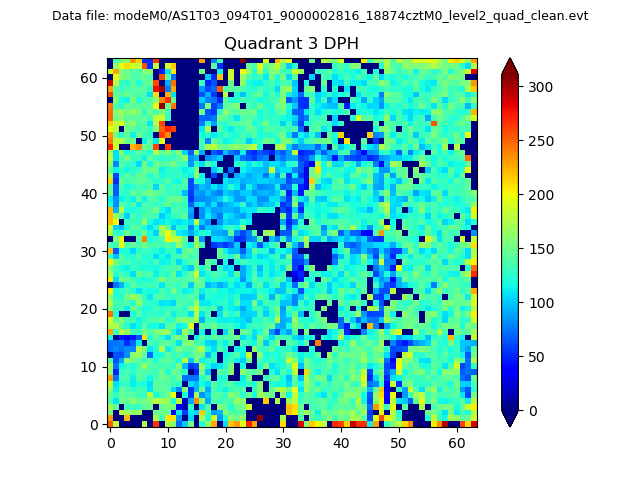 |
 |
Quadrant C |
| Plot type | Count rate plots | Images |
|---|---|---|
| Comparison with Poisson distribution Blue bars denote a histogram of data divided into 1 sec bins. Red curve is a Poisson curve with rate = median count rate of data. |
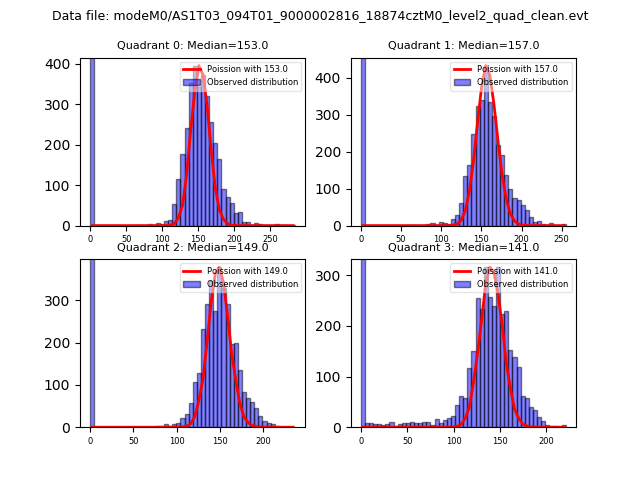 |
 |
| Quadrant-wise count rates Data is divided into 100 sec bins |
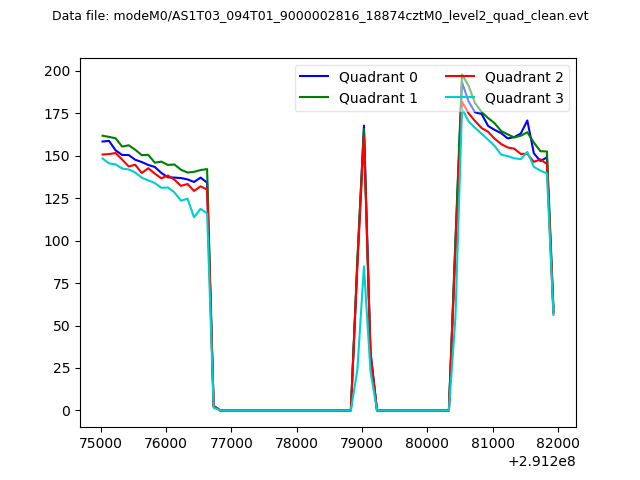 |
|
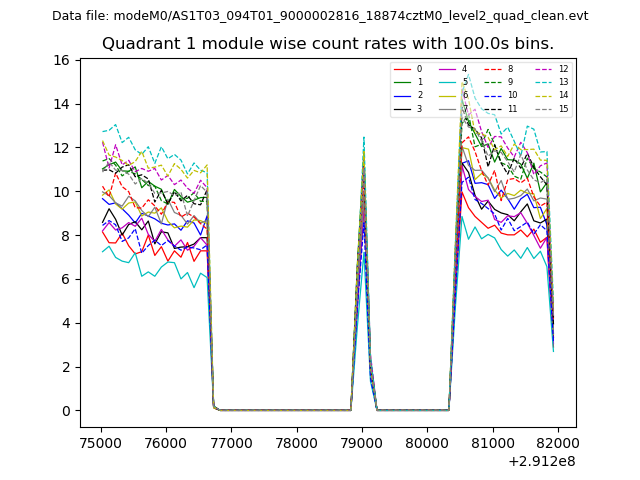
| Module-wise count rates for Quadrant A Data is divided into 100 sec bins |
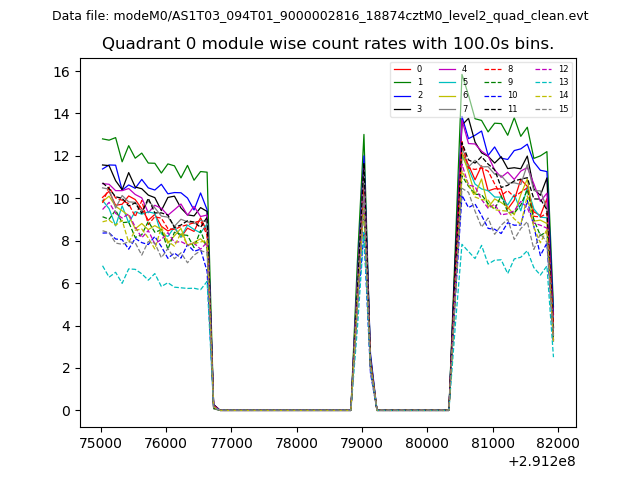 |
 |
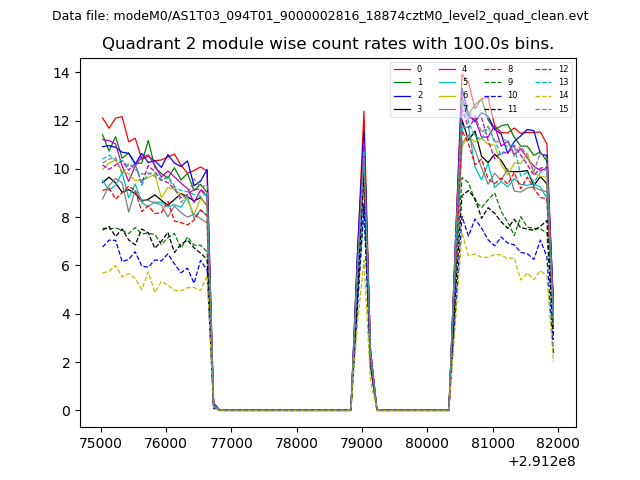
| Module-wise count rates for Quadrant B Data is divided into 100 sec bins |
 |
 |
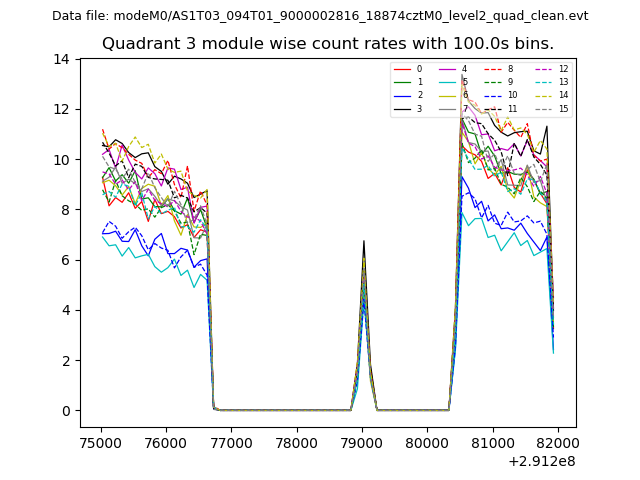
| Module-wise count rates for Quadrant C Data is divided into 100 sec bins |
 |
 |
| Module-wise count rates for Quadrant D Data is divided into 100 sec bins |
 |
 |
| Parameter | Plot |
|---|---|
| CZT HV Monitor | 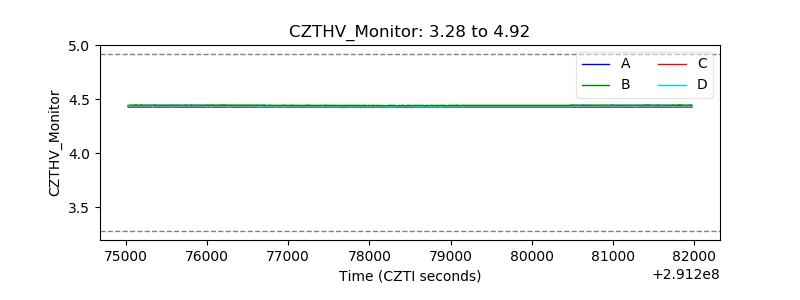 |
| D_VDD | 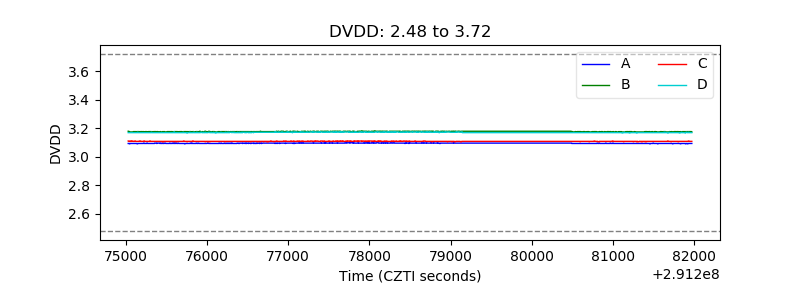 |
| Temperature 1 | 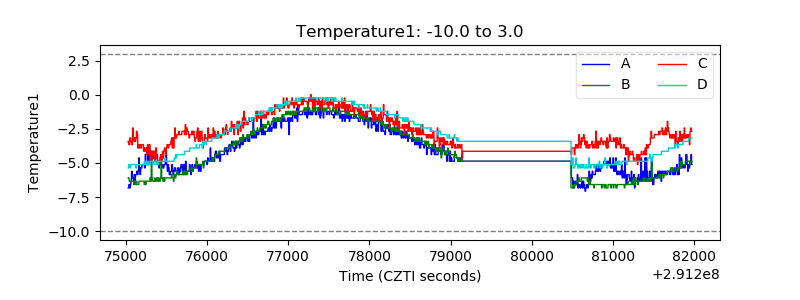 |
| Veto HV Monitor | 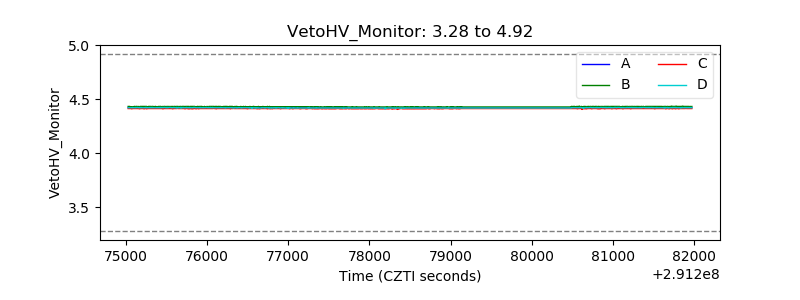 |
| Veto LLD | 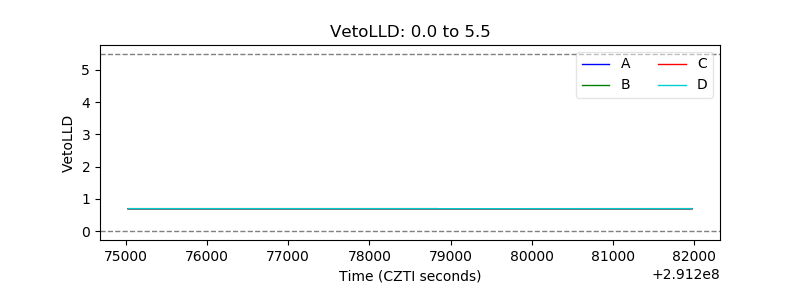 |
| Alpha Counter | 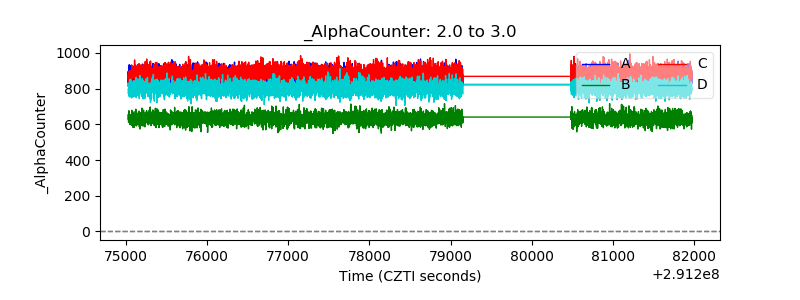 |
| _CPM_Rate | 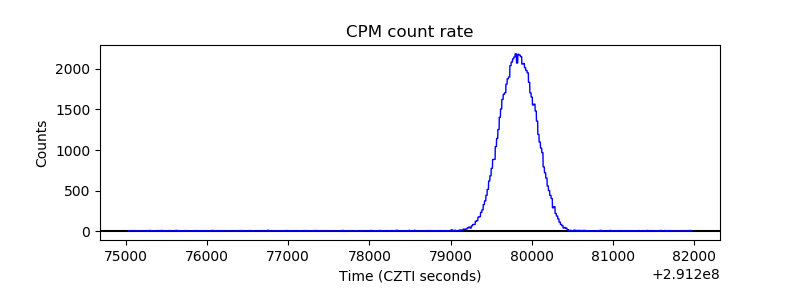 |
| CZT Counter | 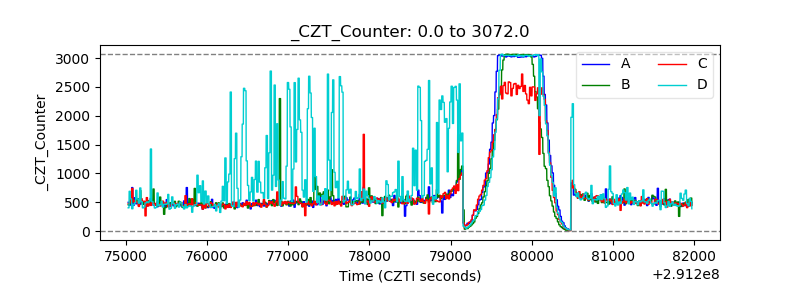 |
| +2.5 Volts monitor | 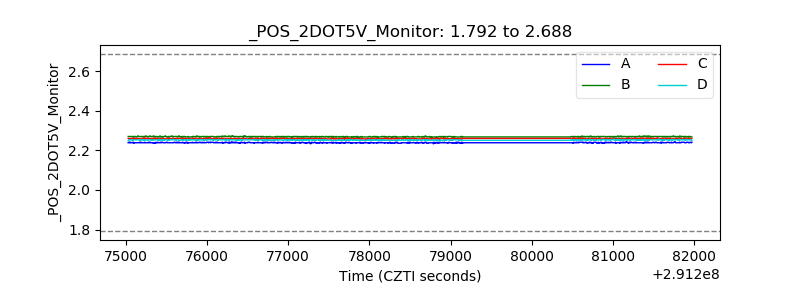 |
| +5 Volts monitor |  |
| _ROLL_ROT | 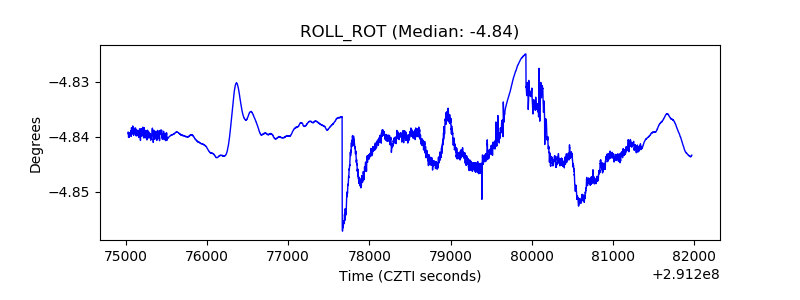 |
| _Roll_DEC | 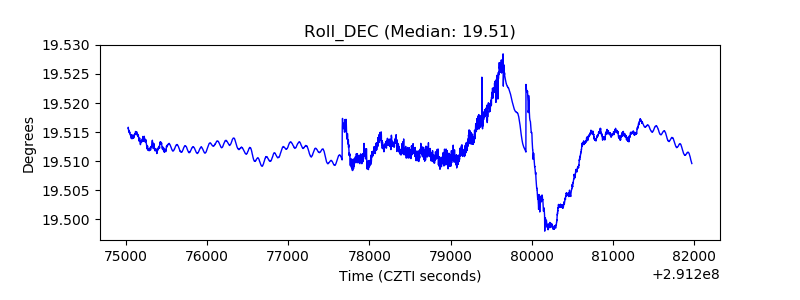 |
| _Roll_RA | 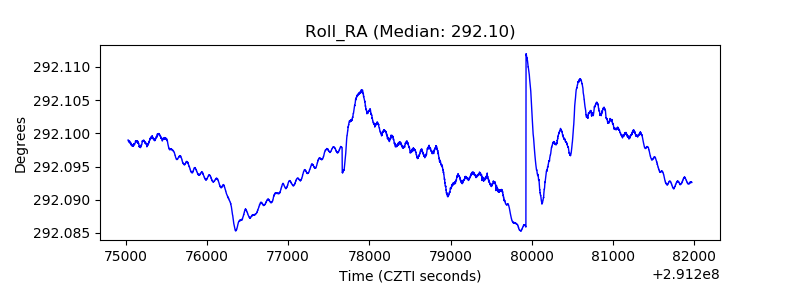 |
| Veto Counter | 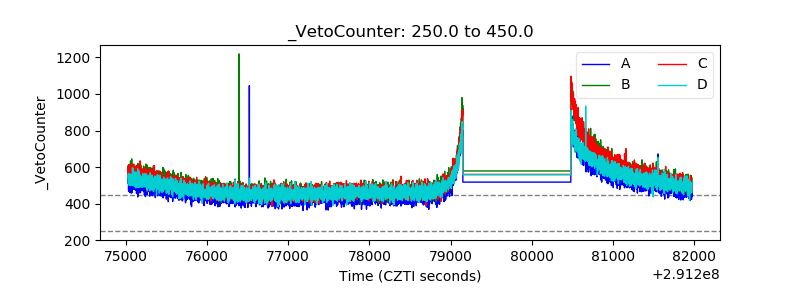 |