| Param | Original file | Final file |
|---|---|---|
| Filename | modeM0/AS1T03_094T01_9000002816_18877cztM0_level2.evt | modeM0/AS1T03_094T01_9000002816_18877cztM0_level2_quad_clean.evt |
| Size (bytes) | 344,836,800 | 44,599,680 |
| Size | 328.9 MB | 42.5 MB |
| Events in quadrant A | 2,017,425 | 270,406 |
| Events in quadrant B | 2,285,946 | 274,903 |
| Events in quadrant C | 2,011,556 | 262,888 |
| Events in quadrant D | 3,841,468 | 244,978 |
| Mode SS | |||
|---|---|---|---|
| Quadrant | BADHDUFLAG | Total packets | Discarded packets |
| A | 0 | 84 | 0 |
| B | 0 | 84 | 0 |
| C | 0 | 84 | 0 |
| D | 0 | 84 | 0 |
| Mode M0 | |||
|---|---|---|---|
| Quadrant | BADHDUFLAG | Total packets | Discarded packets |
| A | 0 | 8519 | 0 |
| B | 0 | 9228 | 0 |
| C | 0 | 8484 | 0 |
| D | 0 | 14266 | 0 |
| Quadrant | Total seconds | Saturated seconds | Saturation percentage |
|---|---|---|---|
| A | 4212 | 4 | 0.094967% |
| B | 4213 | 31 | 0.735818% |
| C | 4213 | 13 | 0.308569% |
| D | 4213 | 418 | 9.921671% |
Noise dominated data is calculated using 1-second bins in cleaned event files. If a bin has >2000 counts, and if more than 50% of those come from <1% of pixels, then it is considered to be noise-dominated and hence unusable.
| Quadrant | # 1 sec bins | Bins with >0 counts | Bins with >2000 counts | High rate bins dominated by noise | Noise dominated (total time) | Noise dominated (detector-on time) | Marked lightcurve |
|---|---|---|---|---|---|---|---|
| A | 4212 | 4212 | 2 | 2 | 0.05% | 0.05% | 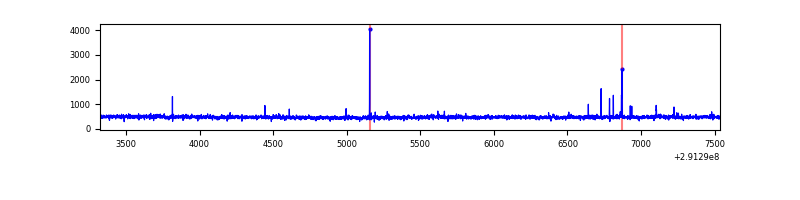 |
| B | 4213 | 4213 | 11 | 11 | 0.26% | 0.26% | 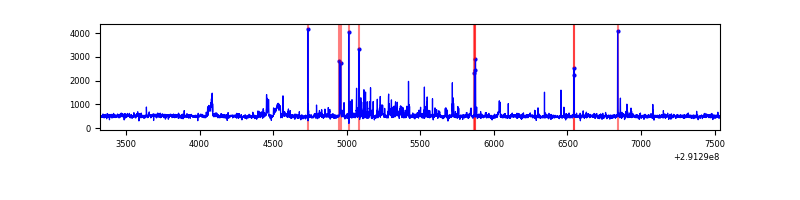 |
| C | 4213 | 4213 | 0 | 0 | 0.00% | 0.00% | 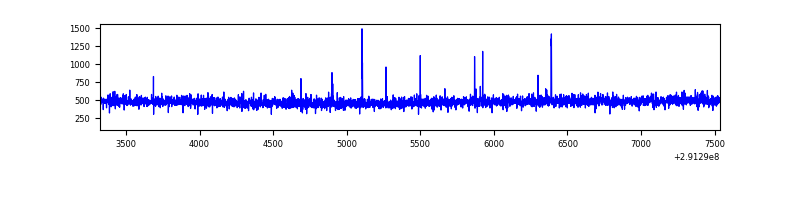 |
| D | 4213 | 4213 | 312 | 312 | 7.41% | 7.41% | 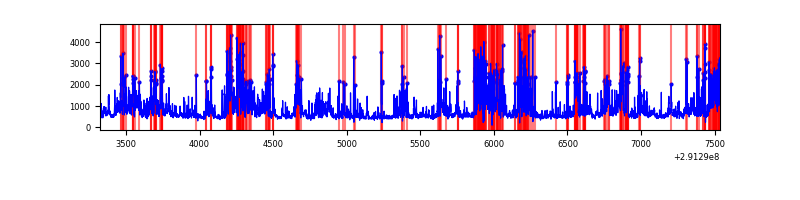 |
Top three noisy pixels from each quadrant. If the there are fewer than three noisy pixels in the level2.evt file, extra rows are filled as -1
| Pixel properties | Quadrant properties | ||||||
|---|---|---|---|---|---|---|---|
| Quadrant | DetID | PixID | Counts | Sigma | Mean | Median | Sigma |
| A | 6 | 16 | 20222 | 186.07 | 515 | 506 | 106.0 |
| A | 13 | 254 | 6719 | 58.63 | 515 | 506 | 106.0 |
| A | 9 | 143 | 5122 | 43.56 | 515 | 506 | 106.0 |
| B | 7 | 220 | 134882 | 1376.39 | 511 | 500 | 97.6 |
| B | 0 | 189 | 76157 | 774.91 | 511 | 500 | 97.6 |
| B | 0 | 198 | 28626 | 288.08 | 511 | 500 | 97.6 |
| C | 14 | 238 | 76616 | 659.98 | 491 | 495 | 115.3 |
| C | 3 | 233 | 8444 | 68.92 | 491 | 495 | 115.3 |
| C | 0 | 207 | 8025 | 65.29 | 491 | 495 | 115.3 |
| D | 12 | 218 | 885895 | 7520.68 | 482 | 469 | 117.7 |
| D | 12 | 1 | 418705 | 3552.43 | 482 | 469 | 117.7 |
| D | 1 | 52 | 303174 | 2571.13 | 482 | 469 | 117.7 |
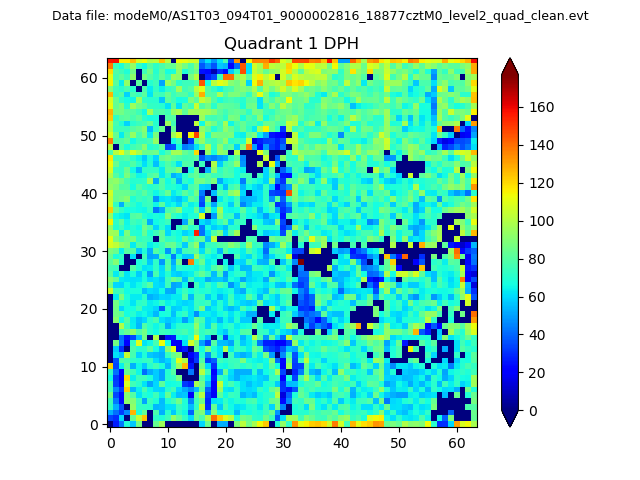
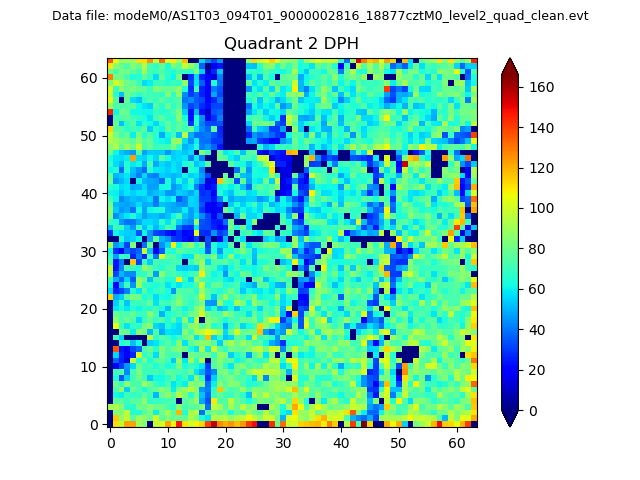
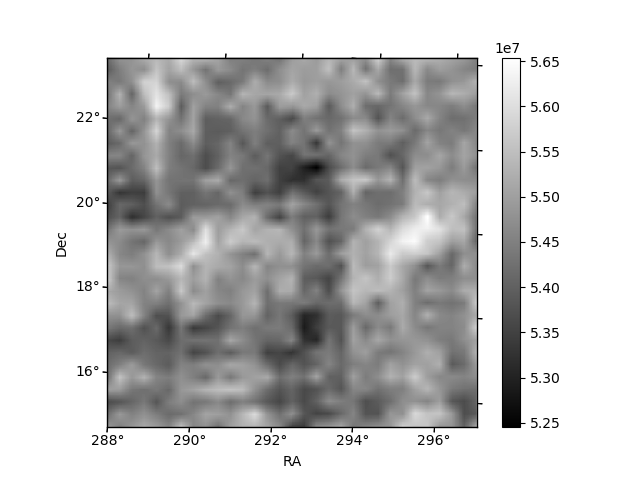
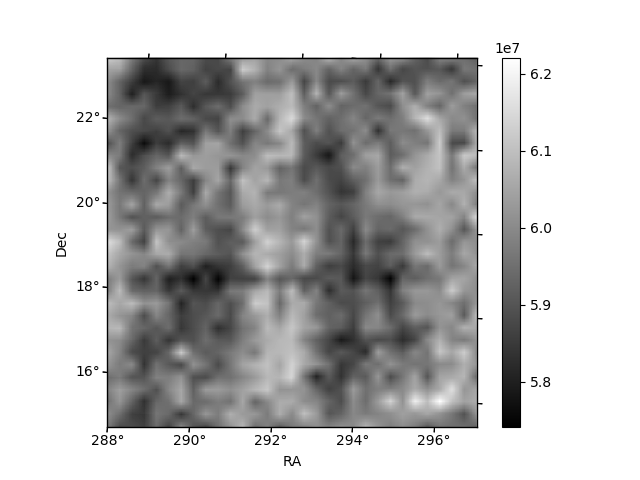
Histogram calculated using DETX and DETY for each event in the final _common_clean file
| Quadrant A |  |
 |
Quadrant B |
|---|---|---|---|
| Quadrant D | 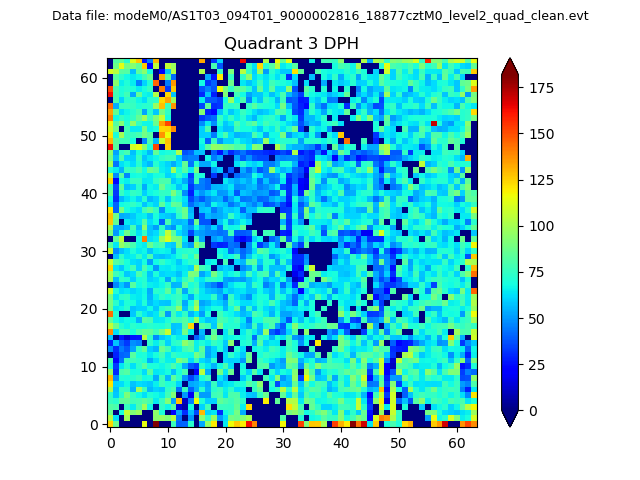 |
 |
Quadrant C |
| Plot type | Count rate plots | Images |
|---|---|---|
| Comparison with Poisson distribution Blue bars denote a histogram of data divided into 1 sec bins. Red curve is a Poisson curve with rate = median count rate of data. |
 |
 |
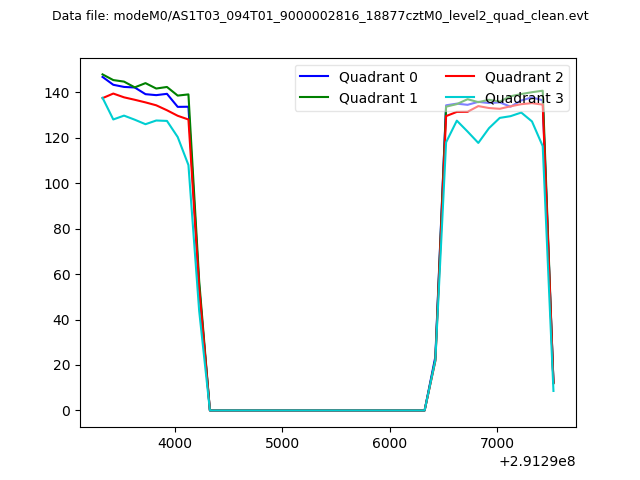
| Quadrant-wise count rates Data is divided into 100 sec bins |
 |
|
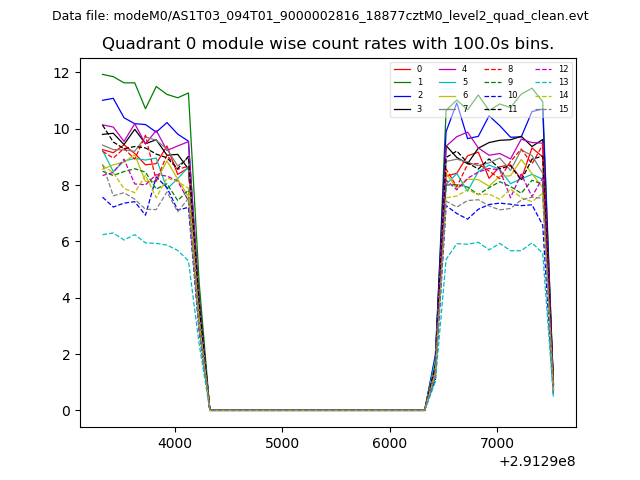
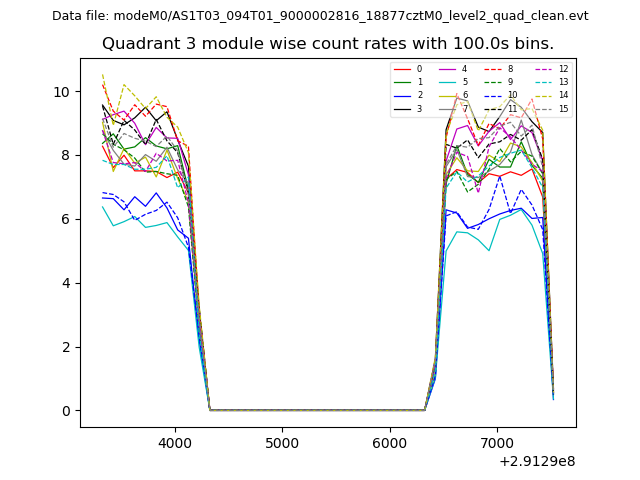
| Module-wise count rates for Quadrant A Data is divided into 100 sec bins |
 |
 |
| Module-wise count rates for Quadrant B Data is divided into 100 sec bins |
 |
 |
| Module-wise count rates for Quadrant C Data is divided into 100 sec bins |
 |
 |
| Module-wise count rates for Quadrant D Data is divided into 100 sec bins |
 |
 |
| Parameter | Plot |
|---|---|
| CZT HV Monitor |  |
| D_VDD | 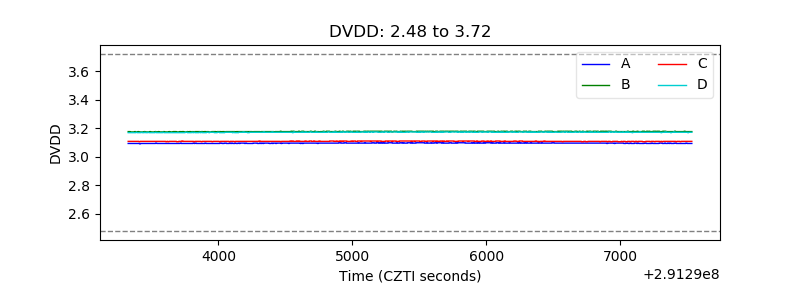 |
| Temperature 1 | 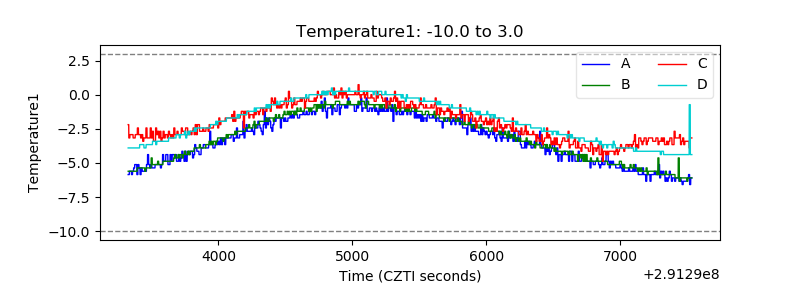 |
| Veto HV Monitor | 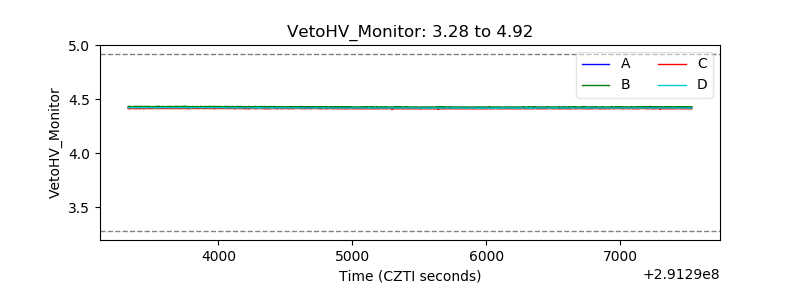 |
| Veto LLD | 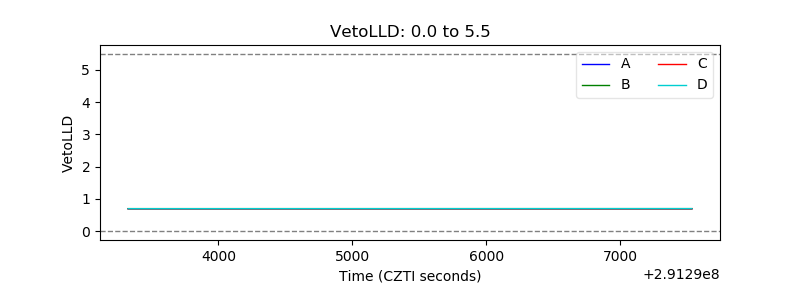 |
| Alpha Counter | 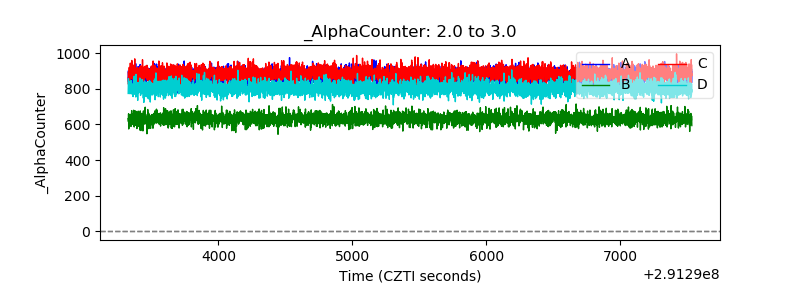 |
| _CPM_Rate | 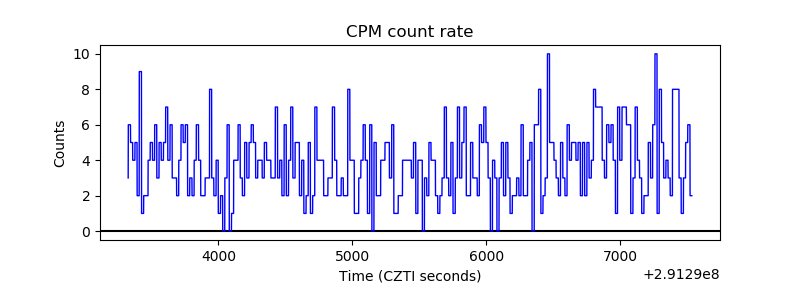 |
| CZT Counter | 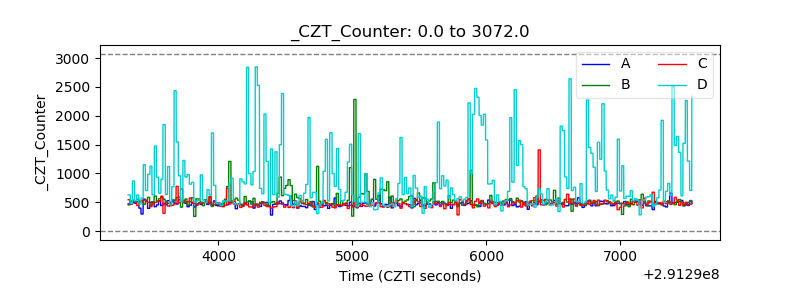 |
| +2.5 Volts monitor |  |
| +5 Volts monitor |  |
| _ROLL_ROT | 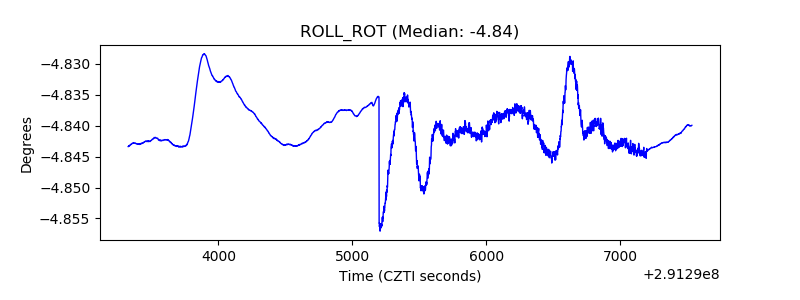 |
| _Roll_DEC | 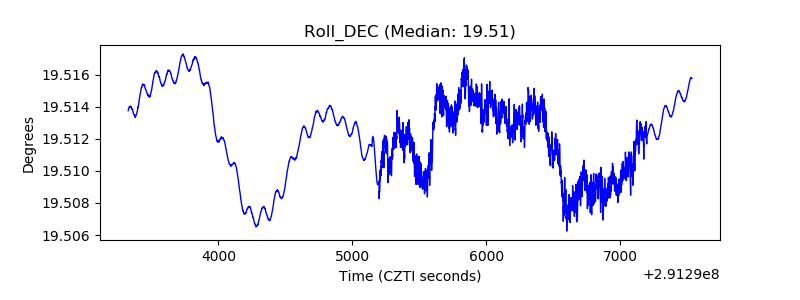 |
| _Roll_RA | 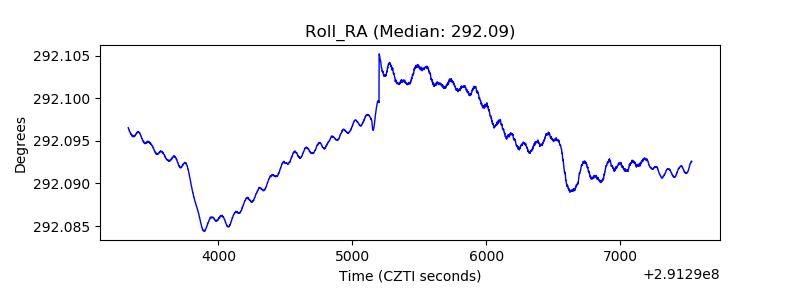 |
| Veto Counter | 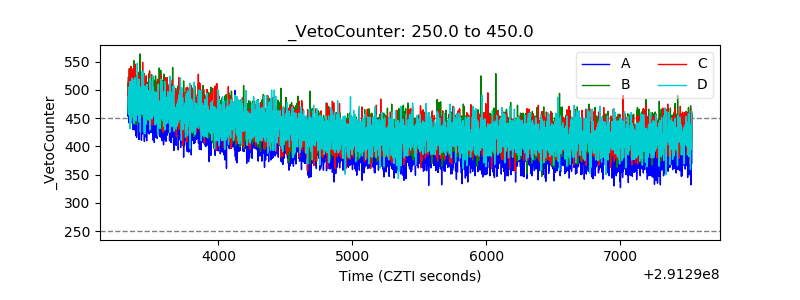 |