| Param | Original file | Final file |
|---|---|---|
| Filename | modeM0/AS1A06_003T07_9000002818cztM0_level2.fits | modeM0/AS1A06_003T07_9000002818cztM0_level2_quad_clean.evt |
| Size (bytes) | 1,050,978,240 | 1,087,214,400 |
| Size | 1002.3 MB | 1.0 GB |
| Events in quadrant A | 6,482,038 | 6,750,382 |
| Events in quadrant B | 5,888,016 | 6,131,063 |
| Events in quadrant C | 6,335,118 | 6,524,950 |
| Events in quadrant D | 5,481,784 | 5,885,754 |
| Mode SS | |||
|---|---|---|---|
| Quadrant | BADHDUFLAG | Total packets | Discarded packets |
| A | 0 | 2270 | 0 |
| B | 0 | 2270 | 0 |
| C | 0 | 2270 | 0 |
| D | 0 | 2270 | 0 |
| Mode M9 | |||
|---|---|---|---|
| Quadrant | BADHDUFLAG | Total packets | Discarded packets |
| A | 0 | 154 | 0 |
| B | 0 | 154 | 0 |
| C | 0 | 154 | 0 |
| D | 0 | 154 | 0 |
| Mode M0 | |||
|---|---|---|---|
| Quadrant | BADHDUFLAG | Total packets | Discarded packets |
| A | 0 | 259556 | 0 |
| B | 0 | 317148 | 0 |
| C | 0 | 231947 | 0 |
| D | 0 | 288481 | 0 |
| Quadrant | Total seconds | Saturated seconds | Saturation percentage |
|---|---|---|---|
| A | 111382 | 3411 | 3.062434% |
| B | 111382 | 12285 | 11.029610% |
| C | 111382 | 1990 | 1.786644% |
| D | 111382 | 4445 | 3.990771% |
Noise dominated data is calculated using 1-second bins in cleaned event files. If a bin has >2000 counts, and if more than 50% of those come from <1% of pixels, then it is considered to be noise-dominated and hence unusable.
| Quadrant | # 1 sec bins | Bins with >0 counts | Bins with >2000 counts | High rate bins dominated by noise | Noise dominated (total time) | Noise dominated (detector-on time) | Marked lightcurve |
|---|---|---|---|---|---|---|---|
| A | 126331 | 111382 | 0 | 0 | 0.00% | 0.00% |  |
| B | 126331 | 110564 | 0 | 0 | 0.00% | 0.00% |  |
| C | 126331 | 111383 | 0 | 0 | 0.00% | 0.00% |  |
| D | 126331 | 111348 | 0 | 0 | 0.00% | 0.00% |  |
Top three noisy pixels from each quadrant. If the there are fewer than three noisy pixels in the level2.evt file, extra rows are filled as -1
| Pixel properties | Quadrant properties | ||||||
|---|---|---|---|---|---|---|---|
| Quadrant | DetID | PixID | Counts | Sigma | Mean | Median | Sigma |
| A | 0 | 29 | 5429 | 9.37 | 1689 | 1588 | 409.8 |
| A | 7 | 110 | 5230 | 8.89 | 1689 | 1588 | 409.8 |
| A | 9 | 19 | 4813 | 7.87 | 1689 | 1588 | 409.8 |
| B | 2 | 9 | 4860 | 11.24 | 1559 | 1491 | 299.8 |
| B | 2 | 8 | 4123 | 8.78 | 1559 | 1491 | 299.8 |
| B | 14 | 254 | 3918 | 8.1 | 1559 | 1491 | 299.8 |
| C | 12 | 241 | 4351 | 6.49 | 1676 | 1562 | 429.8 |
| C | 3 | 126 | 4224 | 6.19 | 1676 | 1562 | 429.8 |
| C | 2 | 191 | 4178 | 6.09 | 1676 | 1562 | 429.8 |
| D | 10 | 190 | 4126 | 6.52 | 1566 | 1425 | 414.0 |
| D | 3 | 14 | 3945 | 6.09 | 1566 | 1425 | 414.0 |
| D | 10 | 189 | 3858 | 5.88 | 1566 | 1425 | 414.0 |
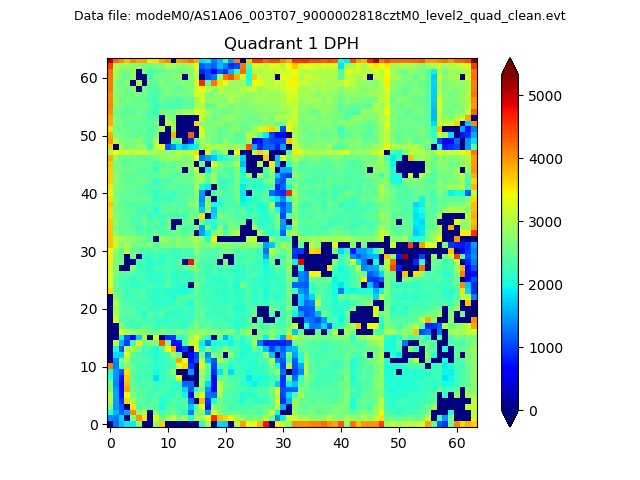
Histogram calculated using DETX and DETY for each event in the final _common_clean file
| Quadrant A |  |
 |
Quadrant B |
|---|---|---|---|
| Quadrant D |  |
 |
Quadrant C |
| Plot type | Count rate plots | Images |
|---|---|---|
| Comparison with Poisson distribution Blue bars denote a histogram of data divided into 1 sec bins. Red curve is a Poisson curve with rate = median count rate of data. |
 |
 |
| Quadrant-wise count rates Data is divided into 100 sec bins |
 |
|
| Module-wise count rates for Quadrant A Data is divided into 100 sec bins |
 |
 |
| Module-wise count rates for Quadrant B Data is divided into 100 sec bins |
 |
 |
| Module-wise count rates for Quadrant C Data is divided into 100 sec bins |
 |
 |
| Module-wise count rates for Quadrant D Data is divided into 100 sec bins |
 |
 |
| Parameter | Plot |
|---|---|
| CZT HV Monitor | 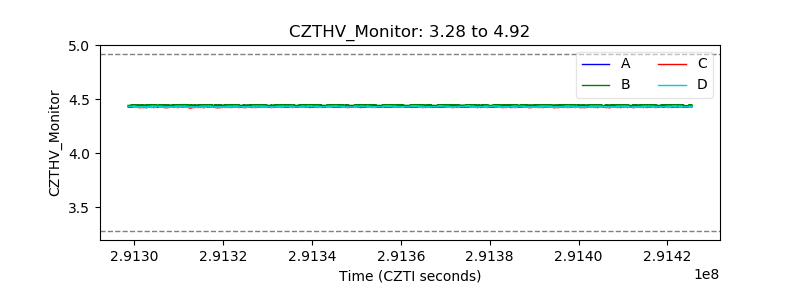 |
| D_VDD |  |
| Temperature 1 |  |
| Veto HV Monitor |  |
| Veto LLD |  |
| Alpha Counter |  |
| _CPM_Rate |  |
| CZT Counter | 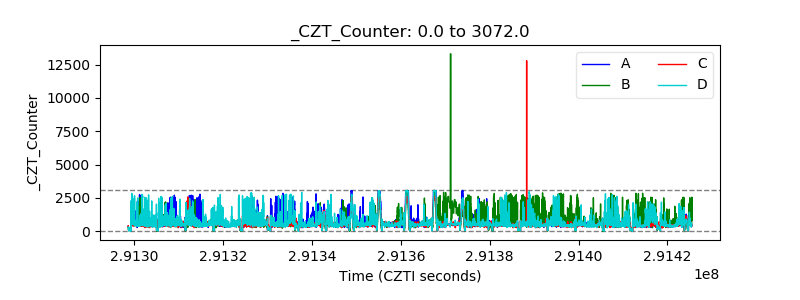 |
| +2.5 Volts monitor |  |
| +5 Volts monitor |  |
| _ROLL_ROT |  |
| _Roll_DEC |  |
| _Roll_RA | 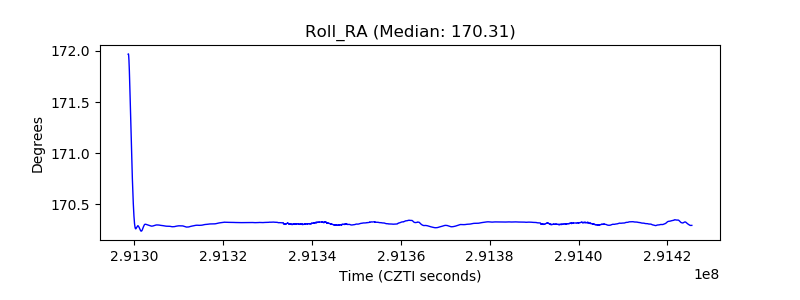 |
| Veto Counter | 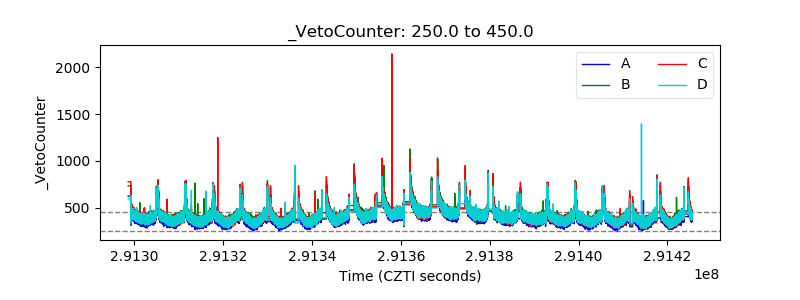 |