| Param | Original file | Final file |
|---|---|---|
| Filename | modeM0/AS1A06_003T07_9000002818_18877cztM0_level2.evt | modeM0/AS1A06_003T07_9000002818_18877cztM0_level2_quad_clean.evt |
| Size (bytes) | 151,153,920 | 17,968,320 |
| Size | 144.2 MB | 17.1 MB |
| Events in quadrant A | 1,056,127 | 107,934 |
| Events in quadrant B | 893,847 | 111,586 |
| Events in quadrant C | 799,921 | 103,963 |
| Events in quadrant D | 1,714,452 | 99,692 |
| Mode SS | |||
|---|---|---|---|
| Quadrant | BADHDUFLAG | Total packets | Discarded packets |
| A | 0 | 34 | 0 |
| B | 0 | 34 | 0 |
| C | 0 | 34 | 0 |
| D | 0 | 34 | 0 |
| Mode M9 | |||
|---|---|---|---|
| Quadrant | BADHDUFLAG | Total packets | Discarded packets |
| A | 0 | 6 | 0 |
| B | 0 | 6 | 0 |
| C | 0 | 6 | 0 |
| D | 0 | 6 | 0 |
| Mode M0 | |||
|---|---|---|---|
| Quadrant | BADHDUFLAG | Total packets | Discarded packets |
| A | 0 | 4113 | 2 |
| B | 0 | 3622 | 2 |
| C | 0 | 3349 | 2 |
| D | 0 | 6172 | 2 |
| Quadrant | Total seconds | Saturated seconds | Saturation percentage |
|---|---|---|---|
| A | 1629 | 72 | 4.419890% |
| B | 1629 | 22 | 1.350522% |
| C | 1629 | 22 | 1.350522% |
| D | 1629 | 321 | 19.705341% |
Noise dominated data is calculated using 1-second bins in cleaned event files. If a bin has >2000 counts, and if more than 50% of those come from <1% of pixels, then it is considered to be noise-dominated and hence unusable.
| Quadrant | # 1 sec bins | Bins with >0 counts | Bins with >2000 counts | High rate bins dominated by noise | Noise dominated (total time) | Noise dominated (detector-on time) | Marked lightcurve |
|---|---|---|---|---|---|---|---|
| A | 1644 | 1630 | 30 | 30 | 1.82% | 1.84% | 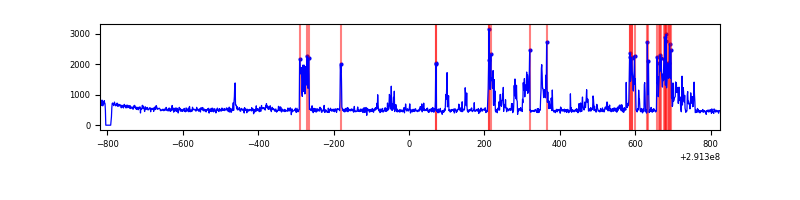 |
| B | 1644 | 1630 | 2 | 2 | 0.12% | 0.12% | 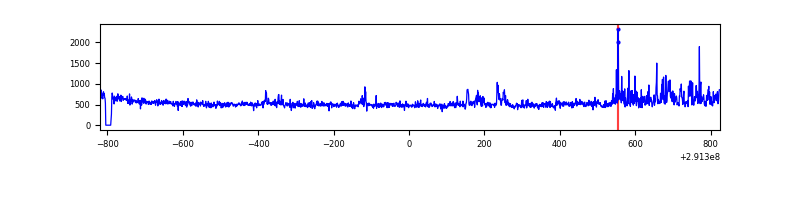 |
| C | 1644 | 1630 | 0 | 0 | 0.00% | 0.00% | 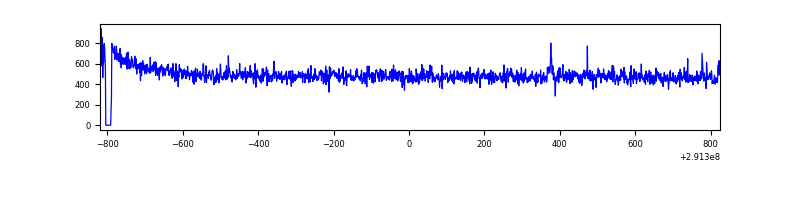 |
| D | 1644 | 1630 | 232 | 232 | 14.11% | 14.23% | 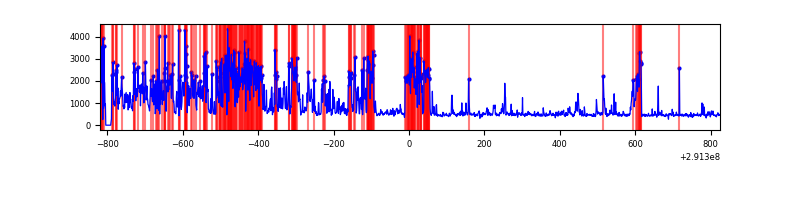 |
Top three noisy pixels from each quadrant. If the there are fewer than three noisy pixels in the level2.evt file, extra rows are filled as -1
| Pixel properties | Quadrant properties | ||||||
|---|---|---|---|---|---|---|---|
| Quadrant | DetID | PixID | Counts | Sigma | Mean | Median | Sigma |
| A | 6 | 16 | 256094 | 5850.96 | 206 | 201 | 43.7 |
| A | 15 | 174 | 3255 | 69.83 | 206 | 201 | 43.7 |
| A | 13 | 254 | 1871 | 38.18 | 206 | 201 | 43.7 |
| B | 7 | 220 | 49090 | 1191.19 | 204 | 200 | 41.0 |
| B | 0 | 189 | 27310 | 660.53 | 204 | 200 | 41.0 |
| B | 0 | 198 | 5157 | 120.78 | 204 | 200 | 41.0 |
| C | 14 | 238 | 30796 | 659.65 | 193 | 193 | 46.4 |
| C | 3 | 233 | 12028 | 255.11 | 193 | 193 | 46.4 |
| C | 5 | 112 | 2411 | 47.81 | 193 | 193 | 46.4 |
| D | 12 | 1 | 607342 | 13066.93 | 183 | 177 | 46.5 |
| D | 1 | 52 | 245677 | 5283.46 | 183 | 177 | 46.5 |
| D | 7 | 238 | 77075 | 1654.94 | 183 | 177 | 46.5 |
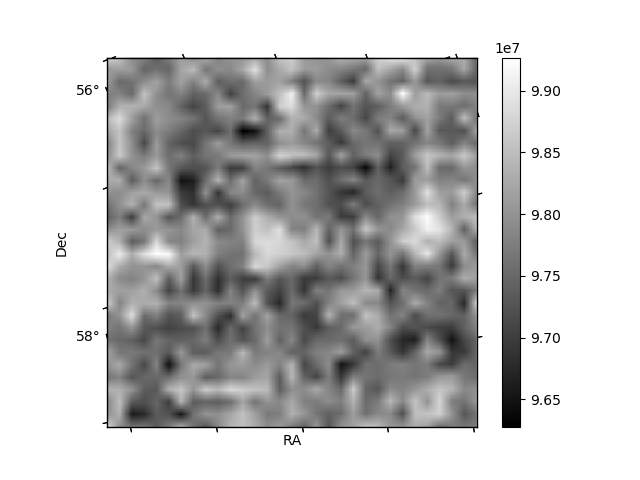
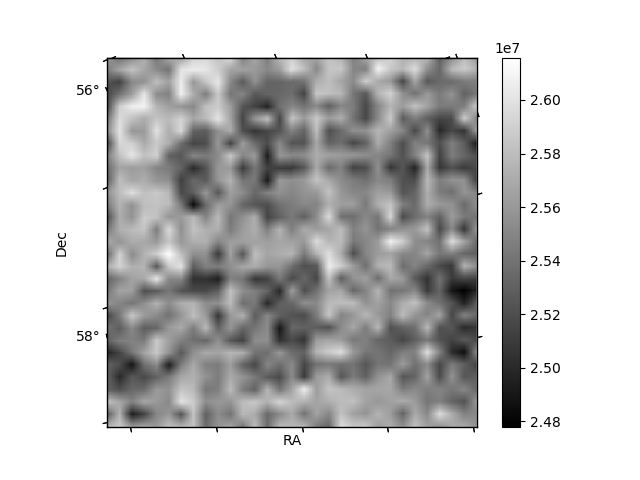
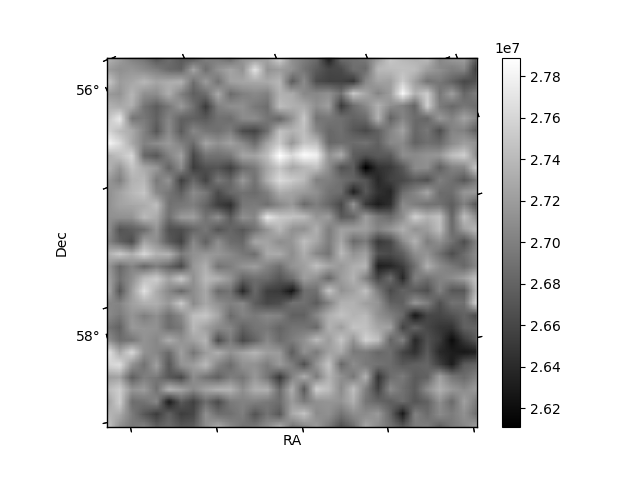
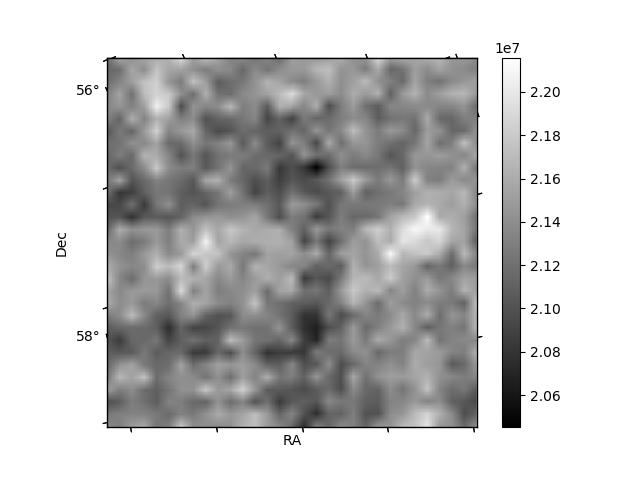
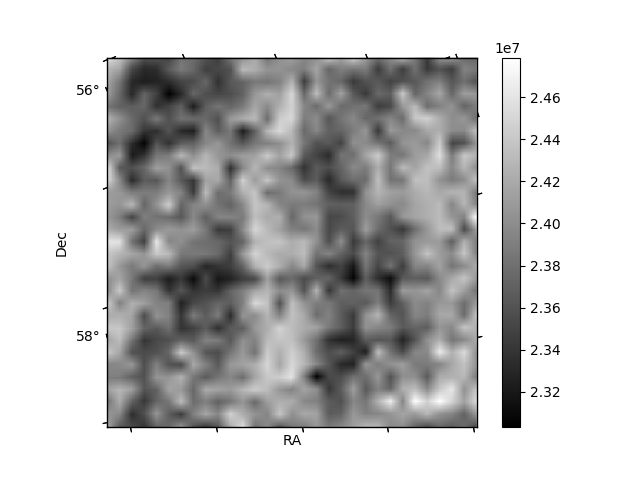
Histogram calculated using DETX and DETY for each event in the final _common_clean file
| Quadrant A | 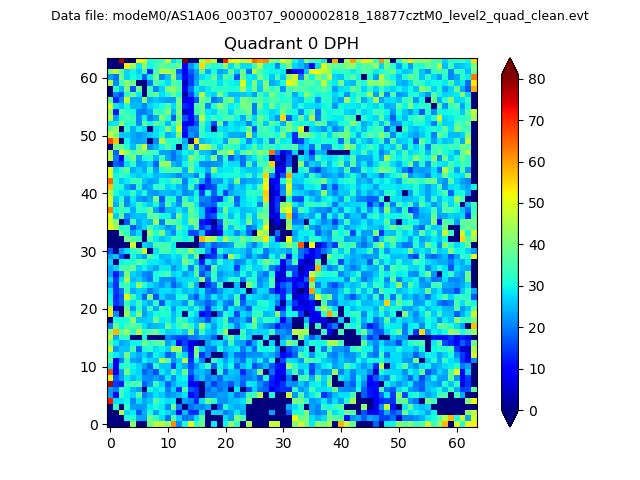 |
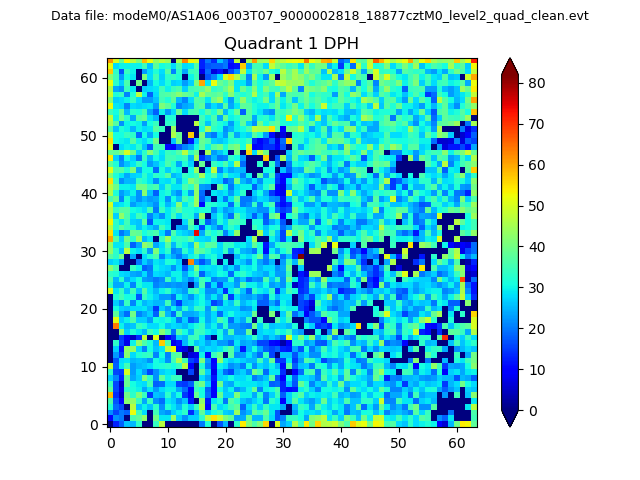 |
Quadrant B |
|---|---|---|---|
| Quadrant D | 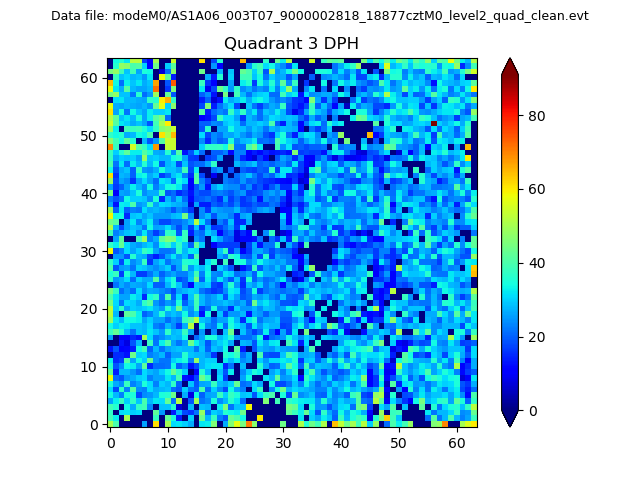 |
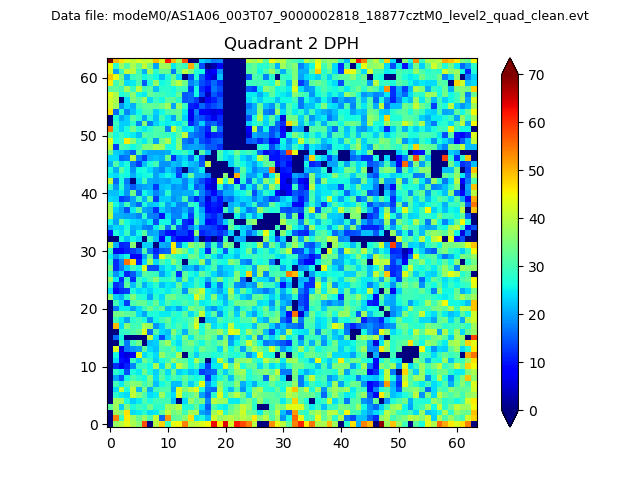 |
Quadrant C |
| Plot type | Count rate plots | Images |
|---|---|---|
| Comparison with Poisson distribution Blue bars denote a histogram of data divided into 1 sec bins. Red curve is a Poisson curve with rate = median count rate of data. |
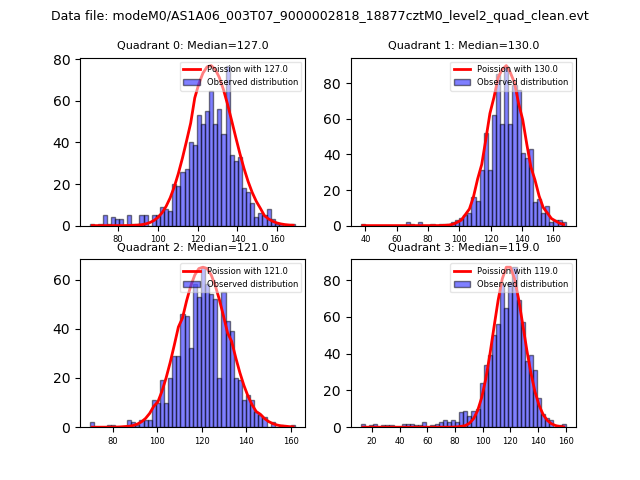 |
 |
| Quadrant-wise count rates Data is divided into 100 sec bins |
 |
|
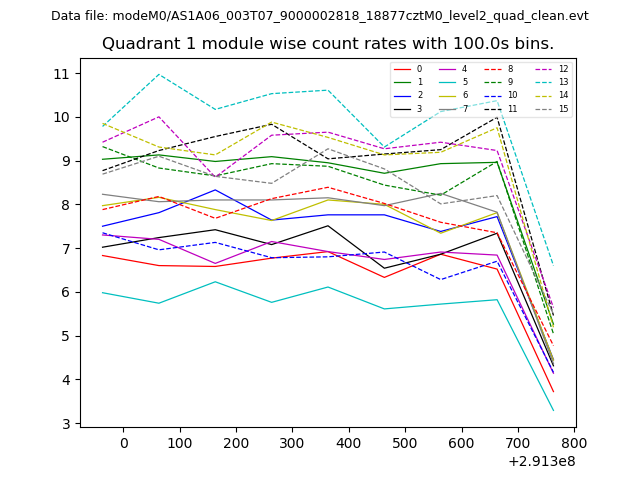
| Module-wise count rates for Quadrant A Data is divided into 100 sec bins |
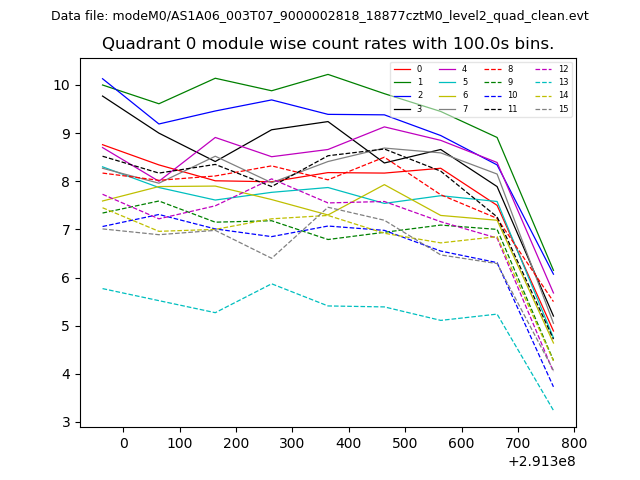 |
 |
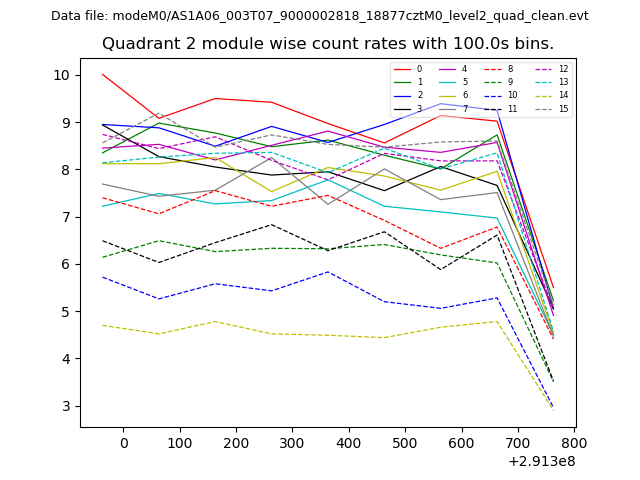
| Module-wise count rates for Quadrant B Data is divided into 100 sec bins |
 |
 |
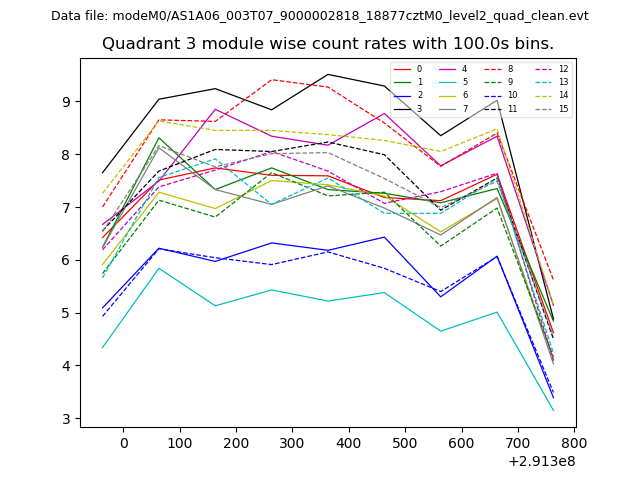
| Module-wise count rates for Quadrant C Data is divided into 100 sec bins |
 |
 |
| Module-wise count rates for Quadrant D Data is divided into 100 sec bins |
 |
 |
| Parameter | Plot |
|---|---|
| CZT HV Monitor | 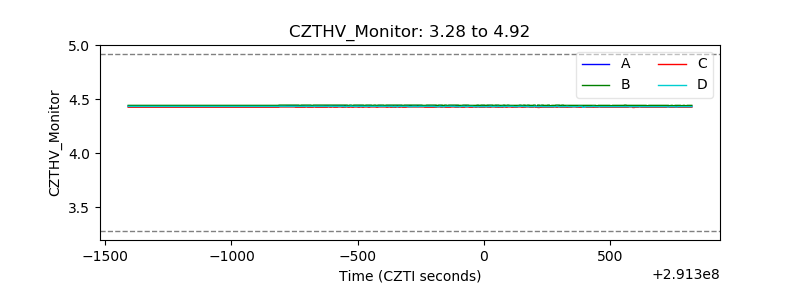 |
| D_VDD | 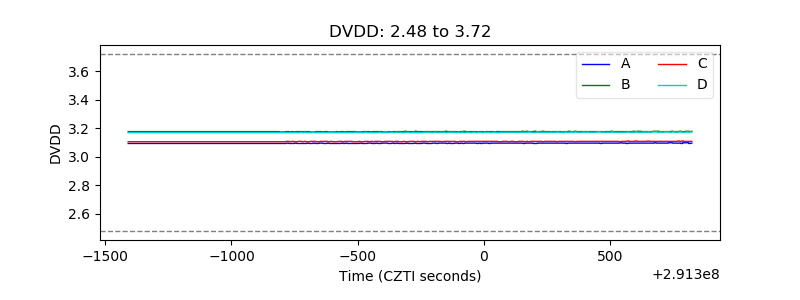 |
| Temperature 1 | 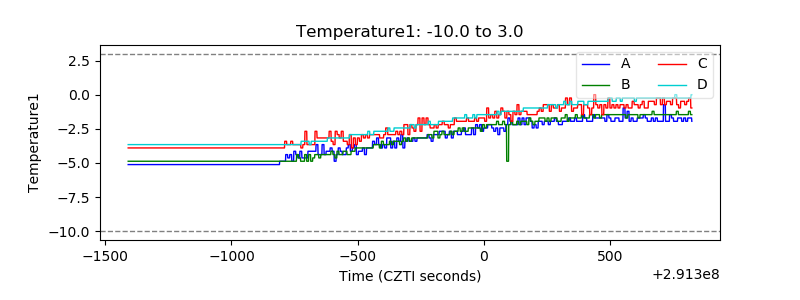 |
| Veto HV Monitor |  |
| Veto LLD | 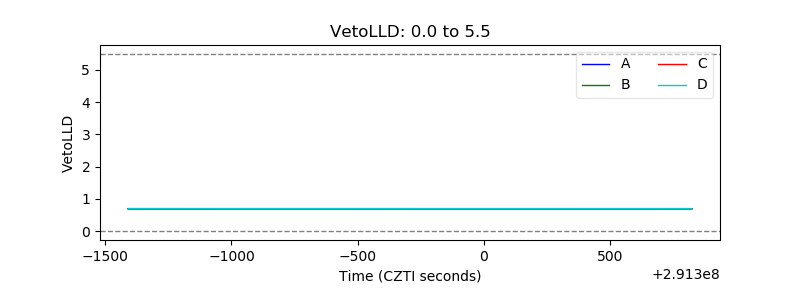 |
| Alpha Counter | 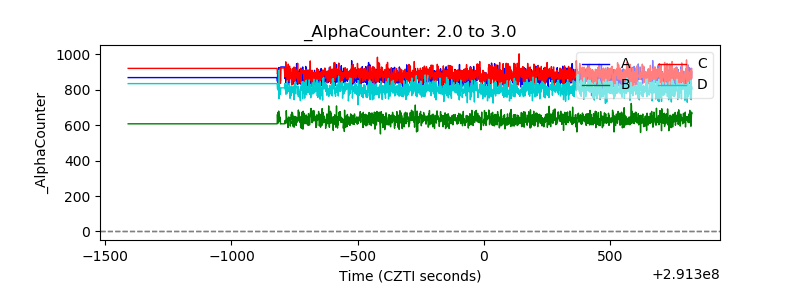 |
| _CPM_Rate | 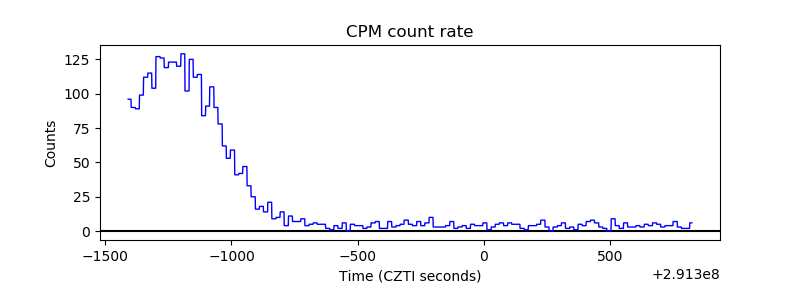 |
| CZT Counter | 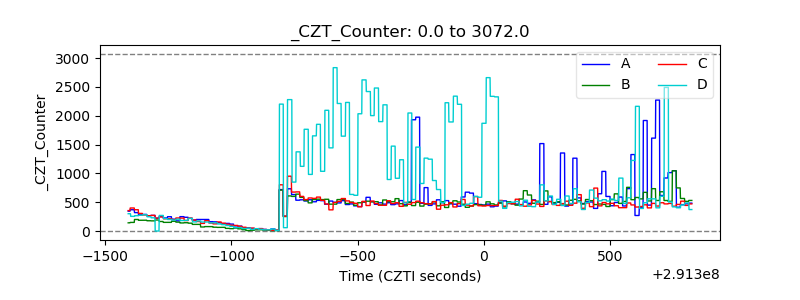 |
| +2.5 Volts monitor |  |
| +5 Volts monitor |  |
| _ROLL_ROT | 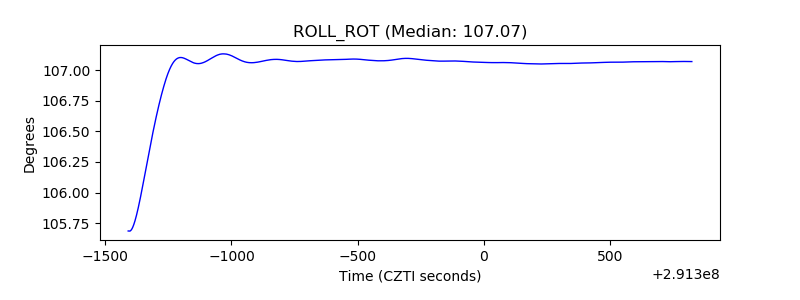 |
| _Roll_DEC | 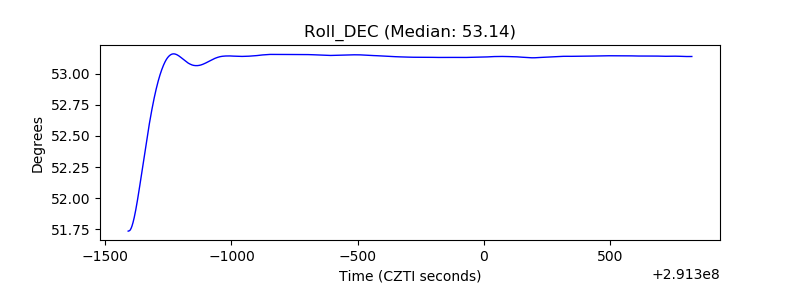 |
| _Roll_RA | 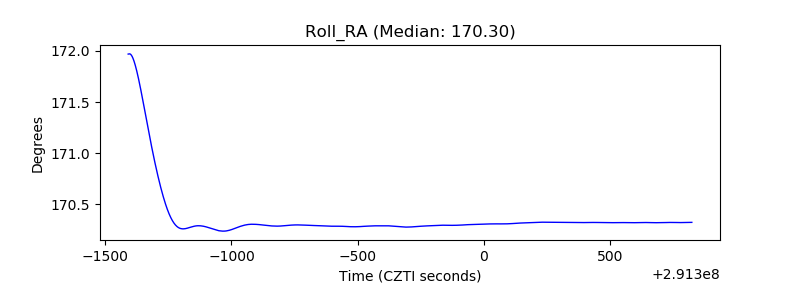 |
| Veto Counter | 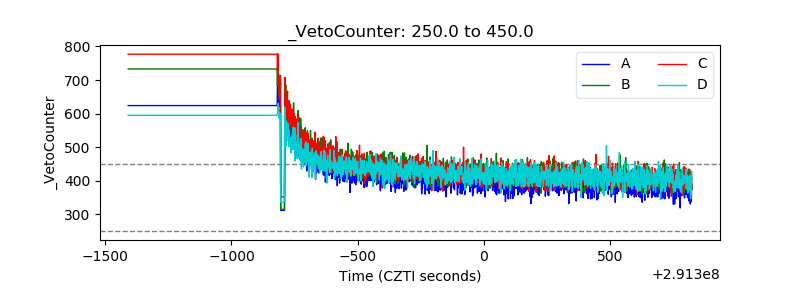 |