| Param | Original file | Final file |
|---|---|---|
| Filename | modeM0/AS1A06_003T07_9000002818_18879cztM0_level2.evt | modeM0/AS1A06_003T07_9000002818_18879cztM0_level2_quad_clean.evt |
| Size (bytes) | 683,190,720 | 106,896,960 |
| Size | 651.5 MB | 101.9 MB |
| Events in quadrant A | 6,379,237 | 666,042 |
| Events in quadrant B | 4,276,754 | 711,734 |
| Events in quadrant C | 4,058,550 | 672,045 |
| Events in quadrant D | 5,457,580 | 654,464 |
| Mode SS | |||
|---|---|---|---|
| Quadrant | BADHDUFLAG | Total packets | Discarded packets |
| A | 0 | 154 | 0 |
| B | 0 | 154 | 0 |
| C | 0 | 154 | 0 |
| D | 0 | 154 | 0 |
| Mode M0 | |||
|---|---|---|---|
| Quadrant | BADHDUFLAG | Total packets | Discarded packets |
| A | 0 | 23943 | 2 |
| B | 0 | 17795 | 2 |
| C | 0 | 17089 | 2 |
| D | 0 | 21320 | 3 |
| Quadrant | Total seconds | Saturated seconds | Saturation percentage |
|---|---|---|---|
| A | 7653 | 905 | 11.825428% |
| B | 7654 | 237 | 3.096420% |
| C | 7654 | 420 | 5.487327% |
| D | 7653 | 394 | 5.148308% |
Noise dominated data is calculated using 1-second bins in cleaned event files. If a bin has >2000 counts, and if more than 50% of those come from <1% of pixels, then it is considered to be noise-dominated and hence unusable.
| Quadrant | # 1 sec bins | Bins with >0 counts | Bins with >2000 counts | High rate bins dominated by noise | Noise dominated (total time) | Noise dominated (detector-on time) | Marked lightcurve |
|---|---|---|---|---|---|---|---|
| A | 7743 | 7655 | 625 | 625 | 8.07% | 8.16% | 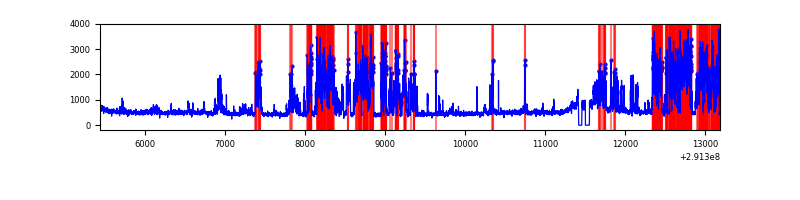 |
| B | 7744 | 7656 | 30 | 30 | 0.39% | 0.39% | 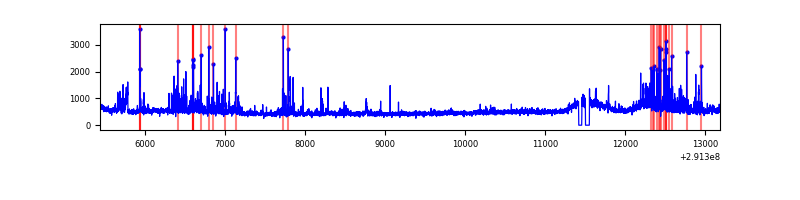 |
| C | 7744 | 7656 | 108 | 108 | 1.39% | 1.41% | 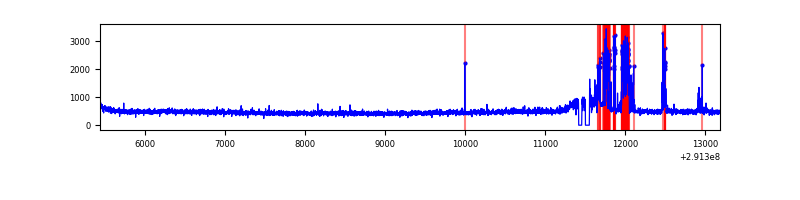 |
| D | 7743 | 7655 | 209 | 209 | 2.70% | 2.73% | 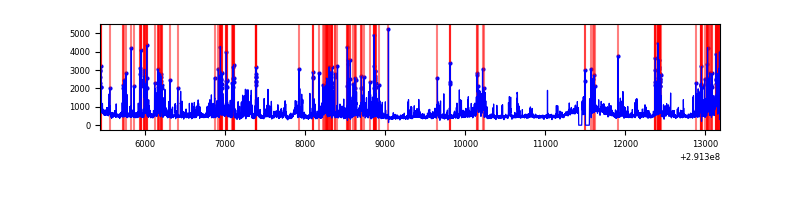 |
Top three noisy pixels from each quadrant. If the there are fewer than three noisy pixels in the level2.evt file, extra rows are filled as -1
| Pixel properties | Quadrant properties | ||||||
|---|---|---|---|---|---|---|---|
| Quadrant | DetID | PixID | Counts | Sigma | Mean | Median | Sigma |
| A | 6 | 16 | 2834818 | 15450.04 | 906 | 885 | 183.4 |
| A | 0 | 13 | 25513 | 134.27 | 906 | 885 | 183.4 |
| A | 13 | 254 | 11690 | 58.91 | 906 | 885 | 183.4 |
| B | 7 | 220 | 343231 | 1916.13 | 929 | 903 | 178.7 |
| B | 0 | 189 | 198484 | 1105.93 | 929 | 903 | 178.7 |
| B | 4 | 171 | 37486 | 204.77 | 929 | 903 | 178.7 |
| C | 12 | 4 | 436682 | 2094.31 | 888 | 893 | 208.1 |
| C | 14 | 238 | 136719 | 652.75 | 888 | 893 | 208.1 |
| C | 3 | 233 | 13849 | 62.26 | 888 | 893 | 208.1 |
| D | 1 | 52 | 843955 | 3845.45 | 901 | 871 | 219.2 |
| D | 12 | 218 | 744694 | 3392.7 | 901 | 871 | 219.2 |
| D | 7 | 238 | 210502 | 956.16 | 901 | 871 | 219.2 |
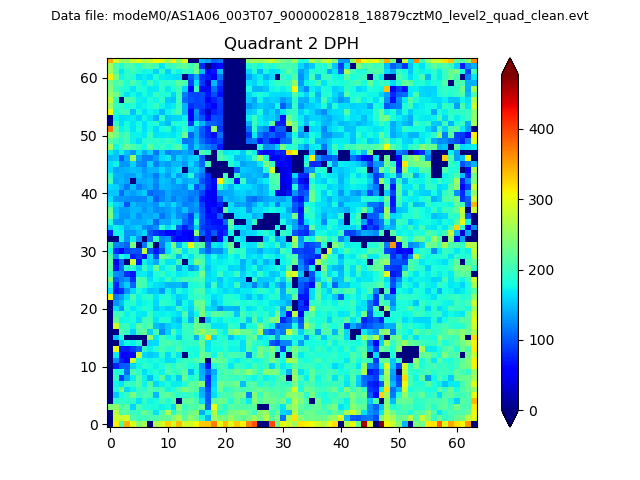
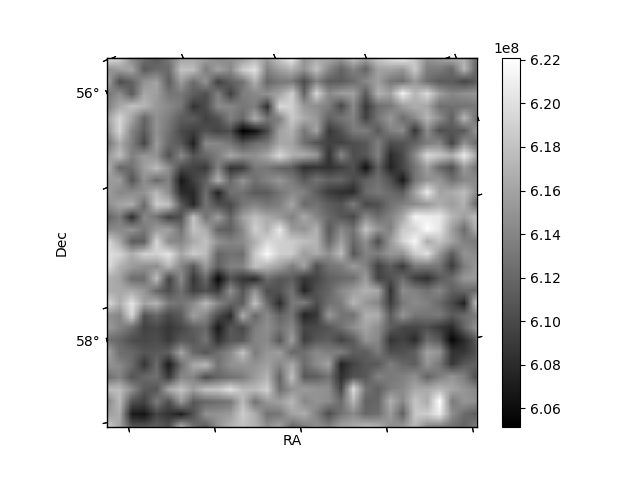
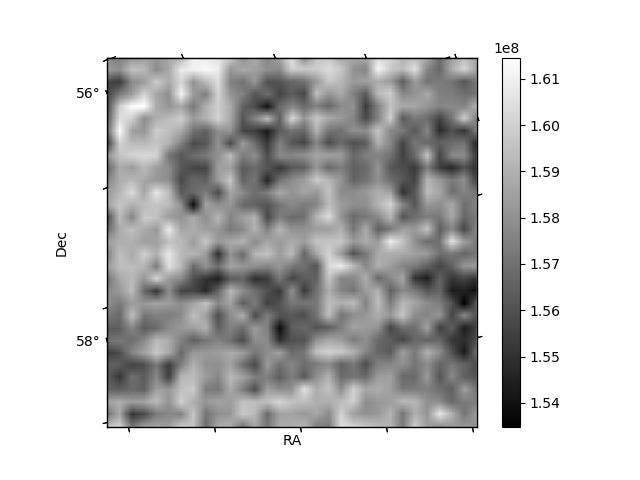
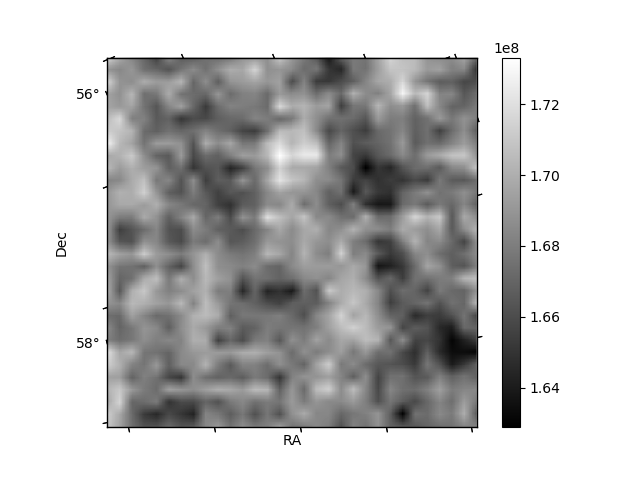
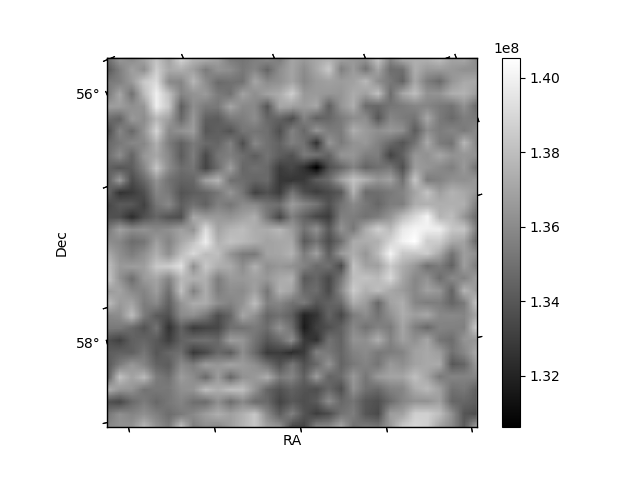
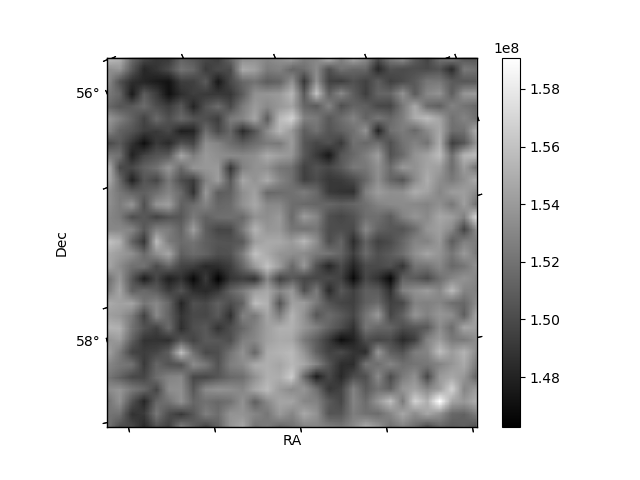
Histogram calculated using DETX and DETY for each event in the final _common_clean file
| Quadrant A | 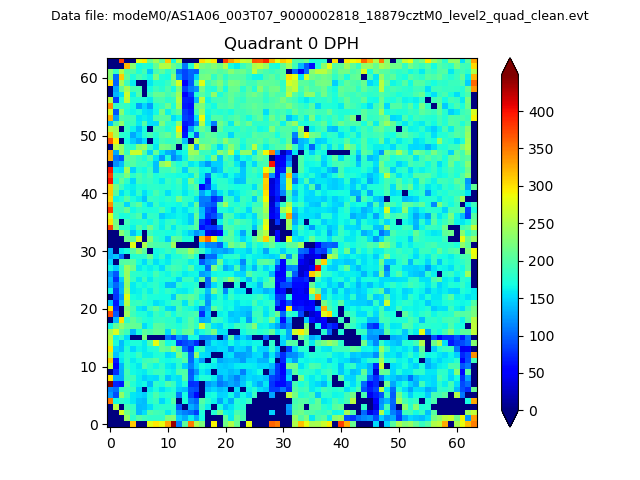 |
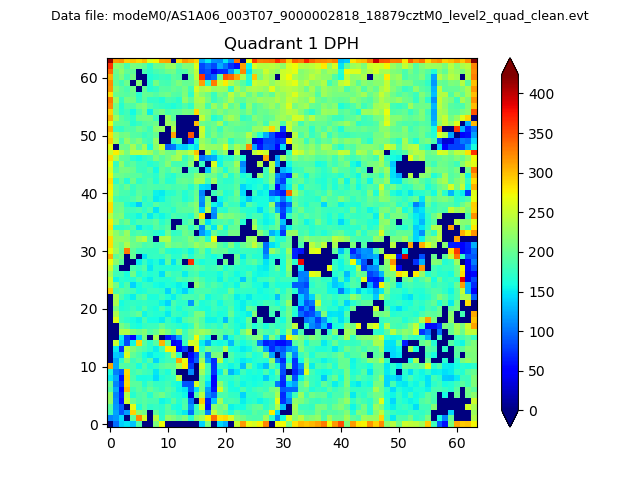 |
Quadrant B |
|---|---|---|---|
| Quadrant D | 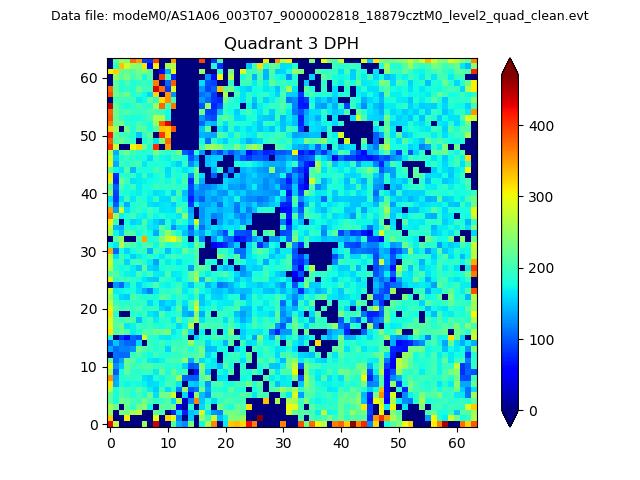 |
 |
Quadrant C |
| Plot type | Count rate plots | Images |
|---|---|---|
| Comparison with Poisson distribution Blue bars denote a histogram of data divided into 1 sec bins. Red curve is a Poisson curve with rate = median count rate of data. |
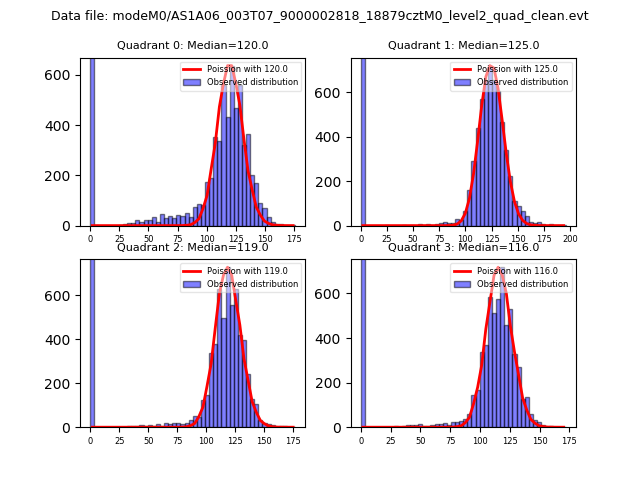 |
 |
| Quadrant-wise count rates Data is divided into 100 sec bins |
 |
|
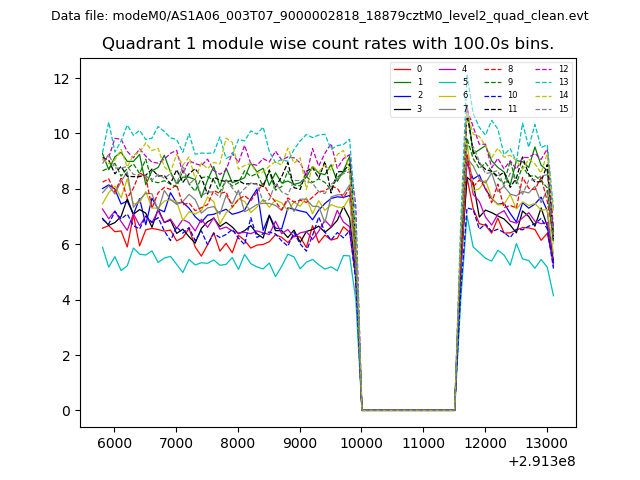
| Module-wise count rates for Quadrant A Data is divided into 100 sec bins |
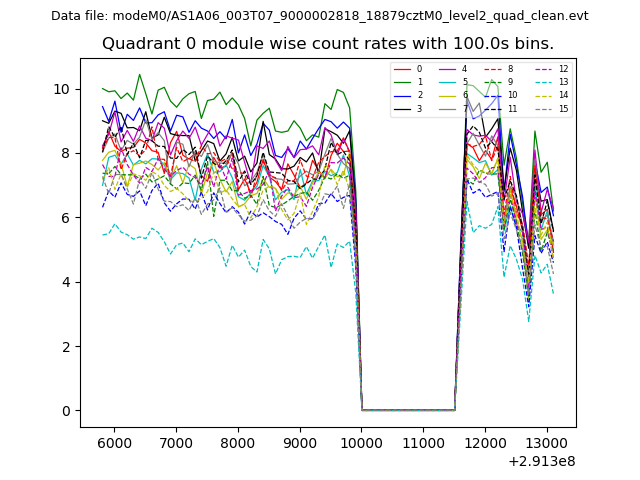 |
 |
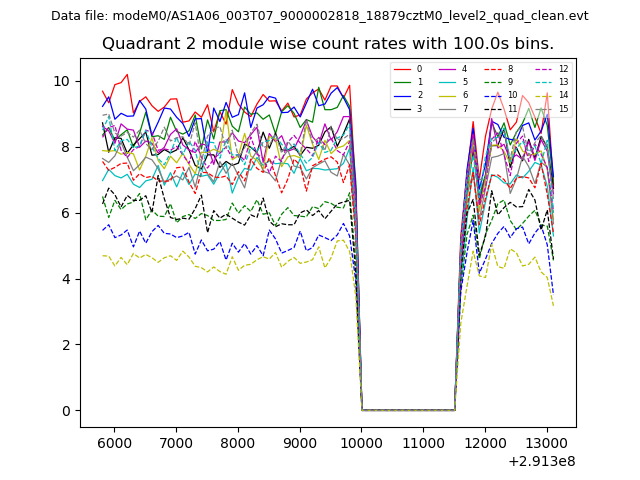
| Module-wise count rates for Quadrant B Data is divided into 100 sec bins |
 |
 |
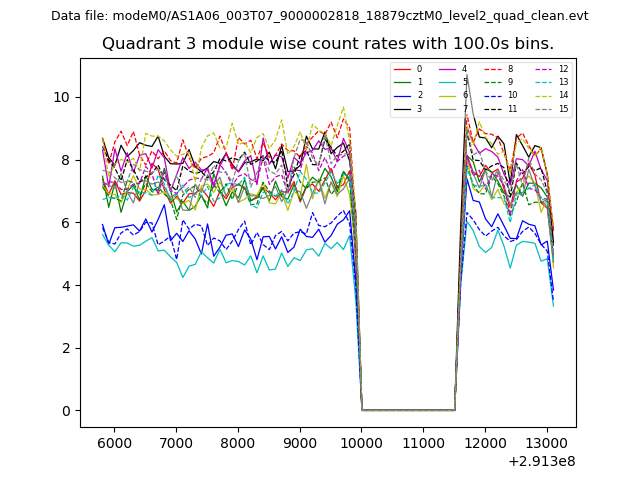
| Module-wise count rates for Quadrant C Data is divided into 100 sec bins |
 |
 |
| Module-wise count rates for Quadrant D Data is divided into 100 sec bins |
 |
 |
| Parameter | Plot |
|---|---|
| CZT HV Monitor | 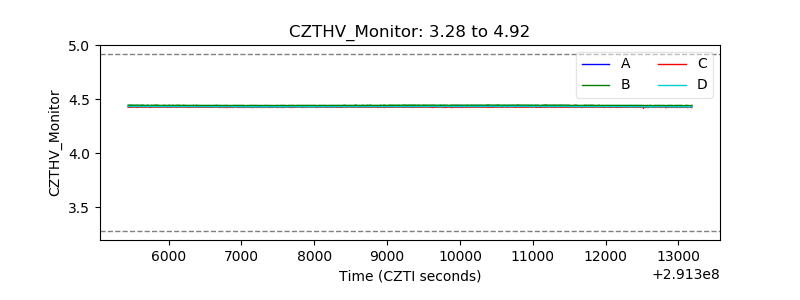 |
| D_VDD | 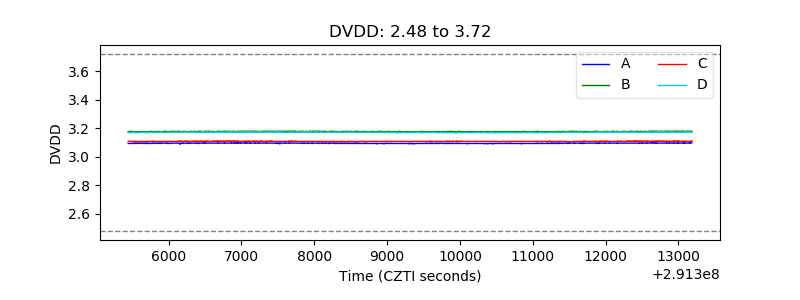 |
| Temperature 1 | 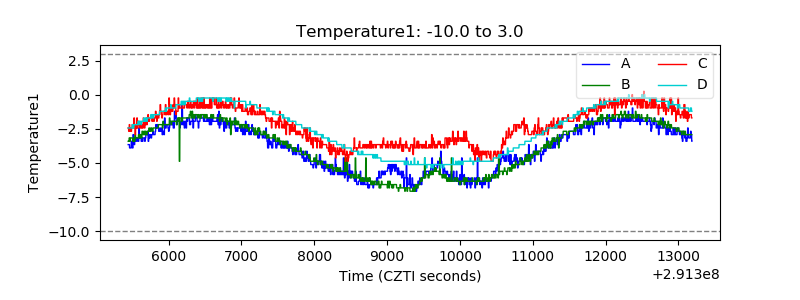 |
| Veto HV Monitor | 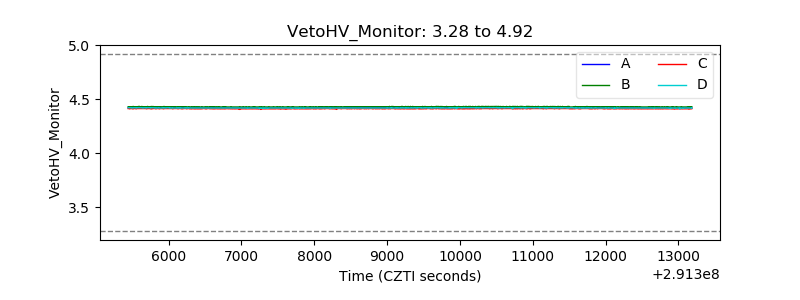 |
| Veto LLD | 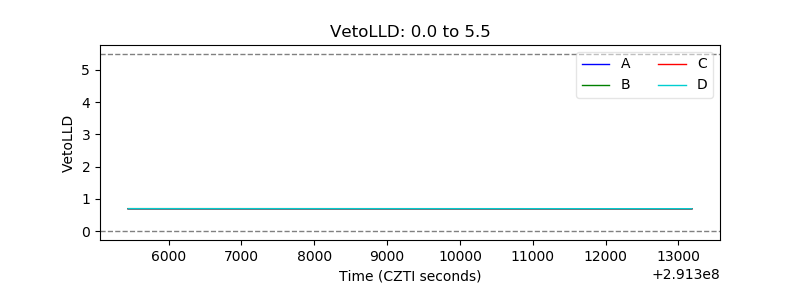 |
| Alpha Counter |  |
| _CPM_Rate | 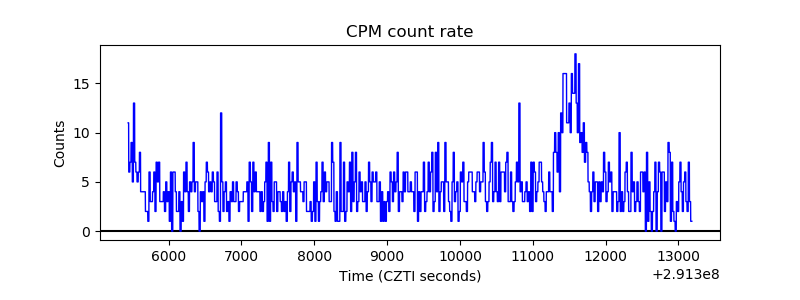 |
| CZT Counter |  |
| +2.5 Volts monitor |  |
| +5 Volts monitor |  |
| _ROLL_ROT | 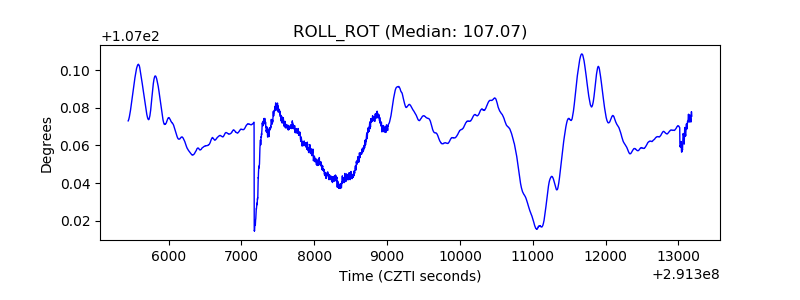 |
| _Roll_DEC | 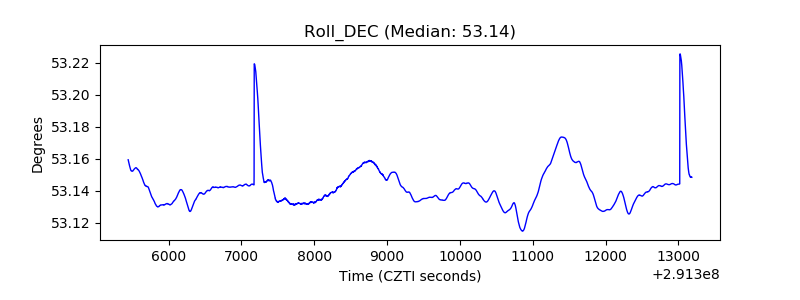 |
| _Roll_RA | 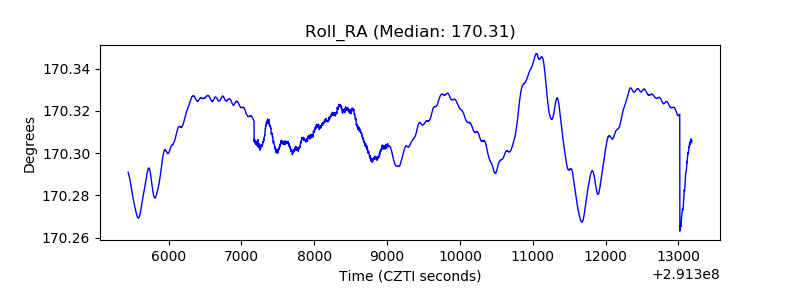 |
| Veto Counter | 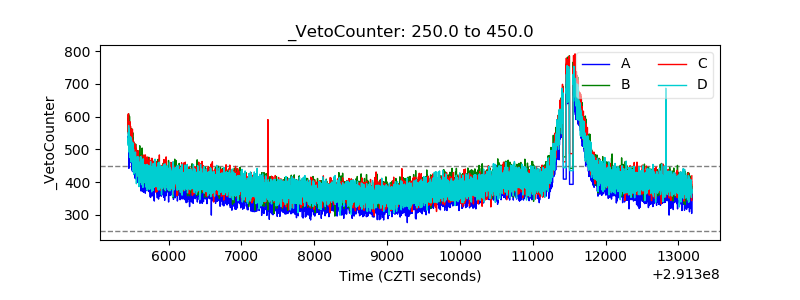 |